Abstract
Apomine is a novel compound that inhibits the mevalonate/isoprenoid pathway of cholesterol synthesis and may prove effective as a skin cancer chemoprevention therapy. This research was focused on the development of a new delivery approach for the topical treatment of melanoma using topically delivered Apomine. This included evaluating the effect of several factors on the stability of Apomine in solution, utilizing these to develop a topical formulation, and conducting efficacy studies with the developed topical formulation in the TPras mouse model. Preformulation included the influence of pH, buffer species, ionic strength, and organic solvents on the stability of Apomine at four different temperatures. Apomine was determined to undergo apparent first-order degradation kinetics for all conditions evaluated. Apomine undergoes base catalyzed degradation with less than 15% degradation seen in >200 days under acidic conditions. Long-term stability studies were performed on two different topical cream formulations and indicate that both formulations are chemically stable for over 1 year at both 4 and 23°C. The efficacy of topically applied Apomine, from ethanol and developed 1% cream, was evaluated in vivo against the incidence of melanoma Regardless of delivery vehicle Apomine treatment caused a significant reduction in tumor incidence. Ethyl alcohol application of Apomine resulted in a greater tumor incidence reduction when compared to the development cream formulation; however, this difference was not significant.
Keywords: Apomine, preformulation studies, general acid/base catalysis, pH stability, solubility, topical formulation, TPras mouse model, in vivo efficacy
1. Introduction
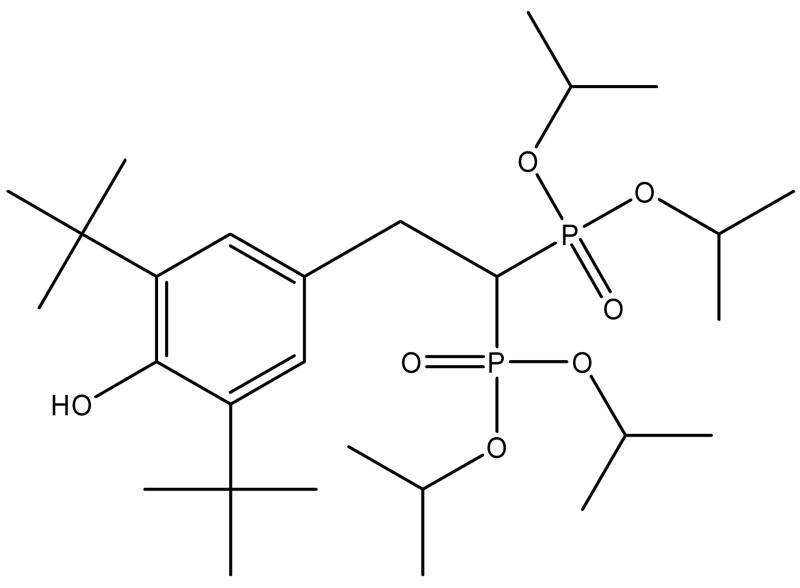
Apomine (Figure 1), [2-(3,5-Di-tert-butyl-4-hydroxy-phenyl)-1-(diisopropoxy-phosphoryl)-ethyl]-phosphonic acid diisopropyl ester, is a novel antineoplastic agent, which is one of a family of compounds that inhibits the mevalonate/isoprenoid pathway of cholesterol synthesis (Flach et al., 2000; Nguyen et al., 2002; Roitelman et al., 2004; Lewis et al., 2006 and Roelofs et al., 2007). Apomine accelerates the degradation of 3-hydroxy-3-methylglutaryl-coenzyme A reductase (HMGR) (Edwards et al., 2007). HMGR is an enzyme that catalyzes the first step of the mevalonate pathway, leading to the syntheses of cholesterol and other isoprenoid compounds. As a result of this mechanism, Apomine inhibits the growth of cancer cells from a number of cancer types, including lung, colon, breast and skin (Pourpak et al., 2007). Additionally, it induces apoptosis in tumor cell lines derived from leukemia, colon, liver, ovary, and breast cancers (Flach et al., 2000). Early clinical data suggest Apomine may be clinically active in humans (Alberts et al., 2001).
Figure 1.
Structure of Apomine.
According to the American Cancer Society, more then one million cases of skin cancer go unreported annually. For 2008, an estimated 62,480 new cases will be the most serious form of skin cancer, melanoma, resulting in an estimated 11,200 deaths (American Cancer Society, 2008). Based on the increasing yearly incidence of skin cancer, there is an increasing need for effective chemopreventive drugs (Stratton et al., 2006). Here we investigate Apomine as a potential chemopreventative agent for melanoma.
Apomine’s physiochemical properties, calculated octanol/water partition coefficient (CLogP) of 6.09 (ClogP, 1995), and low water solubility, calculated to be 3.98 * 10−7 molar, by the General Solubility Equation of Yalkowsky (Yalkowsky, 1999; Jain and Yalkowsky, 2001), are desirable for formulation in a topical cream base. Despite its known activity against the aforementioned cancers, little is known about the stability of Apomine as a function of pH, temperatures, and in different solvents. These data are necessary in determining if Apomine may be utilized in potential formulations. To this end, the stability of Apomine was determined in a variety of different aqueous and non-aqueous systems. Concurrently, with the low calculated aqueous solubility, solubility was explored as a function of different cosolvent concentrations. Based on these data, a topical formulation was developed for stability determination. The stability of this formulation was evaluated prior to long-term efficacy evaluation.
Following the development of a suitable topical formulation of Apomine the efficacy was evaluated in vivo in the TPras mouse model. In this model the efficacy of a topically applied 1% Apomine formulation was evaluated as a potential chemoprevention and/or therapeutic agent against DMBA (7,12-Dimethylbenz[a]anthracene)-induced melanomas.
2. Material and Methods
2.1. Materials
Apomine was supplied by ILEX Oncology (San Antonio, TX, USA). Dibasic potassium phosphate, monobasic sodium phosphate, sodium chloride (NaCl), and 37% hydrochloric acid were purchased from Sigma (St. Louis, MO, USA). Citric acid was received from Spectrum (New Brunswick, NJ, USA). Boric acid was obtained from Aldrich (Milwaukee, WI, USA). Sodium hydroxide (NaOH) was obtained from EM Science (Darmstadt, Germany). A Millipore water purification system with a 0.22-μm filter was utilized for water. Tetrahydrofuran (THF) and isopropyl alcohol (IPA), both of HPLC grade, were purchased from Burdick and Jackson (Muskegon, MI, USA). HPLC grade acetonitrile (ACN) was purchased from EMD (Gibbstown, NJ, USA). Ethyl alcohol (EtOH), 200 proof, was received from Aaper Alcohol and Chemical Co. (Shelbyville, KY, USA). Dermabase cream was purchased from Paddock laboratories, Inc. (Minneapolis, MN, USA).
2.2. High performance liquid chromatography (HPLC) method
The HPLC system consisted of a Waters 2690 separation module (Waters, Milford, MA, USA) coupled with a Waters 996 Photodiode array (PDA) detector. Separation was achieved on a C18 column head at 30°C with detection at 210 nm. Instrument control, data acquisition, processing, and peak symmetry was analyzed using Millenium32 Chromatography Manger Software (Waters, Milford, MA, USA).
Stability for Apomine in the topical formulation was conducted via a gradient chromatographic method in order to separate Apomine from its degradation product and the cream excipients (Kuehl, et al., 2006). Aqueous samples and organic stability were analyzed via initial isocratic conditions (63:35, ACN-H2O) for 12 min, with a flow rate of 0.6 ml/min (Kuehl, et al., 2006).
2.2.1. Specificity and selectivity
The specificity and selectivity of the assay for Apomine was confirmed with both mass spectrometry and library spectra matching, using a PDA detector. The initial isocratic conditions were used to analyze a standard of Apomine by liquid chromatography-mass spectrometry (LC-MS) (Finnigan MAT TSQ 7000, in positive ion mode). Further confirmation of peak purity was conducted using data collected from a 996 PDA detector and analyzed with Millenium32 Chromatography Manger Software. A library spectrum was used to check for peak purity and confirm the absence of co-eluting species.
2.3. pH measurements
All pH measurements were conducted on a Hanna Instruments Model HI 221 (Woonsocket, RI, USA) pH/mV meter with a model HI 1083 pH probe for aqueous samples, while cream samples were analyzed with a ThermoOrion, model 8135BN (Beverly, MA, USA), flat surface electrode. The pH of aqueous solutions were measured at the beginning, throughout the stability run, and upon completion of each stability trial, while cream pH measurements were acquired at each pull point. The instrument was calibrated each day with a two-point curve bracketing the expectant pH values.
2.4. Solubility studies
The solubility of Apomine was determined as a function of pH, from pH 2.0 to 12.0, at intervals of 1.0-pH units. Solubility between pH 2.0 and 5.0 was determined in a 0.1 M-citrate buffer, between pH 5.0 and 9.0 with a 0.1 M-phosphate buffer, and between pH 9.0 and 12.0 with a 0.1 M-borate buffer. All buffers had an ionic strength of 0.2 M, adjusted with NaCl. Due to the fact that aqueous solubility is below the limit of detection (LOD), ACN was used as a cosolvent at 20% (v/v). The solubility of Apomine was also evaluated as a function of various cosolvents. EtOH, ACN, and IPA were mixed with water in volume fractions of 5, 10, 15, 20, 25, and 30%. All solubility samples were run in duplicate and allowed to equilibrate at 23°C for at least 48 h. Prior to analysis via HPLC, samples were filtered with a 0.2-μm PTFE filter.
2.5. Stability studies
2.5.1. Effect of pH
The effect of pH on the stability of Apomine was evaluated with a citrate buffer (0.1 M) in the pH range of 2.0 to 5.0, a phosphate buffer (0.1 M) in the range of 5.0 to 9.0 and a borate buffer (0.1 M) in the range of 9.0 to 12.0. Buffers were pH adjusted with NaOH and HCl as needed, while ionic strength was adjusted to 0.2 M with NaCl. The influence of ionic strength was tested by using a citrate buffer at pH 5.0, a phosphate buffer at pH 7.0, and with a borate buffer at pH 9.0. The ionic strength of these samples was adjusted to 0.2, 0.3, and 0.5 M with NaCl. Stability was determined using HPLC. In order to achieve adequate solubility levels aqueous samples were prepared with ACN as a cosolvent at 25% (v/v).
2.5.2. Effect of temperature
Temperature influences on the degradation rates of Apomine were determined at four different temperatures (4, 23, 37, and 48°C). Analysis of the degradation rates of Apomine at different temperatures affords the assessment of activation energy.
2.5.3. Effect of organic solvents
The influence of organic solvents on the stability of Apomine was tested with ACN, IPA, and EtOH at four different temperatures (4, 23, 37, and 48°C).
In order to accurately determine the effect of each condition on the degradation of Apomine, samples were typically analyzed for a minimum of six sample points, spanning three to six half-lives. In order to reduce the potential for self catalysis samples were prepared at a dilute concentration of 0.12 mg/mL (Waterman and Adami, 2005). Stability samples were assayed via the isocratic assay previously described.
2.6. LC-MS analyses of degradation product
Structural determination of the principle degradation product was conducted via mass spectrometry. LC-MS analyses were performed on the Finnigan MAT TSQ 7000 (ThermoElectron, San Jose, CA, USA) equipped with a HP 1050 HPLC (Hewlett Packard/Agilent Technologies, Germany). LC separations were performed using an Alltima C18, 150 × 2.1 mm column with 20-min isocratic gradient: 0.01% TFA in ACN:H2O (65:35) at 0.5–ml/min flow rate. Analytes were ionized using atmospheric pressure chemical ionization (APCI). The MS settings were as follows: scan type: full; polarity: positive; mass range: 100 – 1200 m/z. All samples were analyzed in the first quadrupole (Q1 MS mode). The following were the APCI source operating parameters: heated capillary temperature: 225°C; vaporizer temperature: 400°C; corona discharge current: 4.0 μA.
2.7. DSC-TGA methods
Thermal analysis was preformed with a Q1000 Differential Scanning Calorimeter (DSC) (TA Instruments, New Castle, DE, USA) series with an auto sampler. Indium was used for the calibration of the DSC. One to 2 mg were weighed and placed in aluminum pans and crimped with an aluminum lid. Samples were equilibrated and isothermally heated at 30°C for 5 min, followed by heating at 5°C/min up to 300°C. A nitrogen purge was used at 40 ml/min for each sample.
Thermogravimetric analysis (TGA) was performed on a TA Instruments Q50 TGA. Sample weights of 1 to 2 mg were placed in an empty aluminum pan and heated at 5°C/min up to 300°C. Weight loss as a function of temperature was analyzed under nitrogen at a 60 ml/min purge.
2.8. Cream preparation
Topical formulations of Apomine were prepared in Dermabase cream. Dermabase is an oil-in-water emulsion cream base. The main components of Dermabase include; water (55%) petrolatum (>15%), mineral oil (>15%), and cetostearyl alcohol (>10%); all other ingredients are less then 5% (Paddock Labs, 1996). Apomine was incorporated into the cream base by first wetting Apomine with mineral oil (5% w/w of final cream weight) and mixing, in a stainless steel beaker, on a magnetic stir plate. Upon completion of mixing with a stir bar, mixing was continued with a Lightnin Labmaster Mixer (Model DS 1010). While mixing, Dermabase cream was gradually added over 10 min. Once all of the cream base was added, the cream was allowed to mix for 20 min at 1300 rpm. The resultant cream was smooth, white, and homogeneous with no discernible phase separation. Chemical analysis was conducted by dissolving ~0.2 g of cream base in 10 mL of THF. The solution was then sonicated for 10 min and assayed via the described HPLC assay (Kuehl et al., 2006).
2.9. In vivo experiments
The development of the TPras mouse model has been previously described (Lluria-Prevatt, et al., 2002). All mice were housed in an Association for Assessment and Accreditation of Laboratory Animal Care International-University Animal facility with 12-h light cycles. Food and water were provided ad libitum. TPras mice were randomly set up in groups of 49 for control animals and 22 – 29 for treatment groups. Studies began when the mice were 5 – 6 weeks of age.
The backs of the mice were shaved and treated with either 150 μL of 5% Apomine in ethanol or 75 μL of the 1% Apomine cream twice a week. The treatment was initiated 1 week prior to 5 weekly applications of DMBA (50 μl in 100 μl of acetone). The application of either the 1% Apomine Formulation or the Apomine in EtOH was continued for 35 weeks when the animals were sacrificed. The mice were observed weekly for the presence of melanocytic lesions.
2.10. Statistical methods
Tumor onset distributions (cumulative observed tumor probabilities over the course of the study) for the three treatments (DMBA alone, 1% Apomine cream, Apomine in EtOH) were compared using life table methods (Kalbfeisch and Prentice, 1980). Drug efficacy was assessed via pairwise comparisons of the DMBA tumor onset function with those of the two Apomine treatments. Differential efficacy of the Apomine treatments was evaluated through a comparison of their tumor onset functions. The life table methodology that was utilized provides a joint statistical assessment of the relative frequency of tumors among treatments as well as the times of tumor occurrence. Statistical significance assessments were based on tests of log-rank scores, with calculations performed using the SAS® software system procedure LIFETEST.
3. Results
3.1. Chromatography
Aqueous samples were analyzed for 15 min via the isocratic conditions described above. Under these conditions Apomine (tr ~8.2) is baseline resolved from its degradation product (tr ~ 6.2) and has a peak tailing factor of 1.59. Cream samples were analyzed via a gradient method. The gradient method has been developed per the guidelines provided in ICH Q2B and FDA Guidance for Industry (ICH Q2B, 1997; FDA Guidance, 2000; Kuehl et al., 2006) and has established the specificity and selectivity of the assay for both Apomine and its degradation product.
3.2. Solubility of Apomine
The solubility of Apomine was explored as a function of pH, from pH 2.0 to pH 12.0 (data not shown). ACN (20% (v/v), 55 μg/mL) was used as a cosolvent to increase the solubility to a detectable level. These data indicate that the solubility of Apomine does not change as a function of pH.
The aqueous solubility of Apomine is below the LOD, 1.56 μg/mL. Therefore the solubility of Apomine was determined as a function of cosolvent concentration for three different cosolvents (ACN, IPA, and EtOH). Each of these three cosolvents exhibited a log linear increase in the solubility of Apomine. EtOH was the most effective at solubilizing Apomine followed by ACN and then by IPA, as indicated by the slope of the linear regression analysis.
3.3. Stability of Apomine
3.3.1. Effect of pH
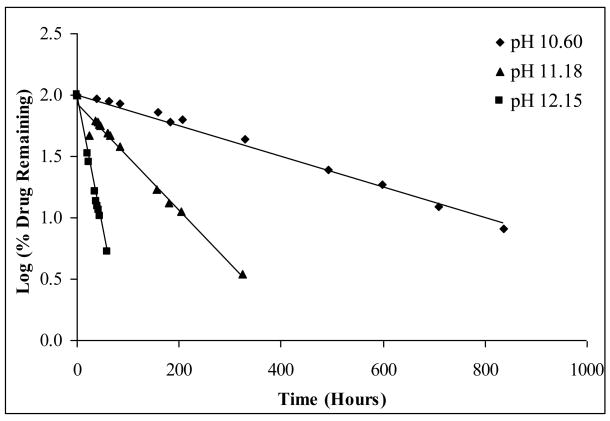
The degradation of many drugs can be catalyzed by either hydrogen ions or hydroxide ions, or in some cases both. Apomine undergoes apparent first-order degradation, as can be seen by the profiles for pHs 10.60, 11.18, and 12.15 at 23°C, shown in Figure 2. Degradation rate constants (k) were calculated from the slope of the linear best-fit line for the relationship between the logarithm percent drug remaining versus time.
Figure 2.
Log percent (%) drug remaining versus time of Apomine at pHs 10.60, 11.18, and 12.15 in a borate buffer at 23°C, error bars omitted as they are within the scale of the symbols.
Rate constants were used to calculate the half life (T50) and usage life (T95). These data are summarized in Table 1 for the configurations tested; note these values are all at 23°C and 0.2 M ionic strength. It is important to note that stability data was collected for ~200 days, at which point pH values 5.0 and below had not degraded more than 15%, thereby not affording accurate determination of rate constants. As such, specific rate constants along with T50 and T95 are merely discussed for completeness, appreciating that these are the conditions at which Apomine is the most stable.
Table 1.
| pH | k (per hour) | T50 (h) | T95 (h) |
|---|---|---|---|
| 7.55 (Phosphate) | 0.000106 | 6513 | 484 |
| 8.62 (Phosphate) | 0.000191 | 3636 | 270 |
| 9.36 (Phosphate) | 0.000304 | 2280 | 169 |
| 9.72 (Borate) | 0.00222 | 312 | 23.2 |
| 10.60 (Borate) | 0.00287 | 241 | 17.9 |
| 11.18 (Borate) | 0.0109 | 63.8 | 4.74 |
| 12.15 (Borate) | 0.0504 | 13.7 | 1.02 |
Half-life
Usage life
Note: Rate constants for T50 and T95 are omitted for pH 6.0 and below as a result of stability of Apomine in acid medium.
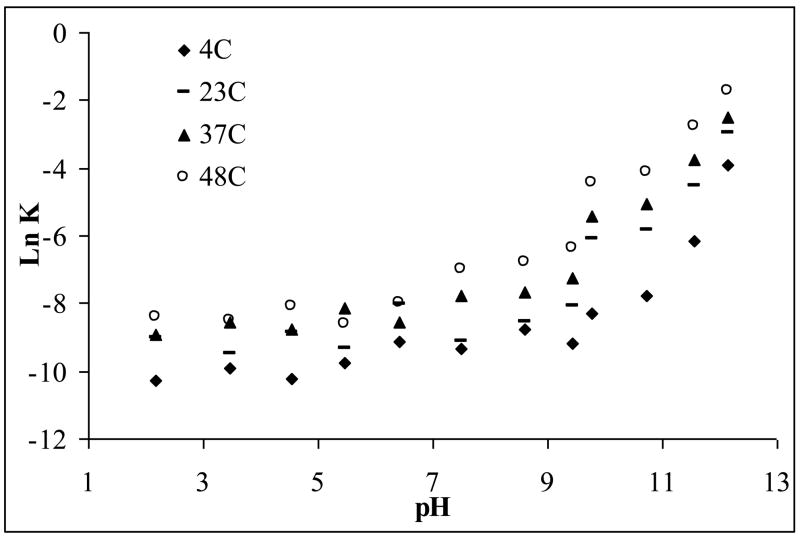
A pH rate profile at different temperatures is shown in Figure 3. This pH rate profile clearly indicates that Apomine undergoes base catalyzed degradation with no appreciable degradation evident under acidic conditions. No pH change was noted in any of the samples studied. The slope of the best fit line for basic the pHs, 12.0 to 8.0, at all four temperatures, differ from unity, indicating general base catalysis.
Figure 3.
pH-rate profile (Ln K, degradation rate constant, versus pH) for Apomine at four different temperatures of 4, 23, 37, 48°C, error bars omitted as they are within the scale of the symbols.
3.3.2. Effect of buffer species
The effect of buffer species was evaluated at pH 5.0 and pH 9.0. Apomine was determined to undergo apparent first-order degradation regardless of buffer species. Table 2 shows the calculated T50 values for phosphate and borate buffers at pH 9.0; as shown Apomine is more stable in the phosphate buffer as opposed to the borate buffer. The difference in stability as a function of buffer species further supports the fact that Apomine undergoes general base catalysis. This could have been the result of buffer catalysis with the borate counterion. Buffer overlap was also evaluated at pH 5.0; these samples, however, did not show any difference in stability.
Table 2.
T50a for pH 9.0 with phosphate and borate buffers at 4, 23, 37, and 48°C.
| T50 (h) |
||||
|---|---|---|---|---|
| pH 9.0 | 4°C | 23°C | 37°C | 48°C |
| Phosphate | 6613 | 2280 | 987 | 413 |
| Borate | 2776 | 312 | 158 | 59.7 |
Half-life
3.3.3. Effect of ionic strength
As previously detailed in Section 2.5.1. the effect of ionic strength was determined at three different pHs (5.0 citrate buffer, 7.0 phosphate buffer, and 9.0 borate buffer). As with the previous results, no conclusions are draw at pH 5.0. Table 3 shows the effect of ionic strength at pH 7.0 and 9.0. No trend was noted for the change in degradation rate as the ionic strength of the medium increased for pH 9.0 while the degradation rate was shown to be directly related to the ionic strength of the medium at pH 7.0. Potentially explaining this interesting result is the fact that the lower concentration of catalyst (OH-) at pH 7.0 could enhance stabilization of the intermediate in the degradation pathway. The increase in ionic strength may then stabilize the charged intermediate, required for the conversion of the phenol to the ketone, (discussed later in Section 3.6) and result in a greater change in degradation rate at pH 7.0 than at pH 9.0.
Table 3.
The effect of ionic strength on the degradation rate of Apomine at 23°C at pH 7.0 and 9.0.
| pH 7.0 | |||
|---|---|---|---|
| Ionic Strength | k (per h) | T50a (h) | T95b (h) |
| 0.2 | 0.000106 | 6513 | 484 |
| 0.3 | 0.000343 | 2020 | 150 |
| 0.5 | 0.000364 | 1905 | 142 |
|
pH 9.0 | |||
| Ionic Strength | kc (per h) | T50 (h) | T95 (h) |
| 0.2 | 0.002220 | 312 | 23.2 |
| 0.3 | 0.001244 | 557 | 41.4 |
| 0.5 | 0.001773 | 391 | 29.0 |
Half-life
Usage life
Degradation rate constant
3.4. Effect of temperature: Arrhenius expression
Degradation rates are a function of temperature and can be related through the Arrhenius equation:
where k is the degradation rate constant, A is the frequency factor, Ea is the activation energy, R is the gas constant, and T is the temperature in Kelvin (Martin et al., 1983). Natural logarithms of the degradation rates were plotted as a function of the inverse of temperature. The best fit linear for these plots were linear and therefore the data are not shown.
From these linear plots it is evident that the degradation rate of Apomine is directly related to the temperature, in the range studied. The calculated activation energies for these pHs are shown in Table 4. The apparent trend of decreasing activation energy as the pH value increases can be attributed to the increased hydroxide ion concentration at the higher pH.
Table 4.
Activation energies for four different pH values.
| pH | Slope | Ea (kJ/mol)a |
|---|---|---|
| 9.72 | −7.54 | 62.7 |
| 10.60 | −7.26 | 60.3 |
| 11.18 | −6.61 | 55.0 |
| 12.15 | −4.29 | 35.6 |
3.5. Effect of organic solvents
The stability of Apomine was explored in three different organic solvents (ACN, IPA, and EtOH) at 4, 23, 37, and 48°C. As no appreciable degradation was seen for the three organic solvents these data are not shown. These data suggest that Apomine is stable in organic solvents for the time course and temperatures studied.
3.6. Degradation mechanism
For all degradation studies conducted on Apomine the same degradation peak was evident on all chromatographs. In order to elucidate the chemical structure of this degradation product, degraded Apomine aqueous samples were analyzed via mass spectrometry to determine the molecular weight. Mass spectrometric analysis of Apomine (positive APCI) indicated a parent molecular ion at m/z 563.1, corresponding to a molecular weight of 562. Mass spectrometric analysis indicated a molecular weight of 560 for the degradation product (M-2).
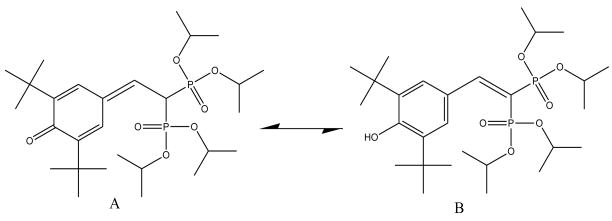
With the knowledge that Apomine is predominately stable under acidic conditions, the proposed product formed by base catalyzed degradation is shown in Figure 4. These two structures are tautomers of each other with a molecular weight of 560. Analysis of the HPLC chromatograms indicates that the degradation product elutes prior to the parent molecule on a C18 column in a reversed phase assay. This suggests that the degradation product is less hydrophobic than the parent molecule. The parent molecule has a CLogP of 6.09 and the tautomers have CLogP’s of 5.53 and 8.07 for A and B, respectively. Based on these data, tautomer A, the ketone, is suggested as the preferred tautomer under all conditions studied.
Figure 4.
Proposed degradation product for Apomine. Note that A and B are tautomers of each other.
3.7. Solid state analysis
Examination of solid Apomine via cross polarized light showed birefringence. Analysis of the Apomine drug substance via DSC displays a melting endotherm at 106°C, with an energy of melting of 83 J/g. TGA analysis indicates that Apomine was nonsolvated and initiates decomposition after melting at around 150°C.
3.8. Topical formulation stability
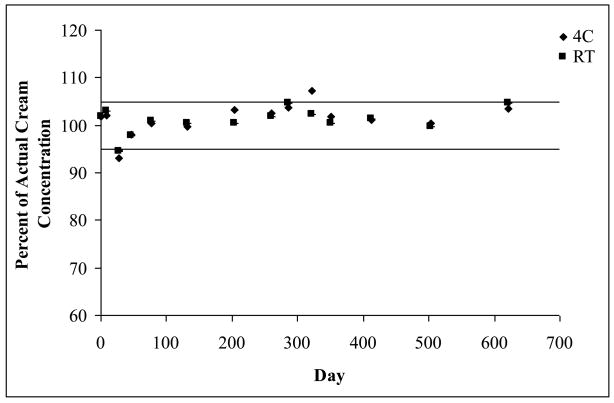
Physical and chemical stability of the Apomine cream has been studied for two different concentrations (0.1% and 1.0% (w/w)) stored at both 4 and 23°C for at least 12 months, in sealed tubes. Throughout this time course, the formulation was physically stable with no discernable phase separation. Chemical analysis has been conducted utilizing the HPLC method (Kuehl et al., 2006).
Figure 5 shows the stability of a 1% Apomine cream stored at both 4 and 23°C for over 600 days. The solid lines represent a range of ± 5%. The cream was considered stable if the concentration laid within this 5% range.
Figure 5.
Stability of a 1% Apomine cream stored at both 4 and 23°C. Solid lines indicate a range of ± 5%; error bars representing standard deviations are present, n = 2.
Indeed these data are consistent with the preformulation studies (aqueous stability, organic media stability and lipophilicity). The pH of the cream formulation is near 5.7. and as observed from the aqueous stability data, Apomine is very stable at this pH. Furthermore, it is important to consider the partitioning of the drug in the cream base. A preliminary study was conducted to determine the respective concentrations of Apomine in the organic and aqueous phases, however the concentration of Apomine in the aqueous layer was below the LOD, therefore calculated values were used. Based on the CLogP (6.09), almost all of the drug will partition into the organic phase of the cream base. Once again as presented in Section 3.5, Apomine appears to be stable in the organic phase of the topical cream.
3.9. Reduction of melanoma incidence by topically applied Apomine
The efficacy of Apomine from the cream formulation and EtOH was determined in the TPras mouse model with twice weekly treatment starting 1 week before application of DMBA (50 μg). Control mice received the DMBA alone. Tumor incidence results are shown in Table 5 and Figure 6. There was unequivocal statistical evidence that Apomine in both EtOH and the cream formulation reduced tumor incidence. In relative terms, the reductions ranged from 47% (45.5/85.1) for Apomine cream to 72% (24.1/85.1) for Apomine in EtOH. However, while there was insufficient evidence to infer a statistically significant (p < 0.05) difference in the degree of drug efficacy for the two treatment groups, p value of 0.23 from Table 5, it has been reported that ethanol can alter the topical delivery of different drugs (Duracher et al., 2009 and Balakrishnan et al., 2009). Furthermore, as permeation of drug molecules across the skin occurs by passive diffusion (Farahmand et al., 2009) the non-statistical increase in activity from the ethanol delivery may have been the result of the increase in Apomine concentration in ethanol. Visually the absence of statistical evidence is demonstrated by overlapping confidence intervals for tumor incidence corresponding to the two Apomine treatments shown in Figure 6. Conversely, the clear evidence of the efficacy of the drug can be seen in the separation of the DMBA confidence interval from those of the Apomine treatments.
Table 5.
Comparison of tumor incidence relative to Apomine treatment.
| Apomine Treatment | Cumulative Tumor Incidence at End of Study Tumors/Animals | Drug Efficacy Difference Relative to DBMAa | Comparative Drug Efficacy - Difference in Apomine Treatmentsa |
|---|---|---|---|
| None (DMBA) | 40/47 (85.1%) | --- | --- |
| Apomine Cream | 10/22 (45.5%) | p < 0.001 | p = 0.230 |
| Apomine in EtOH | 7/29 (24.1%) | p < 0.001 |
Based on likelihood ratio chi square test
Figure 6.
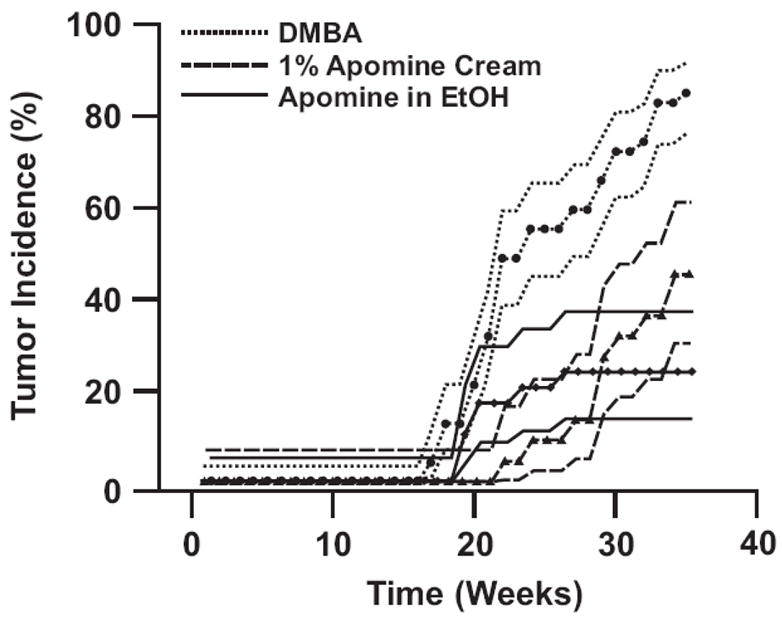
Observed cumulative tumor incidence (dotted narrow lines with data points that represent the actual data) and 80% confidence limits (bold lines without data points). Lack of overlap between confidence intervals approximates a statistically significant (p = 0.05) test for equality of tumor incidence over time. Note that DMBA application is started 1 week after application of Apomine initiates.
4. Conclusions
Theses data demonstrate that Apomine undergoes apparent first-order, base-catalyzed, degradation. Degradation of Apomine results in the same major oxidation product, regardless of the condition tested. The solubility of Apomine is below the LOD in water while EtOH, ACN, and IPA were shown to have nearly the same solubilization power as cosolvents. Furthermore, Apomine was formulated in a topical cream base and analyzed for stability for over 12 months. Apomine was found to be chemically stable for over 12 months in the topical cream base. To this end, in vivo efficacy studies were conducted to evaluate the formulation. Both the Apomine cream formulation and Apomine in EtOH resulted in a statistically significant reduction in tumor incidence. While the EtOH application of Apomine resulted in a greater degree of tumor incidence reduction (72%) than the Apomine cream formulation (47%), this difference was determined not to be statistically different. These data verify that Apomine is efficacious in the tumor model and warrants further investigation for chemoprevention of melanoma.
Acknowledgments
This work was supported by PHS CA27502. Mass Spectra were acquired in the AZCC/SWEHSC Proteomics Core supported by NIEHS grant ES06694 and NIH/NCI grant CA023074.
Footnotes
Publisher's Disclaimer: This is a PDF file of an unedited manuscript that has been accepted for publication. As a service to our customers we are providing this early version of the manuscript. The manuscript will undergo copyediting, typesetting, and review of the resulting proof before it is published in its final citable form. Please note that during the production process errors may be discovered which could affect the content, and all legal disclaimers that apply to the journal pertain.
References
- Alberts DS, Hallum AV, III, Stratton-Custis M, Garcia DJ, Gleason-Guzman M, Niesor EJ, Floret S, Bentzen CL. Phase I pharmacokinetic trial and correlative in vitro Phase II tumor kinetics study of Apomine (SR-45023A), a novel oral bisphosphonate anticancer drug. Clin Cancer Res. 2001;7:1246–1250. [PubMed] [Google Scholar]
- American Cancer Society. Cancer Facts and Figures 2008. Atlanta: American Cancer Society; 2008. [Google Scholar]
- Balakrishnan P, Shanmugam S, Lee WS, Lee WM, Kim JO, Oh DH, Kim DD, Kim JS, You BK, Choi HG, Woo JS, Yong CS. Formulation and in vitro assessment of minoxidil niosomes for enhanced skin delivery. Int J Pharm. 2009;377:1–8. doi: 10.1016/j.ijpharm.2009.04.020. [DOI] [PubMed] [Google Scholar]
- ClogP for Windows, Version 4.0. Biobyte Corp; 1995–1999. [Google Scholar]
- Duracher L, Blasco L, Hubaud JC, Vian L, Marti-Mestres G. The influence of alcohol, propylene glycol and 1,2-pentanediol on the permeability of hydrophilic model drug through excised pig skin. Int J Pharm. 2009;374:39–45. doi: 10.1016/j.ijpharm.2009.02.021. [DOI] [PubMed] [Google Scholar]
- Edwards CM, Mueller G, Roelofs AJ, Chantry A, Perry M, Russell RGG, Van Camp B, Guyon-Gellin Y, Niesor EJ, Bentzen CL, Vanderkerken K, Croucher PI. Apomine, an inhibitor of HMG-CoA-reductase, promotes apoptosis of myeloma cells in vitro and is associated with a modulation of myeloma in vivo. Int J Cancer. 2007;120:1657–1663. doi: 10.1002/ijc.22478. [DOI] [PubMed] [Google Scholar]
- Farahmand S, Maibach HI. Estimating skin permeability from physicochemical characteristics of drugs; A comparison between conventional models and an in vivo-based approach. Int J Pharm. 2009;375:41–47. doi: 10.1016/j.ijpharm.2009.03.028. [DOI] [PubMed] [Google Scholar]
- FDA (Federal Drug and Food Administration) Guidance for Industry: Analytical Procedures and Methods Validation Chemistry, Manufacturing, and Controls Documentation, Aug. 2000. Center for Drug Evaluation and Research (CDER); Rockville, MD: 2000. Available at http://www.fda.gov/CbER/gdlns/methval.htm. [Google Scholar]
- Flach J, Antoni I, Villemin P, Bentzen CL, Niesor EJ. The mevalonate/isoprenoid pathway inhibitor Apomine (SR-45023A) is antiproliferative and induces apoptosis similar to farnesol. Biochem Biophys Res Commun. 2000;270:240–246. doi: 10.1006/bbrc.2000.2421. [DOI] [PubMed] [Google Scholar]
- ICH Q2B. Validation of Analytical Procedures. Methodology. 1997 May; [Google Scholar]
- Jain N, Yalkowsky SH. Estimation of the aqueous solubility I: Application to organic nonelectrolytes. J Pharm Sci. 2001;90:234–252. doi: 10.1002/1520-6017(200102)90:2<234::aid-jps14>3.0.co;2-v. [DOI] [PubMed] [Google Scholar]
- Kalbfleisch JD, Prentice RL. The Statistical Analysis of Failure Time Data. John Wiley and Sons; New York: 1980. [Google Scholar]
- Kuehl PJ, Angersbach BS, Stratton SP, Myrdal PB. Development of an HPLC method for the analysis of Apomine in a topical cream formulation. J Pharm Biomed. 2006;40:975–980. doi: 10.1016/j.jpba.2005.07.046. [DOI] [PubMed] [Google Scholar]
- Lewis KD, Thompson JA, Weber JS, Robinson WA, O’Day S, Lutzkey J, Legha SS, Floret S, Ruvana F, Gonzalez R. A phase II open-label trial of Apomine (SR-45023A) in patients with refractory melanoma. Investig New Drugs. 2006;24:89–94. doi: 10.1007/s10637-005-4544-y. [DOI] [PubMed] [Google Scholar]
- Lluria-Prevatt M, Morreale J, Gregus J, Alberts DS, Kaper F, Giaccia A, Powell MB. Effects of perillyl alcohol on melanoma in the TPras mouse model, Cancer Epidemiol. Biomark Prevent. 2002;11:373–379. [PubMed] [Google Scholar]
- Martin A, Swarbrick J, Cammarata A. Physical Pharmacy. 3. Lea & Febiger; Pennsylvania: 1983. [Google Scholar]
- Nguyen LM, Niesor EJ, Bentzen CL, Phan HT. Inhibition of cholesterol synthesis and antiproliferative activity of a series of novel phenol-substituted 1,1-bisphosphonate esters. Curr Med Chem –Immunol Endocrinol Metabol Agents. 2002;2:205–217. [Google Scholar]
- Paddock Laboratories, Inc. Dermabase Cream Material Data Safety Sheet. 1996 Date Prepared: 10-10-90, Revised: 7-26-96. Available at http://www.paddocklabs.com/forms/msds/dermabas.pdf.
- Pourpak A, Dorr RT, Meyers RO, Powell MB, Stratton SP. Cytotoxic activity of Apomine is due to a novel membrane-mediated cytolytic mechanism independent of apoptosis in the A375 human melanoma cell line. Investig New Drugs. 2007;25:107–114. doi: 10.1007/s10637-006-9015-6. [DOI] [PubMed] [Google Scholar]
- Roelofs AJ, Edwards CM, Russell RGG, Ebetino FH, Rogers MJ, Hulley PA. Apomine enhances the antitumor effects of lovastatin on myeloma cells by down-regulating 3-hydroxy-3-methylglutaryl-, coenzyme A reductase. J Pharmacol Exp Ther. 2007;322 (1):228–235. doi: 10.1124/jpet.106.116467. [DOI] [PMC free article] [PubMed] [Google Scholar]
- Roitelman J, Masson D, Avner R, Ammon-Zufferey C, Perez A, Guyon-Gellin Y, Bentzen CL, Niesor EJ. Apomine, a novel hypocholesterolemic agent, accelerates degradation of 3-hydroxy-3-methylglutaryl-coenzyme A reductase and stimulates low density lipoprotein receptor activity. J Biol Chem. 2004;279:6465–6473. doi: 10.1074/jbc.M308094200. [DOI] [PubMed] [Google Scholar]
- Stratton SP, Stratton MS, Alberts DS. Promising agents for chemoprevention of skin cancer. Curr Oncol. 2006;13(5):185–186. [PMC free article] [PubMed] [Google Scholar]
- Waterman KC, Adami RC. Accelerated aging: prediction of chemical stability of pharmaceuticals. Int J Pharm. 2005;293:101–125. doi: 10.1016/j.ijpharm.2004.12.013. [DOI] [PubMed] [Google Scholar]
- Yalkowsky SH. Solubility and Solubilization in Aqueous Media. Oxford University Press; New York: 1999. [Google Scholar]


