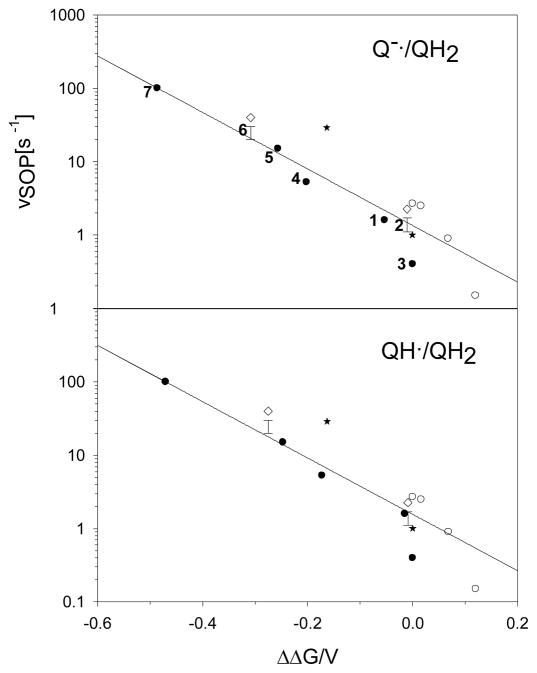
Figure 2.
The Vmax for superoxide production, vSOP,, in μmoles of superoxide per μmole of cyt bc1 s−1 measured with saturating amounts of substrate analog and corresponding to Vmax. Rates are plotted as a function of the shift, ΔΔG, in oxidation potential for substrate analogs (Upper for QH2/Q−•; Lower for QH2/QH•) or reduction potential for the Rieske ISP. (●) vSOP for substrate analogs from Table 1, the analog is indicated by number to the left of the symbol; (○) vSOP for Rieske ISP mutants from Forquer, et al.(34) measured using the Amplex Red assay; (*) vSOP for substrate analogs UQ3 and RQ3 from Cape, et al.(19); (◇) Vmax for total bypass in μmoles of substrate analog oxidized per μmole of cyt bc1 s−1 for (2) and (6) with the typical range for the vSOP indicated directly below by ‘error’ bars.

