

Abstract
In vivo tuberculosis is exposed to continually changing drug concentrations for which static minimum inhibitory concentration (MIC) testing may be a poor surrogate. While in vitro approaches to determine time-kill curves for antibiotics have been widely applied in assessing antimicrobial activity against fast growing microorganisms, their availability and application for slow growing microorganisms including M. tuberculosis has so far been scarce. Thus, we developed a novel simple in vitro pharmacokinetic/pharmacodynamic (PK/PD) model for establishing time-kill curves and applied it for evaluating the antimicrobial activity of different dosing regimens of isoniazid (INH) against Mycobacterium bovis BCG as a surrogate for virulent M. tuberculosis. In the in vitro model M. bovis BCG was exposed to INH concentration-time profiles as usually encountered during multiple dose therapy with 25, 100 and 300 mg/day in humans who are fast or slow INH metabolizers. Bacterial killing was followed over time by determining viable counts and the resulting time-kill data was analyzed using a semimechanistic PK/PD model with an adaptive IC50 function to describe the emergence of insensitive populations of bacteria over the course of treatment. In agreement with previous studies, the time-kill data suggest that AUC0-24/MIC is the PK/PD index that is the most explanatory of the antimicrobial effect of INH. The presented in vitro PK/PD model and associated modeling approach were able to characterize the time-kill kinetics of INH in M. bovis BCG, and may in general serve as a potentially valuable, low cost tool for the assessment of antibacterial activity in slow growing organisms in drug development and applied pharmacotherapy.
Keywords: In vitro model, time-kill analysis, isoniazid, PK/PD, tuberculosis
1. Introduction
In spite of the fact that bacteria are exposed to dynamically changing drug concentrations in vivo, antibiotics are frequently dosed based on point estimates of efficacy derived from exposure to constant concentrations. Until last decade, it was a common practice to select antimicrobial dosing regimens resulting in concentrations above the minimum inhibitory concentration (MIC) of the pathogen being treated. This approach, however, has several disadvantages as it does not accurately reflect the complex interaction among the three major players, the drug, the microorganism and the host. Constant (static) drug levels used in MIC determinations hardly reflect the actual in vivo situation where the pharmacodynamic effect is the result of dynamic exposure of the organism to the unbound drug fraction in the target tissue. Furthermore, the MIC provides only limited information on the kinetics of bactericidal activity as it is used as a threshold value for the activity of the antibiotic. In reality, however, antimicrobials usually have already some activity at concentrations below the MIC and may not have the maximum activity just above the MIC. Thus, complete time courses of the drug effect in response to concentration-time courses encountered in vivo seem to be more adequate and informative for selecting optimal dosing strategies than the use of point estimates such as MIC.1-4
In recent years, integrated pharmacokinetic/pharmacodynamic (PK/PD) approaches have been developed as a more sophisticated methodology to assess the efficacy of antimicrobials based on dynamic kill curves. These PK/PD-based approaches are being used to guide the selection of potential drug candidates and to provide a scientific rationale for selecting dosing regimens that increase the efficacy and reduce the probability for the emergence of drug resistance 5. The US Food and Drug Administration and the European Medicines Evaluation Agency have been advocating the use of various in vitro and in vivo models to characterize the PK/PD properties of antibiotics and to predict the efficacy of candidate compounds in the early stages of the drug development process.6,7
In vitro PK/PD models can be used to study the antibacterial effect of single and combination drug compounds and dosing regimens before in vivo efficacy studies.8 The advantage of these models is that the appropriate human/animal pharmacokinetic profiles can easily be simulated and the effect of these changing drug concentrations on bacterial growth (i.e. via kill curves) and emergence of drug induced tolerance and resistance can be assessed. Different species of microorganisms and clinical isolates of the same bacteria that vary in sensitivity to drug treatment can be exposed to different dosing regimens, such that the PD parameters can be identified that best explain the activity/efficacy of the drug and allow the optimization of dosage regimens for maximum efficacy. Since the influence of the immune system is absent in these in vitro models, the drug-bacterium interactions can be measured more precisely. Thus, in vitro models offer a safer and more ethical way of assessing the PK/PD relationships of antibiotics compared to animal or human studies.1,2,9,10
Several in vitro PK/PD models for antibiotics have been reported in the literature and can be broadly classified as either dilution models or diffusion models based on the mechanism by which the dynamic concentration-time profiles are simulated.8,11 However, most of the available in vitro models have been applied for fast growing bacteria and are not suitable for studies on slow growing microorganisms such as Mycobacterium tuberculosis. The previously described dilution models without a filter membrane 12-14 are not suitable for slow growing organisms since the bacteria are washed out during the dilution process and the bacterial replication rate is not sufficient to offset this loss. The reported dilution models with filter membrane have so far not been utilized for slow growing organisms in the published literature. More recently, several reports have been published using hollow fiber bioreactors (diffusion models) as in vitro models for testing antibacterial activity against M. tuberculosis.15-18 However, there are severe limitations associated with the use of hollow fiber bioreactors for in vitro culturing of bacteria. As these bioreactors are complex and difficult to sterilize between experiments, new hollow fiber cartridges are recommended for every study which makes a broad-based application of these experiments cost-prohibitive. Further, nonspecific drug binding to the hollow fiber capillaries, especially of the highly lipophilic compounds frequently tested for anti-mycobacterial activity, can produce erroneous results. In view of these limitations of the existing in vitro models, we decided to develop a novel in vitro PK/PD model for studying the pharmacologic properties of antibiotics against slow-growing microorganisms that is simple, inexpensive and easy to construct and operate. Herein, we illustrate the application of this model to determine time-kill curves of slow growing microorganisms by characterizing the effect of isoniazid (INH) dosing regimens on Mycobacterium bovis Bacillus Calmette-Guerin (BCG).
2. Materials and methods
2.1. Culture, media and antibiotics
Mycobacterium bovis BCG was grown to mid-log phase in Middlebrook 7H9 broth (Becton Dickinson, Sparks, MD) supplemented with 10% albumin dextrose complex and 0.1% v/v Tween 80. Aliquots were stored at -80°C in Middlebrook 7H9 broth. For each experiment, cultures were inoculated 1:100 from a frozen stock and incubated at 37°C in Middlebrook 7H9 broth, with shaking at 225 rpm, to an OD600nm of 0.5. The antibiotic isoniazid (INH) was obtained from Sigma-Aldrich (St. Louis, MO). A stock solution of antibiotic was prepared in DMSO and stored at -80°C. Working solutions of INH were prepared from the stock solution using sterile water.
2.2. In vitro Model Design
The in vitro model system consisted of a two-armed, water jacketed spinner culture flask (1965 series spinner flask, Bellco Glass, Vineland, NJ) as depicted in Fig.1. A 25 mm diameter filter unit (Pall Corporation, East Hills, NY) was fixed to one end of a custom made hollow steel tube. The other end of the steel tube was connected to plastic tubing (PharMed tubing, Cole-Parmer, Vernon Hills, IL). One end of the hollow tube included a screw head for easy connection with the filter unit. The other end was cone shaped to allow easy attachment of the plastic tubing. A prefilter (5μm, Millipore, Billerica, MA) and filter membrane (0.22μm, Millipore, Billerica, MA) were placed in the filter unit to prevent leakage of bacteria during the dilution process. The whole filter unit was suspended into the media from the top. The flask was placed on a magnetic stirrer; a magnetic stir bar in the flask ensured homogeneity of the culture and prevented membrane pore blockage. One of the side arms covered with silicone septa was used for repeated sampling. The other sidearm was connected to a reservoir containing antibiotic free sterile medium through a thin plastic tube (PharMed tubing, Cole-Parmer, Vernon Hills, IL). The outlet tubing from the filter unit was connected to a peristaltic pump (Masterflex L/S, Cole-Parmer, Vernon Hills, IL) to continuously withdraw the medium from the flask at a constant rate. Fresh sterile medium (Middlebrook 7H9, Becton Dickinson, Sparks, MD) was pumped from the reservoir into the flask at the same rate. The solution of the antibiotic INH was added through the sidearm. INH concentration in the flask was decreased exponentially according to the equation,
Figure 1.

Schematic diagram of in vitro PK/PD model
| Eq.1 |
where C0 is the initial concentration of INH in the flask, C is the concentration at any time t, k is the elimination rate constant and t is the time elapsed since the addition of INH. The elimination rate constant k is equal to F/V, where F is the flow rate of the medium and V is the volume of the medium in the flask. Different elimination half-lives (t1/2) of INH were simulated in the model by changing the flow rate according to the equation,
| Eq.2 |
The temperature in the flask was maintained at 37°C for bacterial growth by attaching a thermostatic water circulator to the water jacket of the flask. The apparatus was sterilized by autoclaving between experiments and was kept in a biological safety cabinet during operation (Fig.2).
Figure 2.
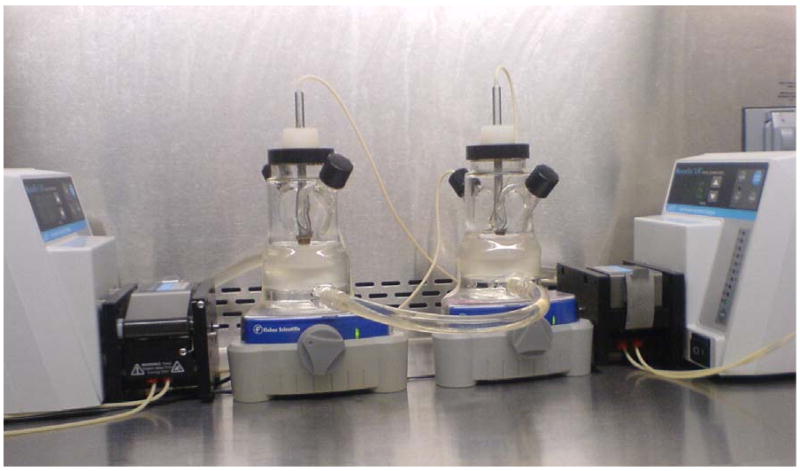
A picture showing two working units of in vitro PK/PD model
2.3. Minimum inhibitory concentration of isoniazid
The MIC of INH was determined using the microbroth dilution method and was read by visual inspection. Two fold serial dilutions of INH in 100 μL of the Middlebrook 7H9 broth medium were prepared in round-bottomed micro titer plates (Nunc, Sigma-Aldrich, St. Louis, MO). An equivalent volume (100 μL) of broth containing ∼105 CFU/mL bacteria was added to each well to give final concentrations of INH starting at 200 mg/L and the plates were incubated aerobically at 37°C for 7 days. The MIC was recorded as the lowest concentration of drug that prevented visible growth.
2.4. Time-kill curves of INH
The test organism M. bovis BCG was used to evaluate the in vitro model. M. bovis BCG was grown to mid-logarithmic growth phase 0.5 OD600nm in Middlebrook 7H9 medium. The logarithmically growing culture was then used to inoculate the in vitro model. The final density of the culture in the in vitro system was ∼106 CFU/mL. The medium was drawn from the flask via the combination of a 5 μm and a 0.22 μm filter at a predetermined flow rate that mimicked the in vivo elimination half-life of INH for slow and fast acetylators.19 Fresh sterile medium was pumped into the flask at the same rate through one side arm to keep the volume of the medium at the initial level. The accuracy of the dilution process was ensured by monitoring the volume of medium in the flask at the same (initial) level and measuring the outlet flow rate throughout the experiment. The content of the flask was stirred with a magnetic stirrer at a speed of 50-100 rpm to ensure homogeneity of the culture. The addition of INH doses (as bolus doses) was started after the culture had reached the logarithmic growth phase (0.2 to 0.3 OD600nm) which was determined by the optical density of the culture. INH doses were added daily for 7 days to simulate INH plasma concentration-time profiles in humans treated with 25, 100 and 300 mg/day (Table1). The volume of dosing solution for all dose groups was kept below 0.2 mL. Since INH is metabolized in humans by a polymorphically expressed enzyme, NAT2 (N-acetyl transferase 2), this difference in INH metabolizing activity results in a bimodal distribution of elimination half-lives with fast and slow acetylators. Thus, elimination half-lives of either 4.5 or 2.0 hr were simulated in the model to mimic slow and fast acetylators, respectively. Approximately 200 μL of the medium was collected at time zero and every 24 hours thereafter until the end of the experiment. The number of viable bacteria in each sample was determined by plating serial dilutions of the samples on antibiotic-free Middlebrook 7H11 agar plates. The plates were incubated for 3-4 weeks at 37°C. The antibacterial activity was measured as the reduction in number of viable bacteria, expressed as CFU/mL. Each experiment was performed in duplicate for each dose level and elimination half-life. Drug-free controls were included in the study for comparison to assess the extent of killing by INH. Time-kill curves were constructed based on the time course of CFU/mL measurements.
Table 1.
Experimental plan with initial concentrations of isoniazid (INH)
| Dose Group | Elimination Half-life | INH Dose/day | Number of doses | Initial Conc. (C0) |
|---|---|---|---|---|
| hr | mg | mg/L | ||
| Control | - | - | - | - |
| Slow Acetylators | 4.5 | 25 | 7 | 0.3 |
| 100 | 7 | 1.21 | ||
| 300 | 7 | 3.64 | ||
| Fast Acetylators | 2.0 | 25 | 7 | 0.3 |
| 100 | 7 | 1.21 | ||
| 300 | 7 | 3.64 |
2.5. Time-kill curve data analysis
The relationship between INH exposure and microbial kill was modeled by using a previously described time-kill curve equation,20
| Eq.3 |
where N is the M. bovis BCG cell count in CFU/mL, k0 is the bacterial net growth rate constant, Nmax is the maximum number of bacteria in the system in CFU/mL, Imax is the maximum kill rate, C is the concentration of INH at time t, and IC50 is the concentration at half-maximal kill rate. The logistic growth function, 1-N/Nmax was used to describe the limited growth of bacteria in the absence of antibacterial agents. The delay in bacterial kill rate was modeled using the term 1-e-αt, where α is the delay rate constant. According to the model, the delay rate constant α mathematically modulates Imax over time and determines the duration of time needed for Imax to reach its value. The delay in bacterial kill is likely due to the time necessary to achieve sufficient intracellular drug exposure to initiate the killing process. The IC50 was modeled as adaptive constant which changes with the exposure and the ratio of the initial cell count to the cell count at time t according to equation,
| Eq.4 |
where IC50,A is the adaptive IC50, N0 is the number of bacterial cells at time zero and IC50 is the baseline IC50. The adaptive IC50 explains the change in IC50 due to an increased drug insensitive cell population over the course of treatment, such as the frequently observed latency for Mycobacterium species.17,21-23 All time-kill data were analyzed simultaneously by nonlinear mixed effects modeling (NONMEM v.6.2, Icon, Ellicott City, MD). PK parameters were fixed in the PK/PD model and set equal to their selected values (V=55 mL, where V is volume of the medium in the system; half-life t1/2 = 4.5 and 2.0 hr for slow and fast acetylators respectively). The first-order conditional estimation method within NONMEM was used to simultaneously analyze the generated time-kill curves from all experiments. The measured data and model predictions were log transformed and the random residual variability was modeled using an additive error term. The between experiment variability in the parameter α was modeled as exponential error. Model performance was evaluated using goodness-of-fit plots, including observed vs. predicted, weighted residuals vs. time and weighted residuals vs. predictions plots.
For identification of the most appropriate empirical PK/PD index associated with the microbial kill of INH, cell counts on days 2, 3 and 4 were analyzed using an inhibitory Emax model 16 expressed as
| Eq.5 |
where, E is the observed M. bovis BCG cell counts in Log10 CFU/mL, Econtrol is the BCG cell count in the control experiment, and Emax is the maximal antimicrobial effect in Log10 CFU/mL. EC50 is the value of the PK/PD index that produces half-maximal antimicrobial effect and PKPD is one of the empirical PK/PD indices frequently used in infectious disease pharmacotherapy, AUC0-24/MIC, T>MIC or Cmax/MIC. The PK/PD index that best characterized the effect of INH on M. bovis BCG was selected based on goodness-of-fit criteria (e.g., coefficient of determination values), residual analysis and visual inspection.
3. Results
Mycobacterium bovis BCG was utilized as surrogate for virulent M. tuberculosis in the development of this method because of its high genetic similarity, similar drug sensitivity and growth rate. Practically, the use of M. bovis BCG allowed for this technology to be developed more rapidly under biosafety level 2 conditions rather than the more stringent biosafety level 3 conditions required for M. tuberculosis culture.
M. bovis BCG was successfully cultured in our novel in vitro PK/PD model for 10 days. The theoretical INH concentrations achieved in all slow and fast acetylator dose groups are shown in Fig. 3A and 3B. The growth rate constant of M. bovis BCG in the absence of any antibacterial compound was found to be 0.0464 hr-1 and the corresponding doubling time/generation time was calculated as 14.9 hours. This doubling time of M. bovis BCG is similar to the range observed in vitro in the literature (13-20 hours).24 Administration of INH dosing regimens to logarithmically growing cultures of BCG in the in vitro model resulted in reduced cell counts when compared to the control experiment (Fig.4A and Fig.4B). The initial kill rate during the first two days of therapy for simulated slow acetylators was 0.32, 1.36, and 1.35 log10 (CFU/mL)/day for the 25, 100 and 300 mg/day dosing regimens, respectively. In contrast, the initial kill rate for the simulated fast acetylators was calculated as 0.09, 0.05 and 0.78 log10 (CFU/mL)/day for the 25, 100 and 300 mg/day dosing regimens, respectively. The initial kill rate of INH, analogous to in vivo early bactericidal activity (EBA) was exposure-dependent. As INH systemic exposure in simulated slow acetylators was higher than in fast acetylators, the INH mediated kill effect was also more pronounced in slow acetylators compared to fast acetylators at each dose level (Fig.4A and Fig.4B). The bactericidal activity appeared with a delay of approximately 24 hours in the fast acetylator dose groups compared to the corresponding dose groups in slow acetylators. The INH mediated killing of bacteria ceased after three days of therapy and re-growth of bacteria appeared in both slow and fast acetylator dose groups (Fig.4A and Fig.4B).
Figure 3.

Concentration-time profiles of INH for all dose groups simulated in the in vitro PK/PD model. Panel A shows concentration-time profiles for slow acetylators of INH, panel B for fast acetylators. The horizontal line indicates the MIC (0.05 mg/L) for M. bovis BCG.
Figure 4.

Plots showing measured (mean ± SD) and model predicted (lines) M. bovis BCG CFU/mL over time for the PK/PD model. Panel A shows kill curves for slow acetylators of isoniazid, panel B for fast acetylators. Symbols for dose groups: Control experiment, ○; 25 mg/day, ■; 100 mg/day, ▲; and 300 mg/day, ●. Lines represent individual predictions based on the PK/PD Model.
Different mathematical models were evaluated for simultaneously describing the M. bovis BCG time-kill data generated with the in vitro PK/PD model for fast and slow acetylators.1,25-30 An adaptive IC50 kill curve model best described the experimental data based on goodness-of-fit criteria (see Methods section). Graphical representations showing observed and predicted BCG cell counts at all tested dosing regimens in slow and fast acetylators are displayed in Fig.4A and Fig.4B. The corresponding parameter estimates are listed in Table 2. The maximum kill rate (Imax) was calculated as 0.852 hr-1. The concentration of INH that resulted in a half-maximal kill rate, IC50, was estimated as 0.244 mg/L. The adaptive IC50, IC50,A, correspondingly ranged from 0.244 to 15.4 mg/L. For comparison, the MIC for INH determined with the classic dilution approach was found to be 0.05 mg/L. The goodness-of-fit plots presented in Fig.5 and Fig.6 indicate that the selected mathematical time-kill curve model (Eq. 3) is able to describe the data well. The plots of observed vs. predicted CFU concentrations (Fig. 5) show a uniform distribution around the line of identity indicating a high correlation between model predicated and observed data and thus a good model fit of the data. The residual plots (Fig. 6) are an indicator of potential trends in the data unaccounted by the model. The largely random distribution of residuals over time and over the range of predicted CFU concentrations indicate a lack of bias in the model prediction.
Table 2.
Parameter estimates of INH PK/PD model
| Parameter | Units | Estimate (% CV) |
|---|---|---|
| k0 | hr-1 | 0.0464 (61.6) |
| IC50 | mg/L | 0.244 (271) |
| Adaptation constant | L/mg.hr | 0.00224 (36.5) |
| Imax | hr-1 | 0.852 (87.6) |
| α | hr-1 | 0.088 (85) |
| Between experiment Variability (%CV) in α | 95.02 (64.2) | |
| Residual Variability (%CV) | 81.3 (27.1) | |
Figure 5.

Goodness-of-fit plots for the PK/PD model, A) observed vs. individual predicted values (log10 CFU/mL) and B) observed vs. population predicted values (log10 CFU/mL).
Figure 6.

Goodness-of-fit plots for the PK/PD model, A) weighted residuals vs. time (hr) and B) weighted residuals vs. population predicted values (log10 CFU/mL).
Examination of the relationship between empirical PK/PD indices and microbial kill for day 3 of the treatment revealed that the PK/PD index AUC0-24/MIC was the most explanatory of the INH mediated microbial kill (Fig.7). The relationships between microbial kill and the other PK/PD indices, Cmax/MIC and T>MIC are also shown in Fig.7. Similar results were observed for day 2 and day 4 data (results not shown). The parameter estimates from the empirical PK/PD analysis are provided in Table 3.
Figure 7.

Relationship between PK/PD indices and microbial kill on day 3 after treatment. Panels A, B and C show AUC/MIC, T>MIC and Cmax/MIC, respectively.
Table 3.
Empirical PK/PD indices
| Parameter | Units | AUC0-24/MIC | T>MIC (%) | Cmax/MIC |
|---|---|---|---|---|
| Emax | log10 CFU/mL variable | 4.69 | 6.94 | 4.90 |
| EC50 | dependent on index | 36.01 | 57.33 | 12.33 |
| R2 | 0.991 | 0.988 | 0.988 |
R2 is the coefficient of determination
4. Discussion
Identification of pharmacodynamic parameters has become an integral part of the development process of novel antibiotics.5 Characterization of pharmacodynamic parameters in the early stages of development enables the design of optimal dosage regimens for animal and human studies and allows for better predictions of the success/failure of an antibiotic development program.1,11 In vitro PK/PD models are used widely for the determination of pharmacodynamic parameters of antibiotics 25,28,29,31-34 due to a variety of advantages. One of the advantages of in vitro models is that human and animal pharmacokinetic profiles can easily be simulated. In addition, the lack of immune system response in these in vitro experiments allows for precise characterization of bacteria-drug interactions. Further, the in vitro models are better suited over animal models to test and identify the time- or concentration-dependant killing nature of antibacterial drugs.2 The in vitro PK/PD model described here is a further development of previously reported dilution models and is to our knowledge the first-time use of a dilution model to assess the time-kill curves for Mycobacterium species. The model is easily constructed, inexpensive, prevents dilution of the bacteria without membrane pore blockage and can be used for slow growing organisms as shown with the time-kill analysis using M. bovis BCG. Compared to the previously reported models of similar nature,8,10 the model described in this paper has several advantages: 1) It is a completely closed system that easily can fit in most biosafety cabinets and is safe to work with pathogenic strains under biosafety level 3 conditions, 2) the model can be used to work with slow and fast growth rate organisms, 3) the temperature in the flask can be controlled precisely with a water jacket, 4) the system is low cost, and 5) assembling and disassembling of the components of the model is simple and straight forward, allowing for easy study conduct and equipment sterilization. In addition, the model requires only a very limited amount of drug substance, which might be advantageous in early drug discovery when drug substance supply is oftentimes limited. Although the amount of drug substance required for experiments in the model system varies dependent on a drug's in vivo pharmacokinetic characteristics and the number of doses and treatment period simulated, all experiments described in this manuscript required less than 5 mg INH.
Slow growth rate microorganisms such as M. bovis BCG pose many challenges for in vitro culturing using a continuous flow apparatus. Much longer periods, usually more than a week, are required to assess the efficacy of an antibacterial agent against these slow growing organisms when compared to fast growing organisms. Consequently, the integrity of the filter membrane is crucial for allowing media exchange but preventing outflow of bacteria throughout the duration of the experiment. In addition, the in vitro PK/PD model should not hinder natural growth of bacteria in the absence of antibacterial agents. The concordance between the observed doubling time for M. bovis BCG in our studies and the literature reported values suggests that the in vitro PK/PD model described in this report is not interfering with the normal growth of M. bovis BCG.
INH is one of the first line agents used in the multi drug combination therapy for tuberculosis that kills actively dividing bacteria. Early bactericidal activity (EBA) of the combination drug therapy for tuberculosis is derived mainly from INH activity on the logarithmically growing bacteria.35,36 EBA is defined as the rate of fall of colony forming units (CFU/mL) in the sputum of patients during the first two days of drug treatment and is expressed as log10 (CFU/mL)/day. PK/PD models based on in vitro time-kill curves have been used to assess the efficacy of antimicrobial agents. However, reports about the use of such models for anti-tuberculosis drugs are scarce. Only a few recently reported in vitro models characterized dynamic time-kill curves of the anti-tuberculosis agents INH, rifampicin and moxifloxacin.15-18,37 From the results of the time-kill experiments performed in this study, it can be seen that the kill rate of M. bovis BCG is different at identical dosing regimens in the slow and fast acetylator groups of INH. An initial delay in killing was observed at all the dosing regimens studied in the fast acetylator groups in contrast to the slow acetylator dose groups (Fig.4A and Fig.4B). In an in vitro study with 14C-labeled INH, it was shown that it takes more than 2 hours for complete intracellular uptake of INH when incubated with M. bovis BCG.38 Since INH is eliminated with a half-life of 2 hours in fast acetylators the observed delay in killing could be due to the rapid removal of drug from the medium in this group compared to slow acetylators (half-life 4.5 hr). Similarly, the rapid removal of drug in the fast acetylators is likely the reason for the observed differences in the initial kill rates of bacteria among the identical dose groups in both slow and fast acetylators. Whether similar differences in bacterial kill between fast and slow acetylators of INH are also seen for other mycobacteria will likely be dependent on their MIC relative to the INH concentrations encountered in the two acetylator groups.
The exposure-dependant kill pattern for mycobacteria under INH therapy has been characterized in previously reported in vitro and in vivo animal studies.18,39 The initial rapid kill rate followed by a slow kill rate along with the re-growth of bacteria observed in our study is remarkably similar to that observed in an in vitro study by Gumbo et al., using M. tuberculosis H37Ra.17 Similar results were found in several other in vitro drug susceptibility assays. It was hypothesized that the development of drug induced tolerance and transient resistance to INH is responsible for the cessation of INH bactericidal activity.22,40
We used a semi-mechanistic PK/PD model to describe the rate of killing of bacteria over time at different dosing regimens. The principle behind the analysis is that the change in CFUs over time is governed by the difference in the rate of growth and the rate of killing with INH increasing the rate of microbial kill. The limiting growth of bacteria in the absence of INH was described by a logistic function, 1-N/Nmax where, N is the number of CFU/mL at time t and Nmax is the maximum number of bacteria (CFU/mL) in the system which corrects for the limitations of space and nutrients that are inherent to in vitro systems.20,25,30 A correction factor (1-e-αt) was incorporated to describe the delay in kill effect after the addition of INH in the fast acetylator dose groups.20 Since the numbers of INH insensitive populations of bacteria due to latency or resistance likely increased over the course of treatment, the selected PK/PD model needed to be able to describe the re-growth of bacteria. Various approaches have been reported for modeling drug resistance and/or growth of drug insensitive populations of bacteria.1,16,25-30 Here, we used an adaptive IC50 model to describe the increase in apparent IC50 due to growth of drug insensitive populations of bacteria. The increase in IC50 was inversely related to the INH exposure and the ratio of cell counts to the initial cell numbers (Eq. 4). This means that low exposure to INH results in increased development of insensitivity which is manifested as an increase in apparent IC50. This model was able to describe the observed re-growth of bacteria after several days of drug exposure. The IC50 was estimated as 0.244 mg/L and could increase over the course of treatment up to 15.4 mg/L. The stationary concentration of INH which is defined as the concentration at which the rate of bacterial killing equals growth was calculated using IC50 of INH as described by Moutin and Vinks.41 The calculated stationary concentration (0.0043 mg/L) was much lower than the MIC (0.05 mg/L), a commonly observed phenomenon for the concentration/exposure dependent killing by antibiotics.41
In the current study, INH exhibited exposure-dependent antibacterial activity on M. bovis BCG. The empirical PK/PD index AUC0-24/MIC was found to be well associated with the microbial kill. In contrast, the PK/PD index Cmax/MIC did not correlate well with antimicrobial activity (Fig.7): The same value of the Cmax/MIC index in slow and fast acetylators resulted in different microbial kill, likely due to the different exposures for slow and fast acetylators since INH was administered as the same bolus dose in both groups, but different elimination half-lives were simulated. Although the other considered PK/PD index, T>MIC showed some association with bacterial killing, it has previously been shown that microbial kill by INH is an exposure-dependent process.17,18,39 However, the parameter estimate (AUC0-24/MIC) from a previous study, 61.6 is different from that of the current study, 36.0. The difference is likely due to the difference in the test organisms' susceptibility to INH (M. tuberculosis H37Ra vs. M. bovis BCG). In order to corroborate the findings of our empirical PK/PD analysis, further studies with mycobacteria with different susceptibilities to drug treatment (a range of MICs) are required. Since only M. bovis BCG with a single susceptibility was used in this study, the results of the empirical PK/PD analysis should be interpreted cautiously.
The novel in vitro PK/PD model and associated PK/PD modeling approach described here can be used as a tool to evaluate and predict the bactericidal activities of novel anti-tuberculosis compounds. The underlying principle is to describe the whole time course of the events seen in the bacterial system when exposed to antibiotics. Such models, when combined with other information such as toxicology data, can be used to design improved dosing regimens of antibiotics beyond the empirical approaches. Simulations based on the mechanistically based time-kill models allow for evaluation and comparison of previously tested and hypothetical, untested dosing strategies.
The in vitro time-kill curve approach described for anti-mycobacterial drug activity, however, has some limitations. The current study was performed with an assumption that the plasma concentrations are similar to the effect site concentrations. However, in most of cases in vivo effect site concentrations are difficult to determine and may differ from plasma concentrations dependent on protein binding and tissue uptake. Secondly, the environment for bacterial growth in vitro differs from that in vivo. Thirdly, the drug effect was measured on logarithmically growing bacteria which only describes the EBA of a drug. Thus, the approach described here cannot predict the sterilizing activity of drugs on persister populations of mycobacteria which are thought of being frequently responsible for relapses under drug therapy. Although this can be regarded as one of the major limitations of most in vitro and in vivo models currently available for evaluating drug activity in tuberculosis, the PK/PD model described herein offers at the same time the opportunity to selectively create persister populations in a controlled environment that can then be further studied, for example with regard to metabolic activity and response to other antibacterial agents.
In conclusion, we have shown that a newly developed in vitro PK/PD model can be used to determine time-kill curves for slow growing mycobacteria as exemplified by the determination of time-kill curves for dosing regimens of INH against M. bovis BCG. We have also shown that the time-kill data of INH against M. bovis BCG can be described using an adaptive IC50 model that corrects for increased drug insensitive populations of bacteria during the course of treatment. The newly developed model can be used to determine time-kill curves of novel anti-tuberculosis compounds to aid in their development. Also, the approach can be used to evaluate the effectiveness of new dosing regimens of currently used anti-tuberculosis agents.
Acknowledgments
This study was supported by research grant R01 AI 062415 from the National Institutes of Health. Its content is solely the responsibility of the authors and does not necessarily represent the official views of the National Institutes of Health.
Footnotes
Competing Interests: None.
Publisher's Disclaimer: This is a PDF file of an unedited manuscript that has been accepted for publication. As a service to our customers we are providing this early version of the manuscript. The manuscript will undergo copyediting, typesetting, and review of the resulting proof before it is published in its final citable form. Please note that during the production process errors may be discovered which could affect the content, and all legal disclaimers that apply to the journal pertain.
References
- 1.Schuck EL, Derendorf H. Pharmacokinetic/pharmacodynamic evaluation of anti-infective agents. Expert Rev Anti Infect Ther. 2005;3:361–73. doi: 10.1586/14787210.3.3.361. [DOI] [PubMed] [Google Scholar]
- 2.Mueller M, de la Pena A, Derendorf H. Issues in pharmacokinetics and pharmacodynamics of anti-infective agents: kill curves versus MIC. Antimicrob Agents Chemother. 2004;48:369–77. doi: 10.1128/AAC.48.2.369-377.2004. [DOI] [PMC free article] [PubMed] [Google Scholar]
- 3.Katsube T, Yano Y, Yamano Y, Munekage T, Kuroda N, Takano M. Pharmacokinetic-pharmacodynamic modeling and simulation for bactericidal effect in an in vitro dynamic model. J Pharm Sci. 2008;97:4108–17. doi: 10.1002/jps.21265. [DOI] [PubMed] [Google Scholar]
- 4.Czock D, Keller F. Mechanism-based pharmacokinetic-pharmacodynamic modeling of antimicrobial drug effects. J Pharmacokinet Pharmacodyn. 2007;34:727–51. doi: 10.1007/s10928-007-9069-x. [DOI] [PubMed] [Google Scholar]
- 5.Meibohm B, Derendorf H. Pharmacokinetic/pharmacodynamic studies in drug product development. J Pharm Sci. 2002;91:18–31. doi: 10.1002/jps.1167. [DOI] [PubMed] [Google Scholar]
- 6.The U.S. Department of Health and Human Services. Food and Drug Administration. Developing Antimicribial Drugs-General Considerations for Clinical Trials. Rockville, MD: 1998. [Google Scholar]
- 7.The European Agency for the Evaluation of Medicinal Products (EMEA) - Committee for Proprietary Medicinal Products (CPMP) Points to consider on pharmacokinetics and pharmacodynamics in the development of antibacterial medicinal products. London, UK: 2000. [Google Scholar]
- 8.Lowdin E, Odenholt I, Bengtsson S, Cars O. Pharmacodynamic effects of sub-MICs of benzylpenicillin against Streptococcus pyogenes in a newly developed in vitro kinetic model. Antimicrob Agents Chemother. 1996;40:2478–82. doi: 10.1128/aac.40.11.2478. [DOI] [PMC free article] [PubMed] [Google Scholar]
- 9.Nolting A, Dalla Costa T, Rand KH, Derendorf H. Pharmacokinetic-pharmacodynamic modeling of the antibiotic effect of piperacillin in vitro. Pharm Res. 1996;13:91–6. doi: 10.1023/a:1016085402278. [DOI] [PubMed] [Google Scholar]
- 10.Dalla Costa T, Nolting A, Rand K, Derendorf H. Pharmacokinetic-pharmacodynamic modelling of the in vitro antiinfective effect of piperacillin-tazobactam combinations. Int J Clin Pharmacol Ther. 1997;35:426–33. [PubMed] [Google Scholar]
- 11.Lister PD. The role of pharmacodynamic research in the assessment and development of new antibacterial drugs. Biochem Pharmacol. 2006;71:1057–65. doi: 10.1016/j.bcp.2005.10.038. [DOI] [PubMed] [Google Scholar]
- 12.Grasso S, Meinardi G, de Carneri I, Tamassia V. New in vitro model to study the effect of antibiotic concentration and rate of elimination on antibacterial activity. Antimicrob Agents Chemother. 1978;13:570–6. doi: 10.1128/aac.13.4.570. [DOI] [PMC free article] [PubMed] [Google Scholar]
- 13.Maggiolo F, Taras A, Frontespezi S, Bottari F, Legnani MC, Suter F. Bactericidal activity of two different dosage regimens of imipenem in an in-vitro dynamic model. J Antimicrob Chemother. 1993;32:295–300. doi: 10.1093/jac/32.2.295. [DOI] [PubMed] [Google Scholar]
- 14.Murakawa T, Sakamoto H, Hirose T, Nishida M. New in vitro kinetic model for evaluating bactericidal efficacy of antibiotics. Antimicrob Agents Chemother. 1980;18:377–81. doi: 10.1128/aac.18.3.377. [DOI] [PMC free article] [PubMed] [Google Scholar]
- 15.Gumbo T, Louie A, Deziel MR, Liu W, Parsons LM, Salfinger M, Drusano GL. Concentration-dependent Mycobacterium tuberculosis killing and prevention of resistance by rifampin. Antimicrob Agents Chemother. 2007;51:3781–8. doi: 10.1128/AAC.01533-06. [DOI] [PMC free article] [PubMed] [Google Scholar]
- 16.Gumbo T, Louie A, Deziel MR, Parsons LM, Salfinger M, Drusano GL. Selection of a moxifloxacin dose that suppresses drug resistance in Mycobacterium tuberculosis, by use of an in vitro pharmacodynamic infection model and mathematical modeling. J Infect Dis. 2004;190:1642–51. doi: 10.1086/424849. [DOI] [PubMed] [Google Scholar]
- 17.Gumbo T, Louie A, Liu W, Ambrose PG, Bhavnani SM, Brown D, Drusano GL. Isoniazid's bactericidal activity ceases because of the emergence of resistance, not depletion of Mycobacterium tuberculosis in the log phase of growth. J Infect Dis. 2007;195:194–201. doi: 10.1086/510247. [DOI] [PubMed] [Google Scholar]
- 18.Gumbo T, Louie A, Liu W, Brown D, Ambrose PG, Bhavnani SM, Drusano GL. Isoniazid bactericidal activity and resistance emergence: integrating pharmacodynamics and pharmacogenomics to predict efficacy in different ethnic populations. Antimicrob Agents Chemother. 2007;51:2329–36. doi: 10.1128/AAC.00185-07. [DOI] [PMC free article] [PubMed] [Google Scholar]
- 19.Peloquin CA, Jaresko GS, Yong CL, Keung AC, Bulpitt AE, Jelliffe RW. Population pharmacokinetic modeling of isoniazid, rifampin, and pyrazinamide. Antimicrob Agents Chemother. 1997;41:2670–9. doi: 10.1128/aac.41.12.2670. [DOI] [PMC free article] [PubMed] [Google Scholar]
- 20.Li Y, Nguyen MH, Cheng S, Schmidt S, Zhong L, Derendorf H, Clancy CJ. A pharmacokinetic/pharmacodynamic mathematical model accurately describes the activity of voriconazole against Candida spp. in vitro. Int J Antimicrob Agents. 2008;31:369–74. doi: 10.1016/j.ijantimicag.2007.11.015. [DOI] [PMC free article] [PubMed] [Google Scholar]
- 21.Middlebrook G. Isoniazid-resistance and catalase activity of tubercle bacilli; a preliminary report. Am Rev Tuberc. 1954;69:471–2. doi: 10.1164/art.1954.69.3.471. [DOI] [PubMed] [Google Scholar]
- 22.Viveiros M, Portugal I, Bettencourt R, Victor TC, Jordaan AM, Leandro C, Ordway D, Amaral L. Isoniazid-induced transient high-level resistance in Mycobacterium tuberculosis. Antimicrob Agents Chemother. 2002;46:2804–10. doi: 10.1128/AAC.46.9.2804-2810.2002. [DOI] [PMC free article] [PubMed] [Google Scholar]
- 23.Colangeli R, Helb D, Sridharan S, Sun J, Varma-Basil M, Hazbon MH, et al. The Mycobacterium tuberculosis iniA gene is essential for activity of an efflux pump that confers drug tolerance to both isoniazid and ethambutol. Mol Microbiol. 2005;55:1829–40. doi: 10.1111/j.1365-2958.2005.04510.x. [DOI] [PubMed] [Google Scholar]
- 24.Wayne LG. Mycobacterial speciation. In: Kubica GP, Wayne LG, editors. The Mycobacteria: A Sourcebook. New York: Marcel Dekker; 1984. pp. 25–66. [Google Scholar]
- 25.Yano Y, Oguma T, Nagata H, Sasaki S. Application of logistic growth model to pharmacodynamic analysis of in vitro bactericidal kinetics. J Pharm Sci. 1998;87:1177–83. doi: 10.1021/js9801337. [DOI] [PubMed] [Google Scholar]
- 26.Nielsen EI, Viberg A, Lowdin E, Cars O, Karlsson MO, Sandstrom M. Semimechanistic pharmacokinetic/pharmacodynamic model for assessment of activity of antibacterial agents from time-kill curve experiments. Antimicrob Agents Chemother. 2007;51:128–36. doi: 10.1128/AAC.00604-06. [DOI] [PMC free article] [PubMed] [Google Scholar]
- 27.Carret G, Flandrois JP, Lobry JR. Biphasic kinetics of bacterial killing by quinolones. J Antimicrob Chemother. 1991;27:319–27. doi: 10.1093/jac/27.3.319. [DOI] [PubMed] [Google Scholar]
- 28.Meagher AK, Forrest A, Dalhoff A, Stass H, Schentag JJ. Novel pharmacokinetic-pharmacodynamic model for prediction of outcomes with an extended-release formulation of ciprofloxacin. Antimicrob Agents Chemother. 2004;48:2061–8. doi: 10.1128/AAC.48.6.2061-2068.2004. [DOI] [PMC free article] [PubMed] [Google Scholar]
- 29.Mouton JW, Vinks AA, Punt NC. Pharmacokinetic-pharmacodynamic modeling of activity of ceftazidime during continuous and intermittent infusion. Antimicrob Agents Chemother. 1997;41:733–8. doi: 10.1128/aac.41.4.733. [DOI] [PMC free article] [PubMed] [Google Scholar]
- 30.Tam VH, Schilling AN, Poole K, Nikolaou M. Mathematical modelling response of Pseudomonas aeruginosa to meropenem. J Antimicrob Chemother. 2007;60:1302–9. doi: 10.1093/jac/dkm370. [DOI] [PubMed] [Google Scholar]
- 31.Liu P, Rand KH, Obermann B, Derendorf H. Pharmacokinetic-pharmacodynamic modelling of antibacterial activity of cefpodoxime and cefixime in in vitro kinetic models. Int J Antimicrob Agents. 2005;25:120–9. doi: 10.1016/j.ijantimicag.2004.09.012. [DOI] [PubMed] [Google Scholar]
- 32.Regoes RR, Wiuff C, Zappala RM, Garner KN, Baquero F, Levin BR. Pharmacodynamic functions: a multiparameter approach to the design of antibiotic treatment regimens. Antimicrob Agents Chemother. 2004;48:3670–6. doi: 10.1128/AAC.48.10.3670-3676.2004. [DOI] [PMC free article] [PubMed] [Google Scholar]
- 33.Tam VH, Schilling AN, Nikolaou M. Modelling time-kill studies to discern the pharmacodynamics of meropenem. J Antimicrob Chemother. 2005;55:699–706. doi: 10.1093/jac/dki086. [DOI] [PubMed] [Google Scholar]
- 34.Zhi J, Nightingale CH, Quintiliani R. A pharmacodynamic model for the activity of antibiotics against microorganisms under nonsaturable conditions. J Pharm Sci. 1986;75:1063–7. doi: 10.1002/jps.2600751108. [DOI] [PubMed] [Google Scholar]
- 35.Jindani A, Aber VR, Edwards EA, Mitchison DA. The early bactericidal activity of drugs in patients with pulmonary tuberculosis. Am Rev Respir Dis. 1980;121:939–49. doi: 10.1164/arrd.1980.121.6.939. [DOI] [PubMed] [Google Scholar]
- 36.Jindani A, Dore CJ, Mitchison DA. Bactericidal and sterilizing activities of antituberculosis drugs during the first 14 days. Am J Respir Crit Care Med. 2003;167:1348–54. doi: 10.1164/rccm.200210-1125OC. [DOI] [PubMed] [Google Scholar]
- 37.Gumbo T, Siyambalapitiyage Dona CS, Meek C, Leff R. Pharmacokinetics-Pharmacodynamics of Pyrazinamide In A Novel In Vitro Model of Tuberculosis for Sterilizing Effect: A Paradigm for Faster Assessment of New Antituberculosis Drugs. Antimicrob Agents Chemother. 2009 doi: 10.1128/AAC.01681-08. [DOI] [PMC free article] [PubMed] [Google Scholar]
- 38.McClatchy JK. Mechanism of Action of Isoniazid on Mycobacterium bovis Strain BCG. Infect Immun. 1971;3:530–534. doi: 10.1128/iai.3.4.530-534.1971. [DOI] [PMC free article] [PubMed] [Google Scholar]
- 39.Jayaram R, Shandil RK, Gaonkar S, Kaur P, Suresh BL, Mahesh BN, et al. Isoniazid pharmacokinetics-pharmacodynamics in an aerosol infection model of tuberculosis. Antimicrob Agents Chemother. 2004;48:2951–7. doi: 10.1128/AAC.48.8.2951-2957.2004. [DOI] [PMC free article] [PubMed] [Google Scholar]
- 40.Wallis RS, Patil S, Cheon SH, Edmonds K, Phillips M, Perkins MD, et al. Drug tolerance in Mycobacterium tuberculosis. Antimicrob Agents Chemother. 1999;43:2600–6. doi: 10.1128/aac.43.11.2600. [DOI] [PMC free article] [PubMed] [Google Scholar]
- 41.Mouton JW, Vinks AA. Pharmacokinetic/pharmacodynamic modelling of antibacterials in vitro and in vivo using bacterial growth and kill kinetics: the minimum inhibitory concentration versus stationary concentration. Clin Pharmacokinet. 2005;44:201–10. doi: 10.2165/00003088-200544020-00005. [DOI] [PubMed] [Google Scholar]