Abstract
Mycophenolic acid (MPA), the active compound of mycophenolate mofetil (MMF), is used to prevent graft rejection in renal transplant recipients. MPA is glucuronidated to the metabolite MPAG, which exhibits enterohepatic recirculation (EHC). MPA binds for 97% and MPAG binds for 82% to plasma proteins. Low plasma albumin concentrations, impaired renal function and coadministration of cyclosporine have been reported to be associated with increased clearance of MPA. The aim of the study was to develop a population pharmacokinetic model describing the relationship between MMF dose and total MPA (tMPA), unbound MPA (fMPA), total MPAG (tMPAG) and unbound MPAG (fMPAG). In this model the correlation between pharmacokinetic parameters and renal function, plasma albumin concentrations and cotreatment with cyclosporine was quantified. tMPA, fMPA, tMPAG and fMPAG concentration–time profiles of renal transplant recipients cotreated with cyclosporine (n = 48) and tacrolimus (n = 45) were analyzed using NONMEM. A 2- and 1-compartment model were used to describe the pharmacokinetics of fMPA and fMPAG. The central compartments of fMPA and fMPAG were connected with an albumin compartment allowing competitive binding (bMPA and bMPAG). tMPA and tMPAG were modeled as the sum of the bound and unbound concentrations. EHC was modeled by transport of fMPAG to a separate gallbladder compartment. This transport was decreased in case of cyclosporine cotreatment (P < 0.001). In the model, clearance of fMPAG decreased when creatinine clearance (CrCL) was reduced (P < 0.001), and albumin concentration was correlated with the maximum number of binding sites available for MPA and MPAG (P < 0.001). In patients with impaired renal function cotreated with cyclosporine the model adequately described that increasing fMPAG concentrations decreased tMPA AUC due to displacement of MPA from its binding sites. The accumulated MPAG could also be reconverted to MPA by the EHC, which caused increased tMPA AUC in patients cotreated with tacrolimus. Changes in CrCL had hardly any effect on fMPA exposure. A decrease in plasma albumin concentration from 0.6 to 0.4 mmol/l resulted in ca. 38% reduction of tMPA AUC, whereas no reduction in fMPA AUC was seen. In conclusion, a pharmacokinetic model has been developed which describes the relationship between dose and both total and free MPA exposure. The model adequately describes the influence of renal function, plasma albumin and cyclosporine co-medication on MPA exposure. Changes in protein binding due to altered renal function or plasma albumin concentrations influence tMPA exposure, whereas fMPA exposure is hardly affected.
Keywords: Mycophenolic acid, Population pharmacokinetics, Protein binding, Renal transplant recipients, Mechanism-based pharmacokinetic model
Introduction
Mycophenolate mofetil (MMF) is currently the most prescribed immunosuppressive agent in renal transplant recipients to prevent graft rejection [1]. After oral administration the prodrug MMF is rapidly hydrolyzed to the active agent mycophenolic acid (MPA). The majority of MPA is metabolized to the inactive 7-O-mycophenolic acid glucuronide (MPAG), which exhibits enterohepatic recirculation (EHC). MPA is a selective, reversible inhibitor of inosine monophosphate dehydrogenase (IMPDH). IMPDH has an important role in the de novo purine synthesis in T and B lymphocytes [2]. Inhibition of this pathway causes immunosuppression, contributing to the prevention of graft rejection. Although introduced as a fixed-dose drug, debate has emerged with respect to the potential contribution of therapeutic drug monitoring (TDM) of MPA area under the total plasma concentration time curve (AUC0–12) [3–6]. The target range for total MPA (tMPA) AUC0–12 in renal transplant recipients cotreated with cyclosporine is 30–60 mg h/l [7].
MPA is a highly protein bound drug, with a bound fraction of approximately 97%, which binds reversibly to serum albumin [8, 9]. The free fraction is thought to be responsible for the immunosuppressive effect of MPA [8, 9]. The main metabolite MPAG is approximately 82% protein bound [9]. Low plasma albumin concentrations and impaired renal function are associated with an increased clearance of tMPA and with a decreased AUC0–12 of tMPA [10]. The effect of impaired renal function on unbound MPA (fMPA) plasma concentrations is however not clear: some studies have reported an increase in fMPA AUC0–12 [11–15], whereas in other studies unbound exposure was unchanged [16, 17].
Coadministration of the calcineurin inhibitor cyclosporine influences MPA pharmacokinetics. In renal transplant recipients, significantly increased tMPA clearance and decreased tMPA AUC0–12 occurs with cyclosporine coadministration compared with tacrolimus coadministration [18, 19]. This effect can be explained by reduced EHC of MPAG in case of cyclosporine cotreatment due to inhibition of the multi-drug resistance-associated protein 2 (MRP2) enzyme [20].
Decreased tMPA exposure correlates with a higher risk for acute rejection [21–23], whereas an increase in unbound MPA exposure may produce hematological toxicity and infections [23, 24]. On the basis of these data it is unclear whether a decreased total MPA AUC0–12, caused by impaired renal function or low albumin concentrations, should be corrected with an increase in MMF dose, as the patient subsequently may be at risk for adverse events.
The aim of this study was to develop a population pharmacokinetic model, which describes the relationship between MMF dose and both total and unbound plasma concentrations of MPA and MPAG. Using this model, it will be investigated how renal function, plasma albumin and cotreatment with cyclosporine influence the pharmacokinetics of tMPA and fMPA. The developed model may provide insight in the necessity to adjust the MMF dose in situations of impaired renal function and low albumin concentrations.
Methods
Patients
Pharmacokinetic data from two previously performed studies were used for the current analysis. In the first trial, a randomized concentration controlled trial (RCCT) [25], de novo renal transplant recipients were divided into three MPA AUC target groups. All patients in this study were cotreated with cyclosporine and corticosteroids as concomitant immunosuppressive therapy. In this study, tMPA, fMPA and total MPAG (tMPAG) concentrations were measured at day 3, 7, 11, 21, 28, 56, 84, 112 and 140 after transplantation. On days 3, 7 and 11 posttransplantation, sample times were predose and 0.33, 0.66, 1.25, 2, 6, 8 and 12 h after oral intake of MMF. On the remaining occasions, sample times were predose and 0.33, 0.66, 1.25 and 2 h postdose. Concentrations were measured using a validated high-performance liquid chromatography (HPLC) method [26]. MMF dose was adjusted based on these measurements. From a subset of 88 patients fMPA concentrations were measured on one or two of the nine occasions, which were nominally day 11 and/or day 140. These fMPA concentrations were analyzed using a validated ultrafiltration procedure [27].
In the second trial, the IMPDH-activity study [28], de novo renal transplant recipients started with 1000 mg MMF twice daily, combined with tacrolimus and corticosteroids. MMF dose was adjusted based on clinical evaluations. In the IMPDH-activity study tMPA, fMPA, tMPAG and unbound MPAG (fMPAG) concentrations were measured at day 6, 21, 49 and 140 after transplantation. On day 6, samples were taken predose and 0.5, 1, 2, 6 and 12 h postdose. On the remaining occasions, sample times were predose and 0.5 and 2 h after oral intake of MMF. Concentrations were measured using a validated liquid chromatography-tandem mass spectrometry (LC-MS/MS) method [29]. For the determination of unbound plasma concentrations of MPA and MPAG, plasma was ultrafiltrated first. A detailed description of these studies was published previously [25, 28].
Pharmacokinetic analysis
Basic model
The MMF dose and analysed MPA and MPAG concentrations were converted to molar equivalents by dividing them by their molecular weight (MMF 433.5 g/mol; MPA 320.3 g/mol; MPAG 496.5 g/mol). The data of both studies were simultaneously fitted using the nonlinear mixed-effect modeling software program NONMEM (version VI, level 2.0; Globomax LLC, Ellicott City, MD, USA). The first-order (FO) method was used throughout to fit the logarithmically transformed concentration–time data, because of the high computational intensity of the first order conditional estimate method.
The minimum value of objective function (OFV) was used as a criterion for model selection. If the difference between two nested models was larger than the critical value from a Χ2 distribution with degrees of freedom equal to the difference in the number of estimated parameters, the models were significantly different from each other. A decrease in OFV > 10.83 showed a significant improvement of a nested model with one degree of freedom of P < 0.001. Model adequacy was further evaluated by using various residual plots (“goodness-of-fit” plots) and values of random effects variances. To assess the graphical goodness of fit, extensive plotting was available via Xpose [30], a purpose built set of subroutines in S-plus (version 6.1; Insightful Corp, Seattle, WA, USA).
A compartmental pharmacokinetic model was developed for fMPA and fMPAG. Several structural models were tested. Models with 1 or 2 compartments were evaluated, as well as models with and without absorption lag-time (TLAG). Furthermore, it was evaluated whether absorption was best described as a zero-order or first-order process. Pharmacokinetic parameters were estimated in terms of central and peripheral volume of distribution (V), clearance (CL), and intercompartmental clearance (Q). Because bioavailability (F) could not be quantified, V, CL and Q values correspond to the ratios V/F, CL/F, and Q/F. Addition of interpatient variability (IPV), described using an exponential error model, was evaluated for each pharmacokinetic parameter. The covariance between values for IPV was estimated using a variance–covariance matrix. Residual variability between observed and predicted MPA plasma concentrations was described using an additional error model for logarithmically transformed data.
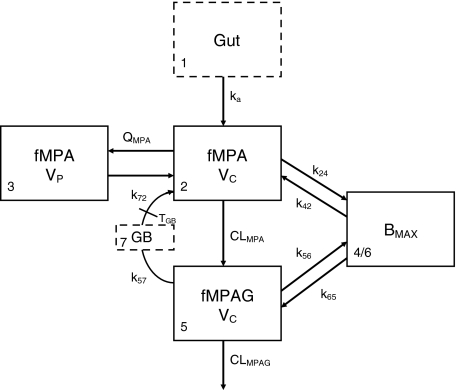
Protein bound MPA (bMPA) and bound MPAG (bMPAG) were described by addition of a protein binding compartment, containing a maximum number of binding sites (Bmax) at which MPA and MPAG could bind (Fig. 1). In this model MPA and MPAG were allowed to bind competitively with the protein binding sites, and replace each other from these binding sites as described by
 |
1 |
 |
2 |
 |
3 |
 |
4 |
 |
5 |
 |
6 |
 |
7 |
where An represents the amount of a substance in the nth compartment and knm represents the rate constant for transport between compartment n and compartment m. Values for the dissociation constant (KD) can be calculated from this differential equations by dividing k42 by k24 for MPA and k65 by k56 for MPAG. The concentrations of tMPA and tMPAG were modeled as the sum of the unbound and bound concentrations.
Fig. 1.
Graphical representation of the final model. MPA and MPAG bind competitively to the protein binding sites. fMPA is cleared to fMPAG by first order elimination. fMPAG is eliminated by a first order process (CLMPAG), or undergoes enterohepatic recirculation via the gall bladder compartment
Furthermore, to describe the EHC of the drug a gallbladder compartment was added, which is responsible for the reconversion of fMPAG into fMPA (Fig. 1). It was evaluated whether transport of fMPAG to the gallbladder was best described as a zero-order or first-order process. The gallbladder emptied into the central compartment of fMPA at a certain time point postdose [31].
Covariate model
Finally, to explain IPV, relationships were investigated between pharmacokinetic parameters and patient characteristics known to influence MPA pharmacokinetics. Covariates assessed were renal function, plasma albumin concentration, and cyclosporine comedication. Renal function was tested by calculation of the creatinine clearance (CrCL) according to Cockcroft and Gault [32]. Continuous covariates, such as albumin concentration (Alb) were modeled by using an exponential model, as shown in Eq. 8.
 |
8 |
where θ i represents the parameter for ith individual, θ pop is the population value with Alb = 0.5 mmol/l, and θ alb is an exponent determining the shape of the correlation. Categorical variables, such as cyclosporine comedication, were modeled proportionally as shown in Eq. 9.
 |
9 |
where CsA = 1 for patients cotreated with cyclosporine and CsA = 0 for patients not cotreated with cyclosporine, and θ CsA represents the fractional change of the parameter in patients cotreated with cyclosporine.
Model validation
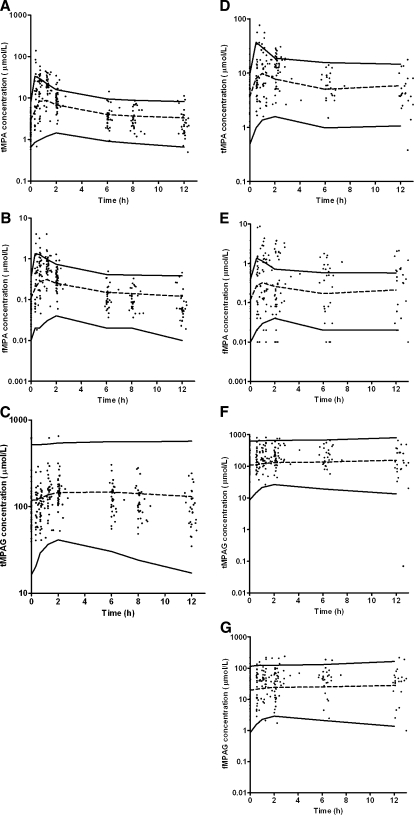
The final model was validated by a visual predictive check [33]. Data sets (n = 50) were simulated from the original data set using the final model. Per time point, the dose-corrected median simulated concentrations plus 95-percentile intervals were compared graphically with the observed concentrations for fMPA, tMPA, fMPAG, and tMPAG separately. The dataset was analyzed separately for different categories of the covariates included in the final model.
Simulation study
The final model was used to examine the impact of changes in covariates on the pharmacokinetics of MPA and MPAG. Simulations were performed to demonstrate how the disposition of MPA and MPAG was affected by clinically relevant changes in renal function, plasma albumin concentration and cyclosporine comedication. Simulations were performed with the final model for 50 patients treated with 1 g MMF twice daily and cyclosporine, and for 50 patients treated with 1 g MMF twice daily and tacrolimus. CrCL was initially set on 50 ml/min, and was decreased to 30 and 10 ml/min. The initial value for albumin concentration was 0.5 mmol/l, which was varied to 0.4 and 0.6 mmol/l. Changes in concentration–time profiles, free fraction and AUC0–12 values of fMPA, tMPA, fMPAG and tMPAG were assessed.
Results
Patients
The data set contained 489 tMPA, 489 fMPA, 488 tMPAG, and 210 fMPAG plasma concentrations obtained from 75 patients cotreated with cyclosporine or tacrolimus. Each patient participated in one or two pharmacokinetic assessments at different time points after transplantation. In total, 93 concentration–time profiles were used for the analysis. Patient characteristics are described in Table 1.
Table 1.
Patient characteristics
| Cotreatment | Cyclosporine (n = 48 profiles) | Tacrolimus (n = 45 profiles) |
|---|---|---|
| Gender (male/female)a | 30/17 | 18/10 |
| Age (years)a | 51 (21–70) | 53 (19–76) |
| Weight (kg)a | 67 (42–99) | 78 (44–113) |
| Number of patients with DGFa | 4 | 11 |
| Number of diabetic patients pretransplantationa | 2 | 2 |
| Time after transplantation (days) | 11 (7–155) | 11 (4–115) |
| Plasma albumin (mmol/l) | 0.51 (0.38–0.61) | 0.51 (0.35–0.68) |
| Creatinine clearance (ml/min)b | 44 (8–107) | 45 (8–154) |
| Heamoglobine (mmol Fe/l) | 9.6 (6.9–13.0) | 8.0 (4.2–13.0) |
| ASAT (U/l) | 15 (6–50) | 19 (6–236) |
| ALAT (U/l) | 20 (7–155) | 27 (7–534) |
| MMF dose (mg bid) | 1350 (400–2200) | 1000 (500–1500) |
| CNI daily dose (mg) | 512.5 (250–1125) | 8 (1–20) |
| CNI predose concentration (μg/l) | 267.5 (21.0–619.1) | 10.0 (1.5–30.0) |
Parameters are presented as median (range) of all profiles, for patients treated with the calcineurin inhibitors (CNI) cyclosporine and tacrolimus. DGF delayed graft function, ASAT aspartate aminotransferase, ALAT alanine transaminase, MMF mycophenolate mofetil
aParameters for all patients, of which some participated in two pharmacokinetic assessments
bCalculated with Cockcroft & Gault-formula
Pharmacokinetic analysis
Compartmental model with protein binding
The final model is shown in Fig. 1, corresponding typical population pharmacokinetic estimates are summarized in Table 2. The standard errors of the estimated parameters could not be obtained due to rounding errors of the final run. The pharmacokinetics of fMPA were described with a two-compartment model, containing a central- and peripheral volume of distribution. fMPA from the central compartment bound to the protein binding sites. The number of binding sites (BMAX) was limited, which resulted in a saturable binding process. The pharmacokinetics of fMPAG were modeled with one, central compartment. From this compartment, fMPAG bound to the same binding sites as fMPA, which resulted in competitive binding. Due to this competition MPA and MPAG were able to displace each other from the protein binding sites. Inclusion of the competitive binding between MPA and MPAG significantly improved the model compared to the model without competition (ΔOFV = −37). The protein binding and unbinding rate constants of fMPA (k24 and k42) and fMPAG (k56 and k65) provide information on the affinity of both substances to the protein binding sites, which is higher for fMPA (KD = 1100 μmol) than for fMPAG (KD = 7000 μmol). The interpatient variability (IPV) in protein binding was described for BMAX using an exponential error model.
Table 2.
Parameter estimates of the pharmacokinetic model
| Parameter | Value | IPV (%) |
|---|---|---|
| TLAG (h) | 0.231 | 161 |
| ka (h−1) | 4.00a | |
| Vc fMPA (l) | 189 | 116 |
| CL fMPA (l/h) | 747 | 97 |
| Vp fMPA (l) | 34300 | |
| Q fMPA (l/h) | 2010 | |
| k24 (h−1 μmol−1) | 0.153 | |
| BMAX (μmol) | 35100 | 48 |
| k42 (h−1) | 169 | |
| Vc fMPAG (l) | 8.56 | |
| k56 (h−1 μmol−1) | 0.0133 | |
| k65 (h−1) | 93.1 | |
| CL fMPAG (l/h) | 4.75 | 106 |
| TGB (h) | 7.90 | 141a |
| DGB (h) | 1.00a | |
| k72 (h−1) | 10.0a | |
| k57 (h−1) | 0.0796 | 71a |
| Residual variability | ||
| Additive error tMPA (mmol/l) | 0.52 | |
| Additive error fMPA (mmol/l) | 0.993 | |
| Additive error tMPAG (mmol/l) | 0.186 | |
| Additive error fMPAG (mmol/l) | 0.551 | |
| Covariate effects | ||
| CrCL on CL fMPAG | 1.36 | |
| Albumine on BMAX | 1.39 | |
| CsA on k57 | 0.002 | |
aThe parameter is fixed at this value
Enterohepatic recirculation
The EHC was modeled by using a gallbladder compartment (Fig. 1, compartment 7). Transport of fMPAG from the central compartment to the gallbladder compartment was characterized using the first order rate constant k57. Emptying of the gallbladder into the central compartment of fMPA occurred at a certain time point (TGB) with rate constant k72 and duration DGB. Unfortunately, insufficient data were collected between 4 and 10 h postdose, the period at which the gallbladder is expected to empty. As a result, the parameters describing the gallbladder emptying, DGB and k72, were fixed at 1 h and 10 h−1. IPV was described with an additional error model for TGB and with an exponential error model for k57. However, the IPV of k57 had to be fixed at 71%, to prevent variability on EHC to take on extreme values. This value was based on the variance in EHC from 10 to 60% as described in literature [9]. In comparison with a model without EHC (k57 = 0 h−1), addition of the EHC significantly improved the model (ΔOFV = −43).
Covariate analysis
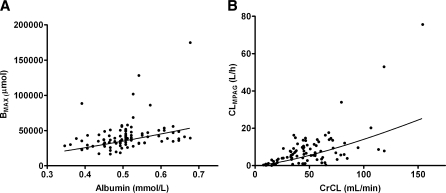
Decreased plasma albumin concentrations are known to be associated with reduced protein binding of MPA [34]. Inclusion of plasma albumin concentration as covariate of BMAX (Eq. 3) significantly improved the model (ΔOFV = −26). The IPV of fMPA CL, fMPAG CL and BMAX decreased slightly with 1, 6 and 1%, respectively. A decrease in albumin from 0.6 to 0.4 mmol/l resulted in a decrease in the number of binding sites from 45200 to 25700 μmol, as is graphically shown in Fig. 2a.
Fig. 2.
Correlation of pharmacokinetic parameters versus covariate effects for a the number of protein binding sites (BMAX) and plasma albumin concentration, and b fMPAG clearance and creatinine clearance (CrCL). The line represents the estimated correlation between the pharmacokinetic parameter and the covariate
Impaired renal function reduced renal clearance of MPAG [35]. In the present study, a significant correlation was observed between CrCL and fMPAG CL. Introduction of CrCL improved the goodness of the fit (ΔOFV = −48). The IPV of fMPA CL, fMPAG CL and BMAX decreased with 25, 57 and 17%, respectively. A decrease in CrCL from 45 to 25 ml/min resulted in a decrease from 4.75 to 2.14 l/h in clearance of fMPAG (Fig. 2b). No correlation was seen between CrCL and fMPA CL.
Cyclosporine decreases the EHC of MPAG by inhibition of MRP2 [20]. In the present study, implementation of cyclosporine as covariate on k57 significantly improved the model (ΔOFV = −17). In patients cotreated with cyclosporine k56 is very small with a value of 0.000159 h−1 compared to 0.0796 h−1 in patients cotreated with tacrolimus. Inclusion of cyclosporine as a covariate on fMPA clearance did not significantly improve the model further.
Evaluation of the final model
The goodness-of-fit plots (Fig. 3) of the final model were evaluated for tMPA, fMPA, tMPAG and fMPAG separately. The scatter plots of predicted and individually predicted versus observed concentrations showed no structural bias, except for a small underprediction of the maximum concentration of tMPA and fMPA. The weighted residuals exhibited a homogeneous distribution over the whole sampling period (data not shown).
Fig. 3.
Goodness-of-fit plots of observed versus population predicted concentrations of a tMPA, b fMPA, c tMPAG and d fMPAG, and observed versus individually predicted concentrations of e tMPA, f fMPA, g tMPAG and h fMPAG. In the plots the line of identity is presented
Figure 4 shows the results of the visual predictive check for the final model. The results are presented separately for patients cotreated with cyclosporine and tacrolimus. Good agreement between the simulated and observed concentrations was apparent at all sampling time points. However, there seemed to be a small underprediction of the maximum tMPA and fMPA concentration. The visual predictive check was performed separately for patients with CrCL < 30 ml/min, CrCL 30–50 ml/min and CrCL > 50 ml/min as well as for patients with albumin concentrations <0.5 and >0.5 mmol/l. The results of these visual predictive checks on these selections gave similar results (data not shown).
Fig. 4.
Visual predictive check of the comparison of median (dashed line) with 95-percentile interval (solid lines) of 50 simulated data sets and the observed concentrations (dots). Concentrations are corrected to an MMF dose of 1 g. Concentrations of a tMPA, b fMPA and c tMPAG for patients cotreated with CsA, and d tMPA, e fMPA, f tMPAG and g fMPAG for patients cotreated with tacrolimus
Simulations
The pharmacokinetic profiles of tMPA, fMPA, tMPAG and fMPAG were simulated for 50 renal transplant recipients receiving 1 g MMF twice daily using the final model. Covariate effects were set at typical values: plasma albumin concentration 0.5 mmol/l, CrCL 50 ml/min and comedication was cyclosporine or tacrolimus. Subsequently, the effect of a change in plasma albumin concentration or CrCL was evaluated.
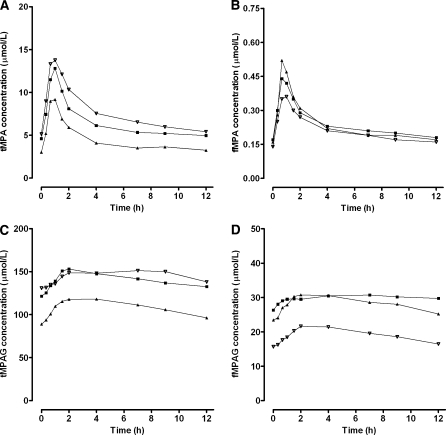
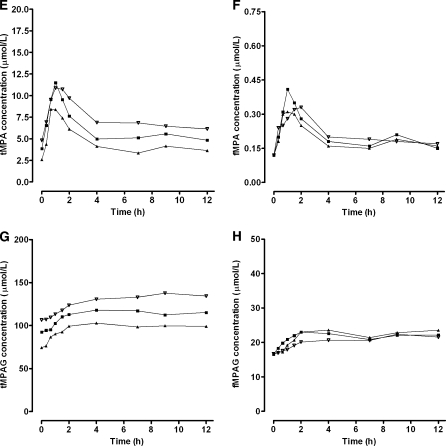
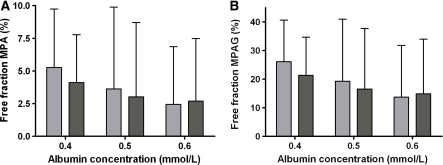
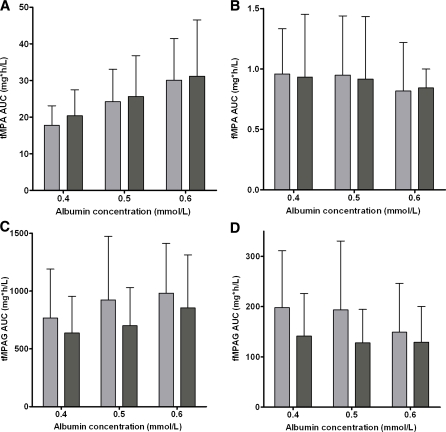
A decrease in plasma albumin concentrations from 0.6 to 0.4 mmol/l, resulted in decreased tMPA concentrations, whereas the effect on fMPA, tMPAG and fMPAG concentrations was small (Fig. 5). The free fraction of both, MPA and MPAG, almost doubled when albumin concentrations decreased from 0.6 to 0.4 mmol/l (Fig. 6). This effect was larger for patients cotreated with cyclosporine (MPA: 2.4–5.3%, MPAG: 13.7–26.1%) than for patients cotreated with tacrolimus (MPA: 2.7–4.1%, MPAG: 14.9–21.3%). Furthermore, tMPA AUC0–12 values were decreased in patients with low albumin concentrations (Fig. 7). A decrease in albumin concentrations from 0.6 to 0.4 mmol/l, resulted in a decrease in mean tMPA AUC from 30.1 to 17.7 mg h/l in patients cotreated with cyclosporine and from 31.1 to 20.4 mg h/l in patients cotreated with tacrolimus. Consequently, a decrease in albumin concentrations may cause a major underexposure to tMPA, as the lower limit of the therapeutic window of tMPA AUC is 30 mg h/l. The exposure to fMPA, tMPAG and fMPAG remained however stable, as indicated by Fig. 7b–d.
Fig. 5.
Influence of albumin concentrations on pharmacokinetic profiles. Median concentration–time profiles of a tMPA, b fMPA, c tMPAG and d fMPAG in patients cotreated with CsA and concentration–time profiles of e tMPA, f fMPA, g tMPAG and h fMPAG in patients cotreated with tacrolimus. Concentration–time profiles were simulated for 50 patients with albumin concentrations of (filled triangle) 0.4 mmol/l, (filled square) 0.5 mmol/l and (inverted triangle) 0.6 mmol/l
Fig. 6.
Influence of albumin concentrations on the free fraction of a MPA and b MPAG. Free fractions are presented as median and 95-percentile interval of 50 simulated patients cotreated with CsA (light) or tacrolimus (dark)
Fig. 7.
Influence of albumin concentrations on exposure of a tMPA, b fMPA, c tMPAG and d fMPAG for patients cotreated with CsA (light) or tacrolimus (dark). AUCs are presented as mean and 95% confidence interval of 50 simulated patients
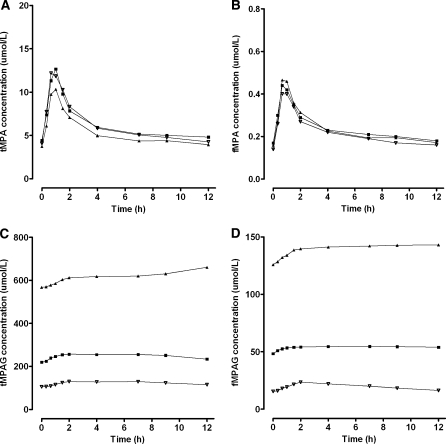
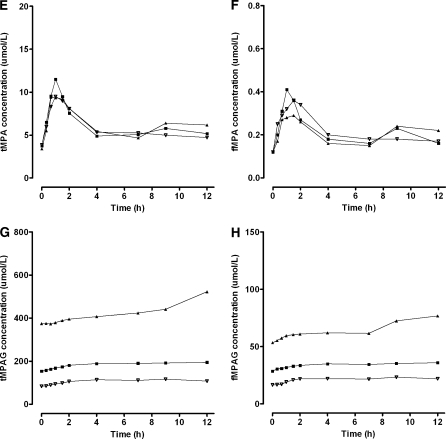
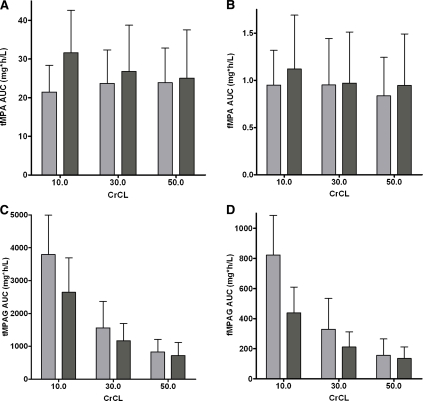
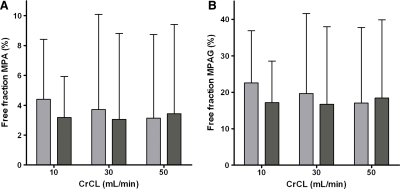
A decrease in renal function, characterized by a change in CrCL from 50 to 10 ml/min, had a large impact on the MPAG concentrations (Fig. 8). Both, tMPAG and fMPAG concentrations increased, especially in patients cotreated with cyclosporine. The changes in the concentration–time profiles of tMPA and fMPA were small. A slight difference was seen at the end of the curve, where the tacrolimus cotreated patients showed a higher EHC with impaired renal function (Fig. 8e–f). This was caused by increased concentrations of fMPAG. The latter undergoes EHC and is subsequently converted to MPA. tMPAG and fMPAG AUC values were higher in patients with impaired renal function (Fig. 9). Corresponding AUC values for tMPAG increased from 831 to 3794 mg h/l for patients cotreated with cyclosporine and from 723 to 2647 mg h/l in patients with tacrolimus as comedication. A decrease in CrCL from 50 to 10 ml/min resulted in increased tMPA AUC in patients treated with tacrolimus (25.1–31.6 mg h/l). The opposite effect was seen in patients treated with cyclosporine, in which tMPA AUC values decreased from 23.9 to 21.5 mg h/l. Furthermore, fMPA AUC values remained stable when renal function decreased, except for a small increase in fMPA AUC in patients with CrCL of 10 ml/min and tacrolimus as comedication. The free fraction of both MPA and MPAG increased in patients treated with cyclosporine (Fig. 10). In tacrolimus treated patients no difference in free fraction was seen.
Fig. 8.
Influence of creatinine clearance on pharmacokinetic profiles. Median concentration–time profiles of a tMPA, b fMPA, c tMPAG, and d fMPAG in patients cotreated with CsA and concentration–time profiles of e tMPA, f fMPA, g tMPAG, and h fMPAG in patients cotreated with tacrolimus. Concentration–time profiles were simulated for 50 patients with CrCL of (filled triangle) 10 ml/min, (filled square) 30 ml/min and (inverted triangle) 50 ml/min
Fig. 9.
Influence of creatinine clearance on exposure of a tMPA, b fMPA, c tMPAG and d fMPAG for patients cotreated with CsA (light) or tacrolimus (dark). AUCs are presented as mean and 95% confidence interval of 50 simulated patients
Fig. 10.
Influence of CrCL on the free fraction of a MPA and b MPAG. Free fractions are presented as median and 95-percentile interval of 50 simulated patients cotreated with CsA (light) or tacrolimus (dark)
Discussion
A population pharmacokinetic model has been developed describing the protein binding of MPA and the main metabolite MPAG for renal transplant recipients receiving MMF and cyclosporine or tacrolimus (Fig. 1). The model provided a semi-mechanistic explanation for increase of tMPA AUC and decrease in MPA free fraction with increasing plasma albumin concentrations, renal function and tacrolimus comedication. Simulations with the final model can be used to provide information about the effect of changes in albumin concentration or renal function on tMPA and fMPA exposure.
Van Hest et al. [36] have previously published an empirical model describing the protein binding of MPA. The current model is superior compared to the model of van Hest et al. due to a more mechanism-based character of the model. Our model described the protein binding process with a mass balance, based on physiological processes. Mechanism-based models have much better properties for extrapolation and prediction than empirical models [37].
In the current model, a competitive protein binding process was incorporated, which described the interaction between MPA and MPAG. Increasing MPAG concentrations were associated with increased free fractions of MPA and decreased tMPA exposure. The model did not only describe the protein binding of MPA, but also of the main metabolite MPAG. This was possible due to availability of fMPAG concentration–time profiles, which were not available in the study of van Hest et al. [36]. This addition allowed the protein binding process to be competitive between MPA and MPAG.
Due to the complexity of the model, runtimes were very long (55 h for the final run). The final run did not minimize successfully, due to rounding errors. As a result, no standard errors of the parameter estimates were obtained. Other methods to obtain information about the accuracy of the estimated parameters, like the bootstrap resampling method and the jackknife, could not be used because of the high computational intensity. However, the visual predictive check revealed a good agreement between the simulated and observed concentrations at all sampling time points, which indicate that the estimations of the pharmacokinetic parameters are reasonable.
The parameter BMAX is defined as the maximum number of binding sites, to which MPA and MPAG could bind. In theory, if the volume of plasma is roughly 3 l and albumin (median: 510 μmol/l) has at least one binding site, then the total number of binding sites in plasma should be ≥510 μmol/l × 3 l = 1530 μmol. In the model, BMAX was estimated to be 35100 μmol, which is indeed larger than 1530 μmol. BMAX may be larger due to the fact that other proteins are also able to bind MPA or that each albumin molecule binds more than one MPA molecule. Albumin is not confined to plasma, but is continuously filtered into interstitial fluid, and then returned to plasma via the thoracic duct. Albumin-bound drugs may therefore be present in plasma, which contains 40% of albumin in the body, and in interstitial fluid, which contains the remaining 60% [38]. The latter may increase the available number of binding sites as well.
In the model, the maximum number of binding sites available for MPA and MPAG was restricted. The number of binding sites was correlated with the plasma albumin concentration (Fig. 2a). A decrease in plasma albumin concentrations resulted in less binding sites, causing an increase in the free fraction of MPA and MPAG (Fig. 6), which has previously been reported [27, 34]. Due to this increase in the free fraction, relatively more fMPA is available for clearance, resulting in a decreased tMPA AUC (Fig. 7). However, the fMPA AUC was unaffected. The phenomenon that free concentrations are independent of protein binding is characteristic for drugs with a low extraction ratio [39]. The theoretical hepatic extraction ratio of MPA is low (0.20) [40]. The simulations showed that changes in albumin concentrations cause clinically relevant changes in tMPA AUC. A decrease in albumin concentration from 0.6 to 0.4 mmol/l, resulted in a decrease in tMPA AUC from 30.1 to 17.7 mg h/l in patients treated with cyclosporine and from 31.1 to 20.4 mg h/l in patients treated with tacrolimus. This implies that the tMPA AUC could drop below the minimal effective value of 30 mg h/l and that the MMF dose should be increased. This correlation between tMPA AUC and albumin concentrations is previously seen [34, 41]. In contrast, the fMPA AUC is almost unaffected by the change in albumin concentration. A decrease in albumin concentration from 0.6 to 0.4 mmol/l resulted in an increase in fMPA AUC from 0.82 to 0.96 mg h/l for patients cotreated with cyclosporine and from 0.84 to 0.93 mg h/l in patients cotreated with tacrolimus.
The simulations showed that changes in CrCL have major effects on both tMPAG and fMPAG exposure, but the effects on tMPA and fMPA exposure are smaller. The CNI used in patients with impaired renal function leads to a differential effect on tMPA and fMPA exposure. In case of cyclosporine, tMPA AUC decreased and fMPA AUC remains the same. While in patients cotreated with tacrolimus, an increased exposure to tMPA and a small increase in fMPA AUC was seen when CrCL decreased to 10 ml/min. These opposing effects can be explained as follows: In patients cotreated with tacrolimus, impaired renal function leads to accumulation of MPAG (Fig. 2b). Accumulating MPAG concentrations result in increased transport of MPAG to the gallbladder, leading to increased recirculation of MPAG to MPA. Because of the extra recirculation, MPAG does not accumulate to an extent where it can displace MPA from its protein binding sites. The result is increased tMPA and fMPA (Fig. 9) due to extra recirculation and no change in unbound fraction of MPA. In patients cotreated with cyclosporine, the accumulated MPAG following impaired renal function can not be compensated for by increased recirculation because cyclosporine minimizes EHC due to inhibition of MRP2 [20]. As a result MPAG displaces MPA from its protein binding sites, leading to an increased unbound fraction of MPA (Fig. 10) [11, 35]. The increased fMPA exposure is immediately compensated for by an increase in MPA glucuronidation as MPA is a drug with a low extraction ratio [40]. The result is decreased tMPA exposure, unchanged fMPA exposure and an increased MPA unbound fraction. The simulated effects of CrCL on exposure to tMPA and fMPA in patients treated with cyclosporine or tacrolimus are in accordance with previously published results [10, 31, 41, 42].
In vitro analysis showed that fMPA is the pharmacologically active compound, which is responsible for inhibition of IMPDH [27]. Patients with elevated fMPA exposure have an increased risk for leucopenia and infections [23, 24]. However, although a relationship between fMPA exposure and the risk for acute rejection should be expected, it has not been demonstrated yet. On the other hand, a correlation between tMPA exposure and the risk for acute rejection has been reported [6, 21, 22]. Clearly, more information is needed about the relationship between fMPA exposure and the risk for acute rejection and side effects to interpret the clinical effect of changes in protein binding of MPA. In general, fMPA is thought to be responsible for the immunosuppressive effect [8, 9, 27] and changes in fMPA are supposed to be clinically relevant. Alterations in both albumin concentrations and renal function have little effect on fMPA AUC and have thereby little clinical relevance. However, special attention is necessary in patients with impaired renal function cotreated with tacrolimus as the increased fMPAG can cause elevated exposure to both tMPA and fMPA.
In conclusion, this model describes the protein binding of both, MPA and its main metabolite MPAG, and the relationship with albumin concentrations, renal function and cyclosporine. When albumin concentrations decrease, tMPA exposure decreases, but fMPA exposure remains unaffected. The increase in MPAG due to impaired renal function is followed by a decrease in tMPA in patients cotreated with cyclosporine and by an increase in tMPA in patients cotreated with tacrolimus. Again, fMPA exposure is hardly affected by the changes in renal function. Changes in protein binding, caused by alterations in albumin concentrations or renal function, will not or hardly influence the exposure of a patient to the probably active agent fMPA. Therefore, changes in protein binding have little clinical relevance if fMPA is indeed the biologically active fraction.
Open Access
This article is distributed under the terms of the Creative Commons Attribution Noncommercial License which permits any noncommercial use, distribution, and reproduction in any medium, provided the original author(s) and source are credited.
List of symbols
- MPA
Mycophenolic acid
- MPAG
Mycophenolic acid glucuronide
- t
Total concentration
- f
Unbound concentration
- TLAG
Lag-time
- ka
First order absorption rate constant
- Vc
Central volume
- CL
Clearance
- Vp
Peripheral volume
- Q
Intercompartmental clearance
- knm
Rate constant between compartment n and m
- BMAX
Maximum number of protein binding sites
- TGB
Time of gallbladder emptying
- DGB
Duration of gallbladder emptying
- IPV
Interpatient variability
- CrCL
Creatinine clearance
- CsA
Cyclosporine
References
- 1.Knoll G. Trends in kidney transplantation over the past decade. Drugs. 2008;68(Suppl 1):3–10. doi: 10.2165/00003495-200868001-00002. [DOI] [PubMed] [Google Scholar]
- 2.Allison AC, Eugui EM. Purine metabolism and immunosuppressive effects of mycophenolate mofetil (MMF) Clin Transplant. 1996;10(1 Pt 2):77–84. [PubMed] [Google Scholar]
- 3.de Winter BC, Mathot RA, van Hest RM, van Gelder T. Therapeutic drug monitoring of mycophenolic acid: does it improve patient outcome? Expert Opin Drug Metab Toxicol. 2007;3(2):251–261. doi: 10.1517/17425255.3.2.251. [DOI] [PubMed] [Google Scholar]
- 4.van Gelder T, Meur YL, Shaw LM, Oellerich M, DeNofrio D, Holt C, Holt DW, Kaplan B, Kuypers D, Meiser B, Toenshoff B, Mamelok RD. Therapeutic drug monitoring of mycophenolate mofetil in transplantation. Ther Drug Monit. 2006;28(2):145–154. doi: 10.1097/01.ftd.0000199358.80013.bd. [DOI] [PubMed] [Google Scholar]
- 5.van Gelder T, Silva HT, de Fijter JW, Budde K, Kuypers D, Tyden G, Lohmus A, Sommerer C, Hartmann A, Le Meur Y, Oellerich M, Holt DW, Tonshoff B, Keown P, Campbell S, Mamelok RD. Comparing mycophenolate mofetil regimens for de novo renal transplant recipients: the fixed-dose concentration-controlled trial. Transplantation. 2008;86(8):1043–1051. doi: 10.1097/TP.0b013e318186f98a. [DOI] [PubMed] [Google Scholar]
- 6.Le Meur Y, Buchler M, Thierry A, Caillard S, Villemain F, Lavaud S, Etienne I, Westeel PF, de Ligny BH, Rostaing L, Thervet E, Szelag JC, Rerolle JP, Rousseau A, Touchard G, Marquet P. Individualized mycophenolate mofetil dosing based on drug exposure significantly improves patient outcomes after renal transplantation. Am J Transplant. 2007;7(11):2496–2503. doi: 10.1111/j.1600-6143.2007.01983.x. [DOI] [PubMed] [Google Scholar]
- 7.Shaw LM, Holt DW, Oellerich M, Meiser B, van Gelder T. Current issues in therapeutic drug monitoring of mycophenolic acid: report of a roundtable discussion. Ther Drug Monit. 2001;23(4):305–315. doi: 10.1097/00007691-200108000-00001. [DOI] [PubMed] [Google Scholar]
- 8.Cox VC, Ensom MH. Mycophenolate mofetil for solid organ transplantation: does the evidence support the need for clinical pharmacokinetic monitoring? Ther Drug Monit. 2003;25(2):137–157. doi: 10.1097/00007691-200304000-00003. [DOI] [PubMed] [Google Scholar]
- 9.Bullingham RE, Nicholls AJ, Kamm BR. Clinical pharmacokinetics of mycophenolate mofetil. Clin Pharmacokinet. 1998;34(6):429–455. doi: 10.2165/00003088-199834060-00002. [DOI] [PubMed] [Google Scholar]
- 10.van Hest RM, van Gelder T, Vulto AG, Mathot RA. Population pharmacokinetics of mycophenolic acid in renal transplant recipients. Clin Pharmacokinet. 2005;44(10):1083–1096. doi: 10.2165/00003088-200544100-00006. [DOI] [PubMed] [Google Scholar]
- 11.Kaplan B, Meier-Kriesche HU, Friedman G, Mulgaonkar S, Gruber S, Korecka M, Brayman KL, Shaw LM. The effect of renal insufficiency on mycophenolic acid protein binding. J Clin Pharmacol. 1999;39(7):715–720. doi: 10.1177/00912709922008353. [DOI] [PubMed] [Google Scholar]
- 12.Kuypers DR, Vanrenterghem Y, Squifflet JP, Mourad M, Abramowicz D, Oellerich M, Armstrong V, Shipkova M, Daems J. Twelve-month evaluation of the clinical pharmacokinetics of total and free mycophenolic acid and its glucuronide metabolites in renal allograft recipients on low dose tacrolimus in combination with mycophenolate mofetil. Ther Drug Monit. 2003;25(5):609–622. doi: 10.1097/00007691-200310000-00011. [DOI] [PubMed] [Google Scholar]
- 13.Weber LT, Lamersdorf T, Shipkova M, Niedmann PD, Wiesel M, Zimmerhackl LB, Staskewitz A, Schutz E, Mehls O, Oellerich M, Armstrong VW, Tonshoff B. Area under the plasma concentration-time curve for total, but not for free, mycophenolic acid increases in the stable phase after renal transplantation: a longitudinal study in pediatric patients. German study group on mycophenolate mofetil therapy in pediatric renal transplant recipients. Ther Drug Monit. 1999;21(5):498–506. doi: 10.1097/00007691-199910000-00002. [DOI] [PubMed] [Google Scholar]
- 14.Gonzalez-Roncero FM, Gentil MA, Brunet M, Algarra G, Pereira P, Cabello V, Peralvo M. Pharmacokinetics of mycophenolate mofetil in kidney transplant patients with renal insufficiency. Transplant Proc. 2005;37(9):3749–3751. doi: 10.1016/j.transproceed.2005.09.202. [DOI] [PubMed] [Google Scholar]
- 15.Shaw LM, Mick R, Nowak I, Korecka M, Brayman KL. Pharmacokinetics of mycophenolic acid in renal transplant patients with delayed graft function. J Clin Pharmacol. 1998;38(3):268–275. doi: 10.1002/j.1552-4604.1998.tb04424.x. [DOI] [PubMed] [Google Scholar]
- 16.Jiao Z, Zhong JY, Zhang M, Shi XJ, Yu YQ, Lu WY. Total and free mycophenolic acid and its 7-O-glucuronide metabolite in Chinese adult renal transplant patients: pharmacokinetics and application of limited sampling strategies. Eur J Clin Pharmacol. 2007;63(1):27–37. doi: 10.1007/s00228-006-0215-y. [DOI] [PubMed] [Google Scholar]
- 17.Johnson AG, Rigby RJ, Taylor PJ, Jones CE, Allen J, Franzen K, Falk MC, Nicol D. The kinetics of mycophenolic acid and its glucuronide metabolite in adult kidney transplant recipients. Clin Pharmacol Ther. 1999;66(5):492–500. doi: 10.1016/S0009-9236(99)70012-3. [DOI] [PubMed] [Google Scholar]
- 18.van Gelder T, Klupp J, Barten MJ, Christians U, Morris RE. Comparison of the effects of tacrolimus and cyclosporine on the pharmacokinetics of mycophenolic acid. Ther Drug Monit. 2001;23(2):119–128. doi: 10.1097/00007691-200104000-00005. [DOI] [PubMed] [Google Scholar]
- 19.Filler G, Zimmering M, Mai I. Pharmacokinetics of mycophenolate mofetil are influenced by concomitant immunosuppression. Pediatr Nephrol. 2000;14(2):100–104. doi: 10.1007/s004670050021. [DOI] [PubMed] [Google Scholar]
- 20.Hesselink DA, van Hest RM, Mathot RA, Bonthuis F, Weimar W, de Bruin RW, van Gelder T. Cyclosporine interacts with mycophenolic acid by inhibiting the multidrug resistance-associated protein 2. Am J Transplant. 2005;5(5):987–994. doi: 10.1046/j.1600-6143.2005.00779.x. [DOI] [PubMed] [Google Scholar]
- 21.Kiberd BA, Lawen J, Fraser AD, Keough-Ryan T, Belitsky P. Early adequate mycophenolic acid exposure is associated with less rejection in kidney transplantation. Am J Transplant. 2004;4(7):1079–1083. doi: 10.1111/j.1600-6143.2004.00455.x. [DOI] [PubMed] [Google Scholar]
- 22.Hale MD, Nicholls AJ, Bullingham RE, Hene R, Hoitsma A, Squifflet JP, Weimar W, Vanrenterghem Y, Van de Woude FJ, Verpooten GA. The pharmacokinetic-pharmacodynamic relationship for mycophenolate mofetil in renal transplantation. Clin Pharmacol Ther. 1998;64(6):672–683. doi: 10.1016/S0009-9236(98)90058-3. [DOI] [PubMed] [Google Scholar]
- 23.Weber LT, Shipkova M, Armstrong VW, Wagner N, Schutz E, Mehls O, Zimmerhackl LB, Oellerich M, Tonshoff B. The pharmacokinetic-pharmacodynamic relationship for total and free mycophenolic Acid in pediatric renal transplant recipients: a report of the german study group on mycophenolate mofetil therapy. J Am Soc Nephrol. 2002;13(3):759–768. doi: 10.1681/ASN.V133759. [DOI] [PubMed] [Google Scholar]
- 24.Atcheson BA, Taylor PJ, Mudge DW, Johnson DW, Hawley CM, Campbell SB, Isbel NM, Pillans PI, Tett SE. Mycophenolic acid pharmacokinetics and related outcomes early after renal transplant. Br J Clin Pharmacol. 2005;59(3):271–280. doi: 10.1111/j.1365-2125.2004.02235.x. [DOI] [PMC free article] [PubMed] [Google Scholar]
- 25.van Gelder T, Hilbrands LB, Vanrenterghem Y, Weimar W, de Fijter JW, Squifflet JP, Hene RJ, Verpooten GA, Navarro MT, Hale MD, Nicholls AJ. A randomized double-blind, multicenter plasma concentration controlled study of the safety and efficacy of oral mycophenolate mofetil for the prevention of acute rejection after kidney transplantation. Transplantation. 1999;68(2):261–266. doi: 10.1097/00007890-199907270-00018. [DOI] [PubMed] [Google Scholar]
- 26.Tsina I, Chu F, Hama K, Kaloostian M, Tam YL, Tarnowski T, Wong B. Manual and automated (robotic) high-performance liquid chromatography methods for the determination of mycophenolic acid and its glucuronide conjugate in human plasma. J Chromatogr B Biomed Appl. 1996;675(1):119–129. doi: 10.1016/0378-4347(95)00343-6. [DOI] [PubMed] [Google Scholar]
- 27.Nowak I, Shaw LM. Mycophenolic acid binding to human serum albumin: characterization and relation to pharmacodynamics. Clin Chem. 1995;41(7):1011–1017. [PubMed] [Google Scholar]
- 28.Sombogaard F, Van Schaik RHN, Mathot RA, Budde K, Van der Werf M, Vulto AG, Weimar W, Glander P, Essioux L, Van Gelder T. Interpatient variability in IMPDH activity in MMF-treated renal transplant patients is correlated with IMPDH type II 3757T>C polymorphisms. Pharmacogenet Genomics. 2009;19(8):626–634. doi: 10.1097/FPC.0b013e32832f5f1b. [DOI] [PubMed] [Google Scholar]
- 29.Glander P, Sombogaard F, Budde K, van Gelder T, Hambach P, Liefeldt L, Lorkowski C, Mai M, Neumayer HH, Vulto AG, Mathot RA. Improved assay for the nonradioactive determination of inosine 5’-monophosphate dehydrogenase activity in peripheral blood mononuclear cells. Ther Drug Monit. 2009;31(3):351–359. doi: 10.1097/FTD.0b013e31819c3f3d. [DOI] [PubMed] [Google Scholar]
- 30.Jonsson EN, Karlsson MO. Xpose–an S-PLUS based population pharmacokinetic/pharmacodynamic model building aid for NONMEM. Comput Methods Programs Biomed. 1999;58(1):51–64. doi: 10.1016/S0169-2607(98)00067-4. [DOI] [PubMed] [Google Scholar]
- 31.de Winter BC, Neumann I, van Hest RM, van Gelder T, Mathot RA. Limited sampling strategies for therapeutic drug monitoring of mycophenolate mofetil therapy in patients with autoimmune disease. Ther Drug Monit. 2009;31(3):382–390. doi: 10.1097/FTD.0b013e3181a23f1a. [DOI] [PubMed] [Google Scholar]
- 32.Cockroft D, Gault M. Prediction of creatinine clearance from serum creatinine. Nephron. 1976;16:31–41. doi: 10.1159/000180580. [DOI] [PubMed] [Google Scholar]
- 33.Jadhav PR, Gobburu JV. A new equivalence based metric for predictive check to qualify mixed-effects models. Aaps J. 2005;7(3):E523–E531. doi: 10.1208/aapsj070353. [DOI] [PMC free article] [PubMed] [Google Scholar]
- 34.Atcheson BA, Taylor PJ, Kirkpatrick CM, Duffull SB, Mudge DW, Pillans PI, Johnson DW, Tett SE. Free mycophenolic acid should be monitored in renal transplant recipients with hypoalbuminemia. Ther Drug Monit. 2004;26(3):284–286. doi: 10.1097/00007691-200406000-00011. [DOI] [PubMed] [Google Scholar]
- 35.Shaw LM, Korecka M, Aradhye S, Grossman R, Bayer L, Innes C, Cucciara A, Barker C, Naji A, Nicholls A, Brayman K. Mycophenolic acid area under the curve values in African American and Caucasian renal transplant patients are comparable. J Clin Pharmacol. 2000;40(6):624–633. doi: 10.1177/00912700022009260. [DOI] [PubMed] [Google Scholar]
- 36.van Hest RM, van Gelder T, Vulto AG, Shaw LM, Mathot RA. Pharmacokinetic modeling of the plasma protein binding of mycophenolic acid in renal transplant recipients. Clin Pharmacokinet. 2009;48(7):463–476. doi: 10.2165/11312600-000000000-00000. [DOI] [PubMed] [Google Scholar]
- 37.Danhof M, Alvan G, Dahl SG, Kuhlmann J, Paintaud G. Mechanism-based pharmacokinetic-pharmacodynamic modeling-a new classification of biomarkers. Pharm Res. 2005;22(9):1432–1437. doi: 10.1007/s11095-005-5882-3. [DOI] [PubMed] [Google Scholar]
- 38.Tillement JP, Lhoste F, Giudicelli JF. Diseases and drug protein binding. Clin Pharmacokinet. 1978;3(2):144–154. doi: 10.2165/00003088-197803020-00004. [DOI] [PubMed] [Google Scholar]
- 39.Benet LZ, Hoener BA. Changes in plasma protein binding have little clinical relevance. Clin Pharmacol Ther. 2002;71(3):115–121. doi: 10.1067/mcp.2002.121829. [DOI] [PubMed] [Google Scholar]
- 40.Bowalgaha K, Miners JO. The glucuronidation of mycophenolic acid by human liver, kidney and jejunum microsomes. Br J Clin Pharmacol. 2001;52(5):605–609. doi: 10.1046/j.0306-5251.2001.01487.x. [DOI] [PMC free article] [PubMed] [Google Scholar]
- 41.van Hest RM, Mathot RA, Pescovitz MD, Gordon R, Mamelok RD, van Gelder T. Explaining variability in mycophenolic acid exposure to optimize mycophenolate mofetil dosing: a population pharmacokinetic meta-analysis of mycophenolic acid in renal transplant recipients. J Am Soc Nephrol. 2006;17(3):871–880. doi: 10.1681/ASN.2005101070. [DOI] [PubMed] [Google Scholar]
- 42.Naesens M, de Loor H, Vanrenterghem Y, Kuypers DR. The impact of renal allograft function on exposure and elimination of mycophenolic acid (MPA) and its metabolite MPA 7-O-glucuronide. Transplantation. 2007;84(3):362–373. doi: 10.1097/01.tp.0000276936.14041.6c. [DOI] [PubMed] [Google Scholar]


