Abstract
As part of our ongoing project that aims at the optimum characterization of the electronic structure of the blue-copper site of azurin from Pseudomonas aeruginosa, we present the complete hyperfine tensors of the protons bound to the Cβ atom of the copper-bound cysteine 112. These tensors have been obtained from a 95 GHz pulsed electron-nuclear double resonance study of a single crystal of the protein.
Introduction
Besides the geometric structure of proteins and enzymes, the electronic structure of the active site is an indispensable ingredient in the analysis of the structure–function relationship of such biosystems. Whether the function involves electron transfer, bond breaking, and/or bond formation, in all cases rearrangement of the electron distribution is under discussion. For active sites carrying one or more transition metal ions in a paramagnetic oxidation state, the most informative method to study the electronic structure is electron paramagnetic resonance (EPR) spectroscopy.
Here, we consider the type 1 or blue-copper site, which is involved in electron transfer in a variety of proteins and enzymes. A conserved property of the type 1 coordination is the ligation of copper by three strong equatorial ligands, the sulfur atom Sγ of a cysteine residue and the nitrogen atoms Nδ of two histidines. The copper is about in the plane of these sulfur and nitrogen atoms, and a fourth, axial ligand is present, commonly the sulfur of a methionine. In particular, two proteins, plastocyanin and azurin, have extensively been studied as their copper sites are characteristic for this coordination. Plastocyanin, because it was the first blue-copper protein that was crystallized, and whose structure was derived from X-ray diffraction studies [1]. Second, azurin (Fig. 1), because it was the first blue-copper protein that was genetically modified. Its structure was available soon after that of plastocyanin [2, 3]. Azurin and mutants thereof have extensively been used to investigate the properties of the blue-copper site including its electronic structure [4].
Fig. 1.
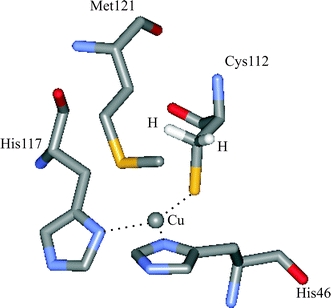
The copper site of azurin. The copper is coordinated by three strong equatorial ligands (Nδ of histidine 46 and 117 and Sγ of cysteine 112). The sulfur of a methionine and the oxygen of a glycine provide two weak axial ligands. The Cys-βHs are also shown
During the last decades, developments have taken place in EPR instrumentation, which have significantly broadened the applicability of this technique to biosystems. These developments concern the use of pulsed microwave excitation [5] and the development of spectrometers that operate at microwave frequencies significantly higher than 9 GHz and correspondingly high magnetic fields [6]. Apart from resolution enhancement, these spectrometers show an increased sensitivity for small samples. In 1994, we realized that this could enable the study of protein crystals, for which a submillimeter size is common. Indeed, since then we have investigated single crystals of azurin by electron spin echo (ESE)-detected EPR at 95 GHz, which resulted in complete tensorial information on g [7] and the hyperfine and quadrupole interaction of the copper-coordinated and remote nitrogens of the histidine residues [8, 9]. The nitrogen hyperfine tensors nicely reveal the (asymmetric) delocalization of the unpaired electron over the histidine residues, but the delocalization over the cysteine residue remained undetermined. This is unsatisfactory because the strong covalent character of the copper–sulfur bond is considered the decisive property of the blue-copper site. Quantification of the extent of the delocalization of the electronic wave function over the copper-bound sulfur is, in principle, possible by pulsed 33S electron-nuclear double resonance (ENDOR). This would require isotope enrichment of the protein, as the natural abundance of 33S is only 0.75%. Instead, we study the hyperfine interaction of the unpaired electron with the nuclear spin of the protons bound to the Cβ atom of cysteine (Cys-βHs), which provides a measure of the copper–cysteine ligation.
In an attempt to determine the complete hyperfine tensors of the Cys-βHs, we recently studied an isotopomer of azurin in which the two Cys-βHs of the cysteine 112 ligand were replaced by deuterium [10]. Because of the quadrupole moment of deuterium, this study, in principle, provided information on the orientation of the C–D(H) bonds in the copper site, as well. The analysis of these experiments turned out to be difficult and only partly successful, which led us to the present complementary study of the wild-type azurin.
Our efforts to push on the characterization of the copper site of azurin by EPR are also driven by the fact that the calculation of EPR parameters has become a critical test of the quantum-chemical description of the blue-copper site. Various ab initio and density functional theory (DFT) approaches have shown that a proper description of the electronic structure of this copper coordination is far from trivial, but progress has been made during the last years [11–13]. The availability of hyperfine tensors of ligand nuclei, as an experimental measure of the extent of the electronic wave function, allows a critical test of the calculated wave function of the ground state. In this sense, the hyperfine tensors of the Cys-βHs would be most valuable data.
In this paper, we report on a pulsed ENDOR study of a single crystal of the blue-copper protein azurin from Pseudomonas aeruginosa from which we derive the complete hyperfine tensors of the Cys-βHs.
Materials and Methods
Azurin from P. aeruginosa was purified as described elsewhere [14]. Crystals of the oxidized protein were grown by vapor diffusion, as reported previously [3]. Typical dimensions of the crystals studied were 0.5 × 0.3 × 0.3 mm. The space group of the crystals is P212121 and the unit cell contains 16 molecules, with 4 molecules per asymmetric unit. The single crystal was mounted in a quartz tube with the inner and outer diameters of 0.6 and 0.84 mm, respectively. The tube ends were sealed with wax. The sample tube and the magnet could be rotated around independent axes, thus enabling experiments at every possible orientation of the magnetic field with respect to the crystal, without remounting the crystal.
The EPR and ENDOR experiments were performed at 2 K, using a homebuilt 95 GHz pulsed EPR spectrometer [15]. A Mims-type three-pulse ENDOR sequence was used and the length of the microwave pulses was 260 ns. The time between the first and the second microwave pulse was 420 ns, the time between the second and the third microwave pulse was optimized for the different orientations and varied between 35 and 60 μs. The repetition rate varied between 0.1 and 0.5 kHz.
An EPR study was performed on the azurin, crystal to determine the orientation in the laboratory frame of the g-tensor principal axes systems x, y, z of the 16 molecules in the unit cell. Subsequently, one molecule was chosen for the proton ENDOR measurements. In addition, the nitrogen ENDOR spectrum of the remote nitrogens of the histidines was measured on the same crystal at an orientation of 150° from x in the xy plane of the g-tensor principal axes system of this molecule. As this spectrum is known from previous experiments [9], this measurement allows us to consistently couple the present data to the previous ones. In this way, we are able to translate the observed directions of the principal axes of the hyperfine tensors into directions in the copper site.
Results
For many orientations of the magnetic field with respect to a single crystal of azurin, ESE-detected EPR spectra have been acquired. The orientation in the laboratory frame of the g-tensor principal axes was obtained for all the 16 azurin molecules in the unit cell. One molecule was then selected and the proton ENDOR experiments were performed for many orientations of the magnetic field with respect to the crystal, adjusting the field strength to remain in resonance with the EPR transition of that molecule. Orientations were chosen in four planes, three of which concerned the principal planes of the g-tensor. In Fig. 2, a spectrum acquired with the magnetic field parallel to x and at field strength of 3.326 T is shown. Two broad ENDOR transitions are observed at about 10 MHz from the hydrogen Zeeman frequency ν Z (141.589 MHz), which originate from the Cys-βHs of the copper bound cysteine. From one hydrogen atom (I = 1/2), we expect to see two ENDOR transitions, symmetrically displaced with respect to the nuclear Zeeman frequency.
Fig. 2.
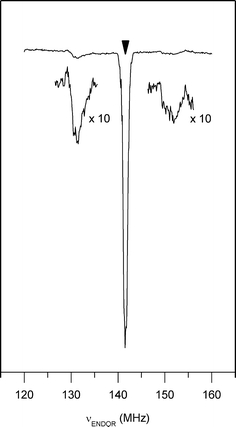
The proton ENDOR spectrum of an azurin single crystal for the magnetic field parallel to the principal x axis (B = 3.3226 T) of one of the molecules in the unit cell. Only the region around the hydrogen nuclear Zeeman frequency, which is indicated by the arrow, is shown
Figure 3 shows ENDOR spectra acquired for various orientations of the magnetic field in the principal planes of the g-tensor. Only one of the two ENDOR transitions around the nuclear Zeeman frequency is presented. For each orientation, a broad ENDOR signal is observed, with line width varying between 2 and 3.5 MHz. The signal derives from the superposition of two transitions owing to the two hydrogen nuclei, which results in band shapes with varying asymmetry. In the analysis, the ENDOR signals were approximated by two Gaussian functions of equal line width. In this way, the frequencies of the ENDOR transitions of the two hydrogen nuclei were extracted for each orientation of the magnetic field with respect to the crystal. These frequencies are represented in Fig. 4 and were analyzed according to the following equation:
 |
1 |
Here α, β = x, y, z and x, y, z represent the principal axes system of the g-tensor. The unit vector  represents the direction of the magnetic field
  in x, y, z. The g
α values represent the principal values of the g-matrix, and
 |
2 |
Fig. 3.
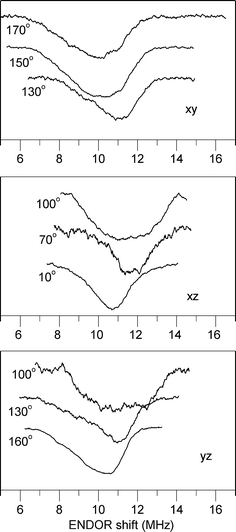
The proton ENDOR spectra of an azurin single crystal for various orientations of the magnetic field in the xy, xz and yz planes of the g-tensor. The x direction corresponds to 0° in the xy and xz planes; the y direction corresponds to 0° for the yz plane. The ENDOR shift is defined as ν Ζ − ν ENDOR
Fig. 4.
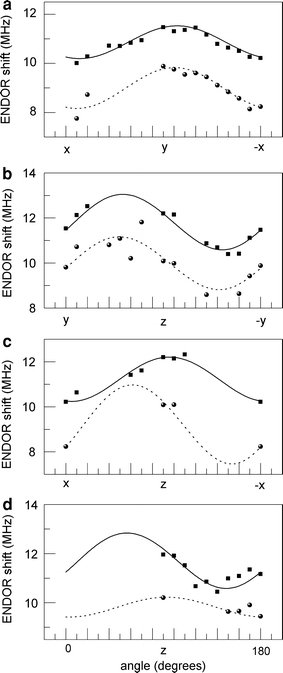
The proton ENDOR resonances as a function of the orientation of the magnetic field in the following planes: xy (a), yz (b), xz (c), and the plane containing z and crossing the xy plane at 130° from x (d). The dots (squares for H1 and circles for H2) represent the data points, the lines (solid for H1 and dotted for H2) are the fits based on Eq. (1). The ENDOR shift is defined as ν Ζ − ν ENDOR
The lines in Fig. 4 represent the fit of the ENDOR frequencies based on Eq. (1) and the resulting hyperfine tensors are summarized in Table 1. The fit nicely describes most of the ENDOR frequencies, but for a few orientations, the experimental data deviate significantly, up to 1 MHz, from the calculated frequencies. This deviation, which is still within the line width of the ENDOR signal, results from the fact that for these orientations a reliable decomposition of the ENDOR band into two Gaussians was not possible.
Table 1.
Hyperfine tensors of the two hydrogen nuclei as obtained from the fit of the ENDOR frequencies using Eq. (1)
| A iso/h | A x′x′/h | A y′y′/h | A z′z′/h | x′ | y′ | z′ | ||
|---|---|---|---|---|---|---|---|---|
| H1 | 22.6 (0.3) | −2.2 (0.6) | −1.3 (0.6) | 3.6 (0.6) | x | 0.955 | −0.272 | −0.114 |
| y | 0.285 | 0.752 | 0.594 | |||||
| z | −0.080 | −0.600 | 0.796 | |||||
| H2 | 18.8 (0.4) | −4.4 (0.8) | 0.25 (0.8) | 4.15 (0.8) | x | 0.805 | 0.504 | 0.314 |
| y | 0.316 | −0.811 | 0.492 | |||||
| z | −0.503 | 0.297 | 0.812 |
The hyperfine values are expressed in MHz. The tensors are decomposed in their isotropic and anisotropic contribution. The values in brackets represent the errors in the tensor elements. The direction cosines represent the directions of the principal axes systems of the proton hyperfine tensors (x′, y′, z′) in the principal axes system (x, y, z) of the g-tensor. We have taken A iso positive
Discussion
Proton ENDOR spectra have been obtained for many orientations of the magnetic field with respect to one molecule in the unit cell of a single crystal of wild-type azurin from P. aeruginosa. The ENDOR shifts observed for the magnetic field applied along the principal y and z axes of the g tensor correspond to shifts previously measured for frozen solutions by Epel et al. [16] at 95 GHz and Werst et al. [17] at 35 GHz. From the present experiments on the single crystal, the complete hyperfine tensors of the Cys-βHs have been derived (Table 1).
The two Cβ hydrogens of cysteine 112 have different isotropic hyperfine interactions, which amount to 22.6 and 18.8 MHz. These values yield estimates of the spin densities on the hydrogens of 1.6 and 1.3%, as unit spin density in a hydrogen 1s orbital corresponds to an isotropic hyperfine interaction of 1420 MHz.
In a previous pulsed ENDOR study, we investigated an isotopomer of azurin in which the Cβ hydrogens of cysteine 112 were substituted by deuterium [10]. This substitution introduces nuclei with a quadrupole moment. The idea was that the analysis of the quadrupole interaction would provide the orientation of the C–D(H) bonds in the copper site and thereby support the interpretation of the hyperfine tensors. The comparison of the ENDOR signals for the wild type and deuterated azurin reveals no noticeable differences. This is illustrated in Fig. 5 for the ENDOR spectra that correspond to the orientations of the magnetic field along the principal axes of the g-tensor. After rescaling (g H/g D = 6.5144), the ENDOR bands overlap and specific contributions of the quadrupole interaction for the deuterated azurin cannot be discerned. All ENDOR bands are broad, which seems to derive from an inhomogeneous distribution of hyperfine interactions.
Fig. 5.
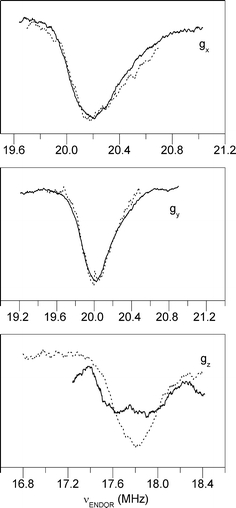
Comparison of the proton ENDOR spectra of wild-type azurin (solid lines) for directions of the magnetic field parallel to x, y and z with the corresponding deuterium ENDOR spectra of deuterated azurin (dotted lines) from Ref. [10]. The spectra of the wild-type azurin have been rescaled with the factor g H/g D = 6.5144
The anisotropy of the hyperfine interaction of the Cys-βHs amounts to at most 23%. It is this anisotropic part of the hyperfine tensors that contains the information as regards the extent of the electron–spin distribution over the copper atom and the cysteine ligand. The anisotropic hyperfine interaction is proportional to the spin density and inversely proportional to the third power of the distance between the electron–spin density and the nucleus. The spin density at the Cβ is small but near, while the spin densities at the Sγ and Cu are much larger but more remote. Only the contribution of spin density on the histidine residues to the anisotropic proton hyperfine is negligible because of their large distance to the hydrogens. To reproduce the anisotropy therefore requires a wave function that properly describes the spin–density distribution between the copper and sulphur atoms. For this reason, the present data are most useful when it comes to judge the quality of a quantum-chemical description of the blue-copper site.
From a quantum-chemical point of view, the quantitative description of the blue-copper site has been found difficult. Recently, significant progress was reported, which shows that inclusion of e.g., the backbone amide of asparagine 47 that forms a hydrogen bond with the cysteine sulfur and of the protein matrix is a prerequisite of an adequate description [11, 13]. However, as yet no wave function has been demonstrated to reproduce both the optical absorption spectrum, the g-tensor and the (super)hyperfine tensors. The full set of EPR parameters known for the copper site of azurin makes this protein the ideal test system for any quantum-chemical calculation, be it based on ab initio theory or DFT. To reproduce the anisotropy of the proton hyperfine tensors that result from the present study really is the critical test.
Acknowledgment
The research was supported with financial aid by The Netherlands Organization for Scientific Research (NWO), Department of Chemical Sciences (CW).
Open Access
This article is distributed under the terms of the Creative Commons Attribution Noncommercial License which permits any noncommercial use, distribution, and reproduction in any medium, provided the original author(s) and source are credited.
References
- 1.Colman PM, Freeman HC, Guss JM, Murata M, Norris KA, Ramshaw JAM, Venkatappa MP. Nature. 1978;272:319. doi: 10.1038/272319a0. [DOI] [Google Scholar]
- 2.Adman ET, Jensen LH. Israel J. Chem. 1981;21:8. [Google Scholar]
- 3.Nar H, Messerschmidt A, Huber R, van der Kamp M, Canters GW. J. Mol. Biol. 1991;221:765. doi: 10.1016/0022-2836(91)80173-R. [DOI] [PubMed] [Google Scholar]
- 4.Kolczak U, Dennison C, Messerschmidt A, Canters GW. Azurin and Azurin Mutants. In: Wieghardt K, Huber R, Poulos TL, Messerschmidt A, editors. Handbook of Metalloproteins. Chichester: Wiley; 2001. p. 1170. [Google Scholar]
- 5.Schweiger A, Jeschke G. Principles of Pulse Electron Paramagnetic Resonance. Oxford: Oxford University Press; 2001. [Google Scholar]
- 6.Grinberg O, Berliner LJ. Very High Frequency ESR/EPR. Biological Magnetic Resonance. New York: Kluwer; 2004. [Google Scholar]
- 7.Coremans JWA, Poluektov OG, Groenen EJJ, Canters GW, Nar GW, Messerschmidt A. J. Am. Chem. Soc. 1994;116:3097. doi: 10.1021/ja00086a044. [DOI] [Google Scholar]
- 8.Coremans JWA, Poluektov OG, Groenen EJJ, Canters GW, Nar GW, Messerschmidt A. J. Am. Chem. Soc. 1997;119:4726. doi: 10.1021/ja9638420. [DOI] [Google Scholar]
- 9.Coremans JWA, Poluektov OG, Groenen EJJ, Canters GW, Nar GW, Messerschmidt A. J. Am. Chem. Soc. 1996;118:12141. doi: 10.1021/ja962076u. [DOI] [Google Scholar]
- 10.Fittipaldi M, Warmerdam GCM, de Waal EC, Canters GW, Cavazzini D, Rossi GL, Huber M, Groenen EJJ. Chem. Phys. Chem. 2006;7:1286. doi: 10.1002/cphc.200500551. [DOI] [PubMed] [Google Scholar]
- 11.Sinnecker S, Neese F. J. Comput. Chem. 2006;27:1463. doi: 10.1002/jcc.20426. [DOI] [PubMed] [Google Scholar]
- 12.Remenyi C, Reviakine R, Kaupp M. J. Phys. Chem. B. 2007;111:8290. doi: 10.1021/jp071745v. [DOI] [PubMed] [Google Scholar]
- 13.Vancoillie S, Pierloot K. J. Phys. Chem. A. 2008;112:4011. doi: 10.1021/jp711345n. [DOI] [PubMed] [Google Scholar]
- 14.van de Kamp M, Hali FC, Rosato N, Finazzi Agro A, Canters GW. Biochim. Biophys. Acta. 1990;1019:283. doi: 10.1016/0005-2728(90)90206-J. [DOI] [PubMed] [Google Scholar]
- 15.Disselhorst JAJM, van der Meer H, Poluektov OG, Schmidt J. J. Magn. Reson. Ser. A. 1995;115:183. doi: 10.1006/jmra.1995.1165. [DOI] [Google Scholar]
- 16.Epel B, Slutter CS, Neese F, Kroneck PMH, Zumft WG, Pecht I, Farver O, Lu Y, Goldfarb D. J. Am. Chem. Soc. 2002;124:8152. doi: 10.1021/ja012514j. [DOI] [PubMed] [Google Scholar]
- 17.Werst MM, Davoust CE, Hoffman BM. J. Am. Chem. Soc. 1991;113:1533. doi: 10.1021/ja00005a011. [DOI] [Google Scholar]


