Microreentry
Although it is well accepted that ventricular arrhythmias can arise by reentry, several mapping studies have reported focal activation sequences during arrhythmias in which a wavefront spreads away in all directions from the site of earliest recorded activation. If the maps are two-dimensional, obtained by mapping the epicardial or endocardial surface, this activation sequence may not indicate a true focus but rather an intramural wavefront breaking through to the surface. However, this focal activation pattern has also been observed in three-dimensional mapping studies with plunge needles inserted through the ventricular wall.1, 2 These studies include the disclaimer that the focal activation pattern may arise from a microreentrant circuit that is so small it cannot be detected by the plunge needle electrodes. This Viewpoint examines the basis for this disclaimer and estimates the electrode spacing needed to detect the smallest microreentrant circuits.
The Size of Microreentrant Pathways Recorded Experimentally
A search for microreentry and localized reentry in PubMed yielded 50 references, 21 for the atria, 27 for the ventricles, 1 for the AV node and 1 for a bypass track. In 30 of the papers, microreentry is alluded to by nature of its potential rather than analysis of any specific mapping data, while in 9 other papers, microreentry is proposed as an underlying mechanism based on a limited number of catheter recordings in humans that show fractionated electrograms. While such fractionation suggests slow conduction or a “zig-zag” pattern of activation,3 these limited findings do not constitute identification of a microreentrant circuit. In only 7 papers was the mapping resolution adequate to define a reentrant circuit; 3 showed a reentrant path length of 1-2 cm,4-6 while in the other 4, the reentrant path length exceeded 2-3 cm.7-10
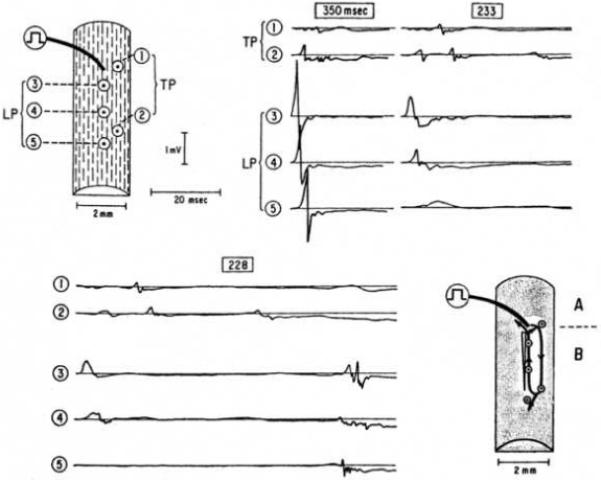
A study by Spach and colleagues in superfused human atrial trabeculae is often cited as showing the smallest microreentrant circuit that has been observed.11 Although reentry was never encountered in atrial bundles from young individuals, it could be produced by premature pacing in atrial bundles from 3 of 15 older patients whose ages ranged from 43 to 70 years. These patients had thick, long, collagenous septea that isolated adjacent atrial myofibers and groups of myofibers. When a premature stimulus was given at a coupling interval of 350 ms, activation propagated rapidly along the long axis of the muscle fibers but exhibited markedly polyphasic extracellular waveforms with transverse propagation, indicating sparse side-to-side electrical coupling in the transverse direction, consistent with the extensive collagenous septae (Figure 1). At a premature coupling interval of 233 ms, there was decremental conduction along the long axis of the muscle fibers with additional multiple deflections transverse to the fibers. At a premature coupling interval of 228 ms, conduction block occurred in the longitudinal direction with further delay in the time between the multiple deflections in the transverse direction that led to a single cycle of reentry. Spach et al estimated this reentrant circuit to be 0.6 mm wide and 2.6 mm long, with an area on the endocardial surface of 1.6 mm2. The single cycle of reentry could be reproduced for as long as 40 min by the single premature stimulus.
Figure 1.

Microreentry in response to premature action potentials in older, nonuniform anisotropic bundle. Results were obtained at basic stimulus rate of 171/min; a premature stimulus was introduced every 10th beat at intervals shown in box above each group of waveforms. Drawings at upper left shows locations where each waveform was recorded. Drawing at lower right shows perimeter of reentrant circuit, indicated by solid lines with arrows. Open elongated triangle indicates initial decremental longitudinal conduction to block. Shaded region denotes surrounding areas in which extracellular potentials waveforms were recorded at 16 sites; at each of these peripheral sites, local excitation occurred after that of sites confined to perimeter of reentrant circuit for the corresponding area. This confirmed that the circuit that initiated reentry was limited to region marked by solid lines with arrows. Action potentials measured during regular paced beats at sites above location of stimulus (region A) were greater in duration than those measured in region B. Preparation was from 64-year-old patient with markedly dilated right atrium secondary to underlying atrial septal defect. Used with permission from Spach et al.11
Aside from the potential problems related to injury from the cut ends of the preparation and the possibility of ischemia in deeper layers of this superfused preparation, mapping data are provided from only 5 sites, because this work was performed before the widespread availability of multi-channel mapping systems. Although not shown, multiple recording sites outside the area are stated to have activation times later than those inside the area of the reentrant circuit. The manuscript suggests that the late activation at site 2 represents late activation along a small microreentry pathway shown by the arrows. However, because of the small number of mapped sites, the reentrant pathway could have been larger than that indicated by the arrows. In addition, our reanalysis of the tracings in the figure suggests that the late activation at site 2 (~52 ms after early activation at site 3) did not meet the slope criterion for activation that the authors propose in the paper. Moreover, the possibility that the late activation could represent early “nonreentrant” activation from site 2 was not strongly considered. Thus, while provocative, the study of Spach et al. may not definitely represent an extremely small microreentry circuit.
Zuanetti, Hoyt and Corr recorded from a 224-site grid array with an interelectrode distance of 2 mm.12 They demonstrated a small reentrant circuit in vitro in a superfused preparation of infarcted canine LV epicardium on the order of 1 cm in radius and 3 cm in circumference. Slow activation was consistently demonstrated at recording sites more than 1-2 cm from the center of the reentrant circuit so that the reentrant loops were not hidden but could be detected by a mapping resolution of 2-4 mm.
Back of the Envelope Estimate of the Minimum Size of a Microreentrant Pathway
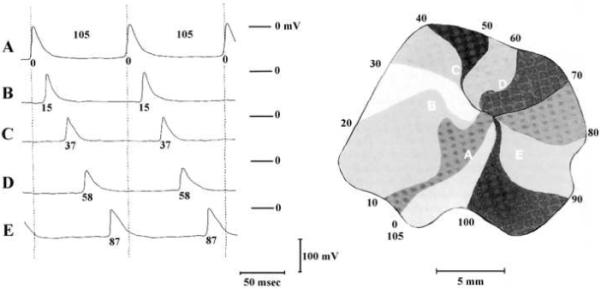
If we assume that the slowest conduction velocity is 0.1 m/s and the shortest refractory period is 100 ms, then the perimeter of a reentrant core could be as small as 10 mm. For a circular core, this translates into a diameter of approximately 3 mm. Therefore, to detect the size of this reentrant core, an electrical or optical sensor spacing of less than 3 mm is required. However, the fact that a reentrant core might be as small as 3 mm in diameter does not necessarily mean that sensors must be this close together to detect the presence of reentry. Just as the effects of a hurricane, whose eye can be as small as two miles in diameter, can be felt hundreds of miles away from the eye, the effects of a reentrant circuit on activation sequences can be detected millimeters and even centimeters away from the reentrant core. As shown in Figure 2, even though the reentrant core can be very small, the activation front spiraling around this core can be detected and mapped with sensors several mms apart.13 This pattern of spread, with activations present throughout the cycle length and with latest activation of one cycle immediately adjacent to earliest activation of the next cycle, is clearly distinguishable from a focal activation pattern in which wavefronts spread centrifugally in all directions away from the site of earliest activation during the cycle. Therefore, it should be possible to detect a single microreentant circuit in cardiac tissue that does not contain fibrotic scars or acute necrosis. If a scar or necrotic region contains a closed pathway of viable muscle that connects to the tissue outside of the scar or necrotic region, then reentry within the scar or necrosis could create a focal type of activation pattern as it spreads into the normal muscle outside the scar or necrosis. Based on a minimum conduction velocity of 0.01 m/s and a shortest refractory period of 100 ms, this scar or necrotic region could be less than 1 mm in diameter.
Figure 2.

Map of the spread of activation during reentry in a piece of isolated left atrial muscle during a period of sustained tachycardia as constructed from time measurements of the action potentials of 94 different myofibers. The impulse is continuously rotating in a clockwise direction with a revolution time of 105 ms. At the left are shown the transmembrane potentials of five fibers which lie along the circular pathway (A-E). The moments of depolarization, in ms, are given together with the action potentials and the isochronal lines of the map. Used with permission.18
It is possible that reentry could occur in the thin endocardial layer of Purkinje fibers where it could be missed by plunge needles or optrode recordings and give rise to a focal pattern in the sensor recordings from the working myocardium in which earliest activation would be at the Purkinje-myocardial junction where the activation in the Purkinje system propagated into the working myocardium.
Figure-of-eight Reentry
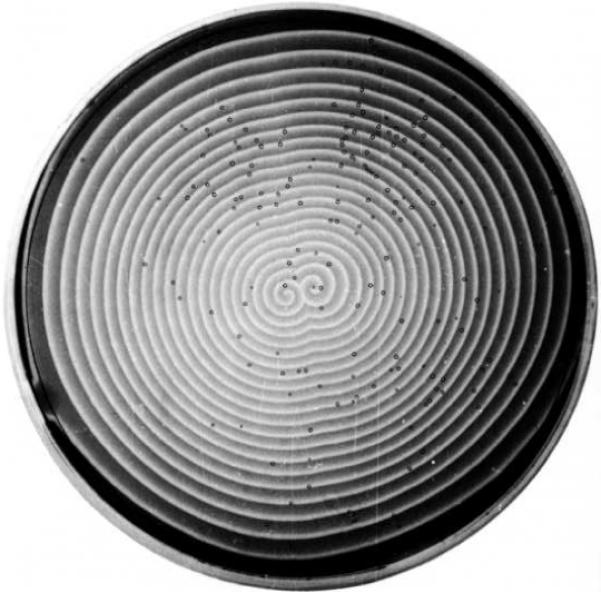
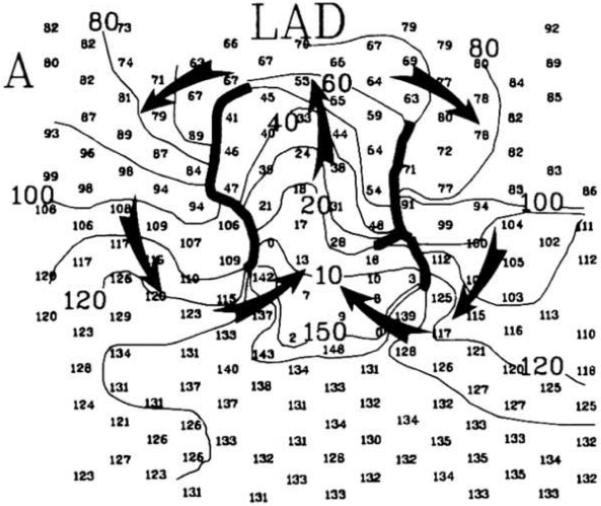
In certain chemical media, such as that shown in the dish in Figure 3, a pair of rotors, i.e., figure-of-eight reentry can form. At points more than about two revolutions from the paired rotors the spreading chemical reaction appears circular. Therefore, if sensors are spaced more widely than the distance between the centers of the paired rotors, then the pattern would look as if it were arising from a focus. The spatial dynamical properties of the heart are different than those in the chemical media, so that multiple turns of the spiral as seen in Figure 3 do not occur in the heart. The number of rotations that can physically fit on the heart is between one and two.14 In addition, the minimum distance observed between the centers of the two reentrant circuits in figure-of-eight reentry that has been mapped experimentally is approximately 10 mm (Figure 4).15 Mapping with electrical or optical sensors a few mm apart should be able to detect figure-of-eight reentry of this size and distinguish it from a focus.
Figure 3.

Mirror-image spirals in a chemical medium. At a distance of more than approximately two revolutions of the spiral, which is approximately equal to the distance between the centers of the two spirals, the pattern appears circular, as if arising from a focus. Used with permission.19
Figure 4.

Figure-of-eight reentry in the epicardial border zone of a four-day-old infarct mapped with electrodes 2 mm apart. The smaller numbers give the activation time in ms at each electrode for one cycle of reentry. Isochronal lines are spaced every 10 ms and are labeled with the activation time. Heavy black lines indicate the location of conduction block. The arrows indicate the direction of activation of the two mirror-image reentrant circuits. Note that the two centers of the reentrant circuits are approximately 10 mm apart. Modified with permission from Waldecker et al.20
Theoretical analysis suggests that the minimum distance between the centers of the two rotors in figure-of-eight reentry may be smaller than 10 mm. In two dimensions, the minimum distance between the tips of the two wavefronts of a rotor pair is related to the concept of liminal area. At one point in the reentry cycle, a single, nearly straight wavefront will connect the two tips. For propagation to continue, the depolarized tissue in this wavefront must be large enough to depolarize downstream tissue. The situation is similar to a wavefront propagating through a narrow isthmus - if the isthmus is too small, propagation will fail. In experiments on isolated slices of sheep ventricular tissue, at normal pacing rates, propagation fails for isthmuses less than approximately 1 mm.16 However, as the pacing rate increased, reducing tissue excitability, the critical isthmus width also increases. At rates similar to a typical rotor period (117 ms) the critical isthmus width is greater than 2.5 mm. The minimum rotor separation should be approximately the same. Because the maximum sensor separation that can identify two rotors is less than the distance between the rotors, a sensor spacing of less than 2.5 mm is needed to differentiate these two rotors from a focus.
Clinical Differentiation of Focal and Microreentrant Activation
The above considerations suggest that mapping can identify a true focus and not confuse it with microreentry if the spacing between optical or electrical sensors is less than a certain distance, which is approximately 2 mm. Although this spacing is feasible in basic experimental studies, it may not always be so during the clinical mapping of arrhythmias. In this case, ancillary information has been used to help differentiate focal from reentrant activation.17
Acknowledgements
The authors wish to thank Mrs. Brenda Dudley and Ms. Kate Sreenan for their assistance in the preparation of the manuscript.
This work was supported by National Institutes of Health grants HL-28429, HL-46929, HL-66256, and HL-85370
Footnotes
Publisher's Disclaimer: This is a PDF file of an unedited manuscript that has been accepted for publication. As a service to our customers we are providing this early version of the manuscript. The manuscript will undergo copyediting, typesetting, and review of the resulting proof before it is published in its final citable form. Please note that during the production process errors may be discovered which could affect the content, and all legal disclaimers that apply to the journal pertain.
REFERENCES
- 1.Pogwizd SM. Nonreentrant mechanisms underlying spontaneous ventricular arrhythmias in a model of nonischemic heart failure in rabbits. Circulation. 1995;92(4):1034–1048. doi: 10.1161/01.cir.92.4.1034. [DOI] [PubMed] [Google Scholar]
- 2.Li L, Jin Q, Huang J, Cheng KA, Ideker RE. Intramural foci during long duration fibrillation in the pig ventricle. Circ Res. 2008;102(10):1256–1264. doi: 10.1161/CIRCRESAHA.107.170399. [DOI] [PMC free article] [PubMed] [Google Scholar]
- 3.de Bakker JM, van Capelle FJ, Janse MJ, Tasseron S, Vermeulen JT, de Jonge N, et al. Slow conduction in the infarcted human heart. ‘Zigzag’ course of activation. Circulation. 1993;88(3):915–926. doi: 10.1161/01.cir.88.3.915. [DOI] [PubMed] [Google Scholar]
- 4.Mandapati R, Skanes A, Chen J, Berenfeld O, Jalife J. Stable microreentrant sources as a mechanism of atrial fibrillation in the isolated sheep heart. Circulation. 2000;101(2):194–199. doi: 10.1161/01.cir.101.2.194. [DOI] [PubMed] [Google Scholar]
- 5.Hill BC, Courtney KR. Design of a multi-point laser scanned optical monitor of cardiac action potential propagation: Application to microreentry in guinea pig atrium. Ann. Biomed. Eng. 1987;15:567–577. doi: 10.1007/BF02364249. [DOI] [PubMed] [Google Scholar]
- 6.Richards DA, Blake GJ, Spear JF, Moore EN. Electrophysiologic substrate for ventricular tachycardia: Correlation of properties in vivo and in vitro. Circulation. 1984;69:369–381. doi: 10.1161/01.cir.69.2.369. [DOI] [PubMed] [Google Scholar]
- 7.Boersma L, Brugada J, Kirchhof C, Allessie M. Entrainment of reentrant ventricular tachycardia in anisotropic rings of rabbit myocardium: Mechanisms of termination, changes in morphology, and acceleration. Circulation. 1993;88(part 1):1852–1865. doi: 10.1161/01.cir.88.4.1852. [DOI] [PubMed] [Google Scholar]
- 8.Kirchhof C, Chorro F, Scheffer GJ, et al. Regional entrainment of atrial fibrillation studied by high-resolution mapping in open-chest dogs. Circulation. 1993;88:736–749. doi: 10.1161/01.cir.88.2.736. [DOI] [PubMed] [Google Scholar]
- 9.Brugada J, Boersma L, Abdollah H, Kirchhof C, Allessie M. Echo-wave termination of ventricular tachycardia A common mechanism of termination of reentrant arrhythmias by various pharmacological interventtions. Circulation. 1992;85:1879–1887. doi: 10.1161/01.cir.85.5.1879. [DOI] [PubMed] [Google Scholar]
- 10.Downar E, Harris L, Mickleborough LL, Shaikh N, Parson ID. Endocardial mapping of ventricular tachycardia in the intact human ventricle: Evidence for reentrant mechanisms. J Am Coll Cardiol. 1988;11:783–791. doi: 10.1016/0735-1097(88)90212-4. [DOI] [PubMed] [Google Scholar]
- 11.Spach MS, Dolber PC, Heidlage JF. Influence of the passive anisotropic properties on directional differences in propagation following modification of the sodium conductance in human atrial muscle: A model of reentry based on anisotropic discontinuous propagation. Circ Res. 1988;62(4):811–832. doi: 10.1161/01.res.62.4.811. [DOI] [PubMed] [Google Scholar]
- 12.Zuanetti G, Hoyt RH, Corr PB. ß-Adrenergic-mediated influences on microscopic conduction in epicardial regions overlying infarcted myocardium. Circ Res. 1990;67:284–302. doi: 10.1161/01.res.67.2.284. [DOI] [PubMed] [Google Scholar]
- 13.Allessie MA, Bonke FI, Schopman FJ. Circus movement in rabbit atrial muscle as a mechanism of tachycardia. III. The “leading circle” concept: a new model of circus movement in cardiac tissue without the involvement of an anatomical obstacle. Circ Res. 1977;41(1):9–18. doi: 10.1161/01.res.41.1.9. [DOI] [PubMed] [Google Scholar]
- 14.Lou Q, Ripplinger CM, Bayly PV, Efimov IR. Quantitative panoramic imaging of epicardial electrical activity. Ann Biomed Eng. 2008;36(10):1649–1658. doi: 10.1007/s10439-008-9539-3. [DOI] [PMC free article] [PubMed] [Google Scholar]
- 15.Waldecker B, Coromilas J, Saltman AE, Dillon SM, Wit AL. Overdrive stimulation of functional reentrant circuits causing ventricular tachycardia in the infarcted canine heart: resetting and entrainment. Circulation. 1993;87:1286–1305. doi: 10.1161/01.cir.87.4.1286. [DOI] [PubMed] [Google Scholar]
- 16.Cabo C, Pertsov AM, Baxter WT, Davidenko JM, Gray RA, Jalife J. Wavefront curvature as a cause of slow conduction and block in isolated cardiac muscle. Circ Res. 1994;75(6):1014–1028. doi: 10.1161/01.res.75.6.1014. [DOI] [PubMed] [Google Scholar]
- 17.Haissaguerre M, Hocini M, Sanders P, et al. Localized sources maintaining atrial fibrillation organized by prior ablation. Circulation. 2006;113(5):616–625. doi: 10.1161/CIRCULATIONAHA.105.546648. [DOI] [PubMed] [Google Scholar]
- 18.Allessie MA, Bonke FIM, Schopman FJG. Circus movement in rabbit atrial muscle as a mechanism of tachycardia: III. The “leading circle” concept: A new model of circus movement in cardiac tissue without the involvement of an anatomical obstacle. Circ Res. 1977;41:9–18. doi: 10.1161/01.res.41.1.9. [DOI] [PubMed] [Google Scholar]
- 19.Winfree AT. When time breaks down: The three-dimensional dynamics of electrochemical waves and cardiac arrhythmias. Princeton University Press; Princeton, NJ: 1987. pp. 154–186. [Google Scholar]
- 20.Waldecker B, Coromilas J, Saltman AE, Dillon SM, Wit AL. Overdrive stimulation of functional reentrant circuits causing ventricular tachycardia in the infarcted canine heart. Resetting and entrainment. Circulation. 1993;87(4):1286–1305. doi: 10.1161/01.cir.87.4.1286. [DOI] [PubMed] [Google Scholar]


