Abstract
We present a single-cell motility assay, which allows the quantification of bacterial swimming in a well-controlled environment, for durations of up to an hour and with a temporal resolution higher than the flagellar rotation rates of ~100 Hz. The assay is based on an instrument combining optical tweezers, light and fluorescence microscopy, and a microfluidic chamber. Using this device we characterized the long-term statistics of the run-tumble time series in individual Escherichia coli cells. We also quantified higher-order features of bacterial swimming, such as changes in velocity and reversals of swimming direction.
INTRODUCTION
Many microorganisms move around by swimming in liquid medium, and can modulate their swimming behavior in order to move up gradients of chemicals, temperature, or light. In liquid environments, Escherichia coli swims in a random pattern composed of “runs”, in which the cell maintains an approximately constant direction, and “tumbles”, in which it stops and randomly changes direction1. Runs and tumbles are generated by different states of the motors that rotate the bacterial flagella. Each cell has several flagellar motors that can rotate either clockwise (CW) or counterclockwise (CCW). When the motors turn CCW, the flagella rotate together in a bundle and push the cell forward. When one or more of the motors turn CW, some flagella may break from the bundle and cause the cell to tumble and randomize its orientation. During chemotaxis, E. coli biases its “random walk” based on temporal changes in chemical concentration. When the bacterium moves up a gradient of attractant it detects an increase in attractant concentration, and reduces its probability of tumbling. The result is that the cell tends to continue going up the gradient.
The modulation of bacterial swimming serves as a model system for the way a living cell processes signals from its environment and changes its behavior based on those signals1,2. Standard methods for assaying bacterial swimming and chemotaxis typically fall into two categories. The first consists of observing freely swimming cells, typically in a flow-cell setup. Chemoeffector]variation is created in space or time3–5, and the change in swimming behavior is then examined6,7. The second type of assay uses cells that are tethered to a surface—usually a microscope slide—so that the rotation of an individual flagellar motor can be followed8,9.
The approaches above have enabled the acquisition of large amounts of data that have yielded important insights into bacterial swimming and its modulation. However, both assays are limited in their ability to quantify whole-cell swimming, as discussed in Supplementary Note 1. In this paper we describe the development of an optical-trap based assay to investigate cell motility. This assay allowed us to quantify bacterial swimming in a well-controlled environment for durations up to 1 hour and at data acquisition rates that are faster than the ~100 Hz flagellar rotation rates. We were thus able to characterize the long-term statistics of the run-tumble time series in individual cells. Moreover, we were able to characterize higher-order features of bacterial swimming, such as changes in velocity and reversals of swimming direction.
RESULTS
Experimental setup
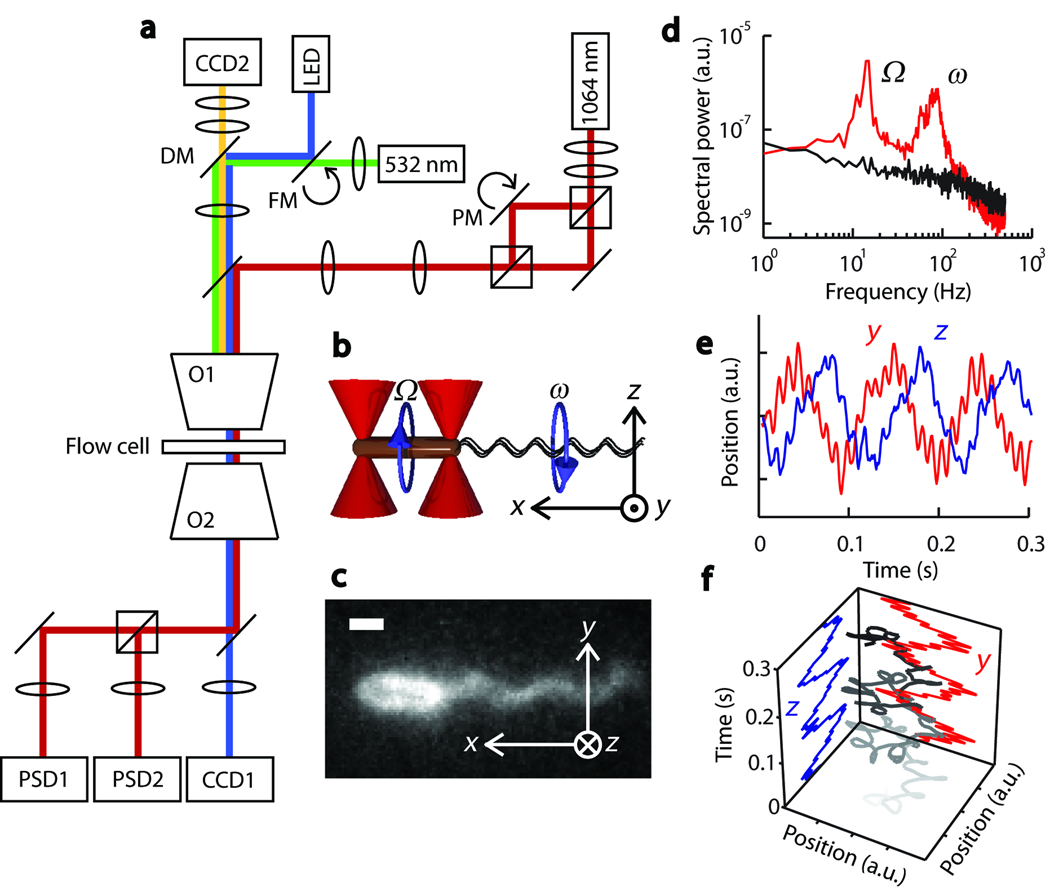
Our single-cell motility assay involves a custom-made instrument combining optical tweezers, light and fluorescence microscopy, and a microfluidic chamber (Fig. 1a). The optical tweezers consist of two traps generated by two orthogonally polarized beams from a single 1064-nm diode-pumped solid-state laser10. The separation between the two traps is controlled by a piezo-actuated mirror stage. A custom flow-cell (Supplementary Fig. 1; see also Online Methods) serves as the experimental trap chamber, and can be displaced relative to the two traps in all directions by a three-axis translational stage. For measurements of bacterial motility, the chambers were filled with a tryptone broth-based “trapping medium”, though other buffers are also appropriate (see Online Methods). Bacteria were injected into a top “antechamber” and flowed through a narrow inlet into the bottom channel, where they were captured by the traps. Trapping a rod-shaped bacterium by each end with two optical traps11 allowed us to orient the cell at will in the plane of the chamber (Figure 1b). Trapped bacteria were visualized either by brightfield or epifluorescence microscopy (Fig. 1c; see also Online Methods). [
Figure 1.
Combined optical trap and fluorescence microscope setup. (a) Instrument layout showing the trapping beam (red), LED illumination path for brightfield imaging (blue), fluorescence excitation beam (green), fluorescence emission (yellow), piezo-actuated mirror (PM), flip-mount mirror (FM), dichroic mirror (DM), microscope objectives (O1 & 2), position sensitive detectors (PSD1 & 2), and chargecoupled device cameras (CCD1 & 2). (b) Schematic showing optical traps (red cones) and a trapped cell. Circular arrows indicate the rotational direction of the cell body (brown cylinder) and the flagellar bundle (black wavy lines). Also shown is the coordinate axis notation for the optical trap signal. (c) Fluorescence image of a Cy3-labeled, optically trapped cell. (d) Power spectrum of the optical trap signal from a swimming (red), and a non-motile (black) cell. Swimming cell signal shows oscillatory peaks at 10 Hz and 100 Hz corresponding to body roll (Ω) and flagellar bundle rotation (ω) frequencies, respectively. (e) Typical optical trap signal of a swimming cell along the y (red) and z (blue) directions. (f) 3-D plot (grayscale line) of the swimming cell signal. Gray color darkens with time. Rotational motion of the cell body (large radius rotations) and the flagellar bundle (small radius rotations) are easily recognizable. Scale bar: 1 µm (c).
Despite immobilization by the optical traps, cells displayed motile behavior, evinced by flagellar bundle rotation and counter-rotation (“rolling”) of the cell body12. This behavior was detected directly and sensitively by the optical traps themselves, by imaging light from both orthogonally polarized trapping beams onto two separate position-sensitive photodetectors (PSD). Consistent with previous reports on optically-trapped cells12,13, power spectra from the PSD outputs upon trapping of a swimming cell revealed two peaks with frequencies ω ≈ 100 and Ω ≈ 10 Hz (Fig. 1d). These oscillatory signals correspond to flagellar bundle rotation and cell body counter-rotation or “roll”12,13, respectively (Fig. 1b). Our measured flagellar rotation (ω) and body-roll rates (Ω) are consistent with those observed in experiments with freely swimming cells14, demonstrating that the optical traps did not inhibit motility other than in fixing the cell’s position. Although cell swimming was not observed directly, these oscillation frequencies provide information on the motile behavior of the cell (see Supplementary Note 2).
In a typical experiment, we trapped an E. coli cell (strain RP437, wild-type for chemotaxis15) horizontally, defined as x in Fig. 1b. The motion of each trapped end in the orthogonal plane, along the vertical direction (y) and along the optical axis (z), was detected by one PSD and revealed both frequencies of oscillation (Fig. 1e). The y and z components of the low-frequency signal are 90° out of phase, indicating that the cell end moved in a circular trajectory perpendicular to its body axis (Fig. 1f). The rotation is clockwise, as measured looking at the tail of the cell in the direction of swimming, consistent with the expected direction of body roll1. The higher-frequency oscillatory signal corresponding to flagellar bundle rotation also reveals a circular motion, in the counterclockwise direction, as expected (Fig. 1f).
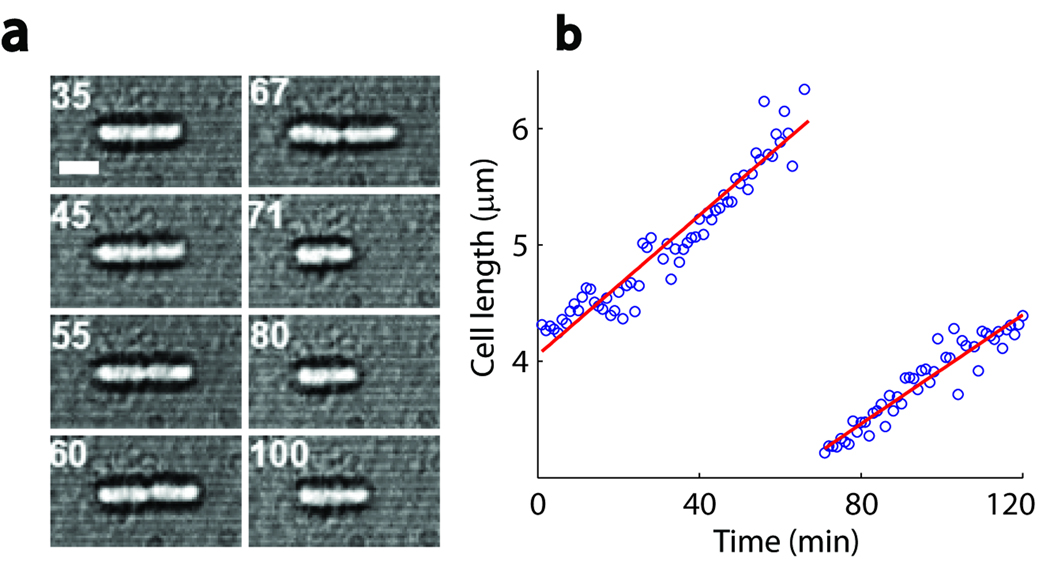
Of primary importance to our work is characterizing the health of the optically-trapped cells. The high photon-flux at near-infrared wavelengths generated by the optical traps has been shown to induce photodamage in cells16,17. As demonstrated previously16, this damage can be largely mitigated by trapping cells under reduced oxygen conditions, for instance by use of an oxygen-scavenging system. We optimized conditions to enhance cell viability in our trap (Online Methods). Under our tryptone broth-based “trapping medium” (with oxygen scavenger), we found that trapped E. coli cells displayed healthy behavior, growing and dividing at a rate comparable to standard values from the literature (~2 h generation time at room temperature18) (Supplementary Figure 2). Furthermore, swimming could be followed in individual cells for extended periods of time (up to ~1 hour, data not shown). Our trapping protocol constitutes a substantial improvement over a previously reported trap-based study of bacterial swimming under oxygenated conditions19, where cells could be monitored only for very short times (< 10 s).
Observation of single-cell run-tumble behavior
Closer examination of swimming traces revealed regions of alternating oscillatory and non-oscillatory (“erratic”) signals (compare 1–1.5 s and 1.5–2 s regions in Fig. 2b; only the low-frequency component corresponding to body roll is shown for clarity. [). By imaging the motion of a Cy3-labeled cell using epifluorescence microscopy and simultaneously monitoring the trap signals generated by this motion, we established that these oscillatory and erratic signals correspond to runs and tumbles of the cell, respectively. Cell images taken during oscillatory periods (1.2 s, 2.2 s, 2.7 s, 3.2 s) display a well-formed flagellar bundle extending from the tail of the cell as expected for a run, whereas those taken during erratic periods (1.7 s) exhibit a disrupted bundle, indicative of a tumbling conformation20 (Figure 2a).
Figure 2.
Direct observation of tumbles in an optically trapped cell. (a) Fluorescence images of a trapped cell. Shown in the first frame (1.2 s) is the trapped cell body (bright oval shape) and the flagellar bundle (faint cloud) formed to the left of the cell body. The second frame (1.7 s) shows the cell tumbling, with the appearance of a disrupted flagellar bundle. Subsequent frames show the reformed flagellar bundle and the running cell. Each frame was obtained by averaging three successive images collected at a rate of 10 Hz, with the marked time point in the middle. (b) Optical trap signals in the y (red) and z (blue) directions, recorded simultaneously with the fluorescence images. Black lines are drawn as a guide to the eye.
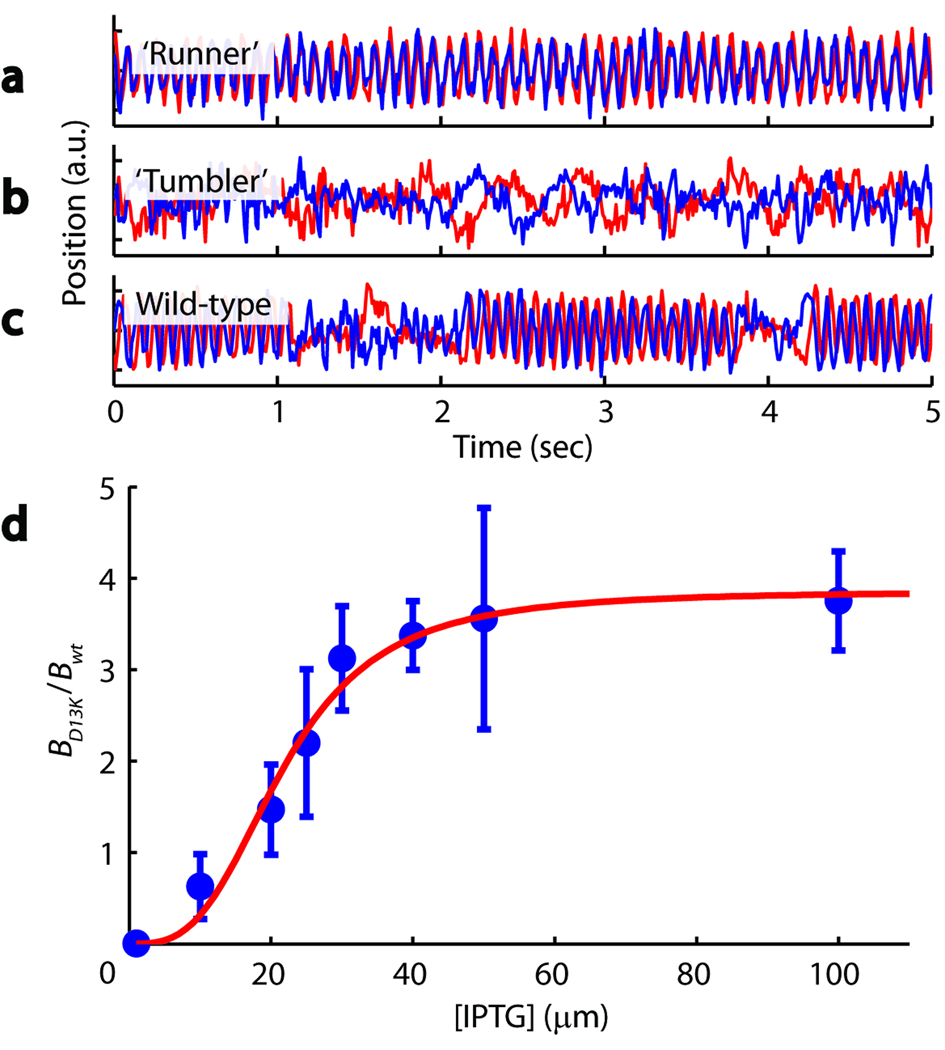
To ascertain that the observed run-tumble behavior in trapped cells is physiologically relevant and rule out the possibility of an artifact induced by the optical traps, we performed two control experiments. In the first, we examined the motility of two mutant strains: a cheY deletion (strain CR20; see Supplementary Table 1 for list of strains used in this study), which does not tumble, and a cheZ deletion (strain CR33), which mostly tumbles and does not run. As shown in Figure 3a–c, data traces obtained from these mutants display the expected phenotypes: “runners” generate prolonged oscillatory signals, whereas “tumblers” undergo continuous erratic motion. In the second control experiment, we quantified the run-tumble behavior of strain PS2001-pMS16421, in which a permanently active CheYD13K mutant protein is expressed from an inducible promoter, under the control of isopropyl β-D-1-thiogalactopyranoside (IPTG). This strain allowed us to modulate run-tumble statistics and to compare them to those obtained with our wild-type strain.
Figure 3.
Run-tumble phenotyping using the optical trapping assay. (a) A ‘runner’ mutant generates predominantly oscillatory signals. (b) A ‘tumbler’ mutant generates predominantly erratic signals. (c) A wild-type cell generates oscillatory signals interrupted by intermittent erratic signals. (d) Induction response of the PS2001-pMS164 strain (blue data points). The response to induction is defined as the average tumble bias BD13K of individually trapped cells at various levels of induction, normalized by the average tumble bias of wild-type cells Bwt. Higher CheYD13K levels increase the probability of tumbling. Mean ± s.e.m. is shown (n = 6, 8, 8, 5, 13, 4, 3, 6, from lowest to highest [IPTG]). Fitting to Hill function gives a Hill coefficient of ~3 (red line).
To quantify the swimming behavior of optically-trapped cells, we developed an automated run-tumble detection routine using the continuous wavelet transform22 to discriminate regions of oscillatory and non-oscillatory behavior (Online Methods and Supplementary Fig. 3). For a data set of 43 wild-type cells constituting a total of 5,473 detected run events, our algorithm yielded an average run duration of 3.90 ± 0.30 s (mean ± s.e.m., n = 43), within the range of previously reported values (0.8–4 s)7,21,23. Analysis of 53 PS2001-pMS164 mutant cells at various induction levels revealed that, as expected, run durations are longer than in wild-type cells at low (1 µM) IPTG concentrations and shorter at high (100 µM) IPTG concentrations. As shown in Figure 3d, the tumble bias B—defined as the fraction of time the cell spends tumbling, B = ttum/(ttum+trun)—exhibits a sigmoidal response to IPTG. The midpoint of the response is at ~20 µM and the enhancement in bias relative to wild-type cells is a factor of ~4. This behavior is in good agreement with the literature21, further confirming our view that tumbles exhibited by trapped E. coli represent physiologically relevant events. We note, however, that trapped cells exhibited longer tumble durations than observed in free swimming cells (see Supplementary Note 3).
Single-cell statistics of motility parameters
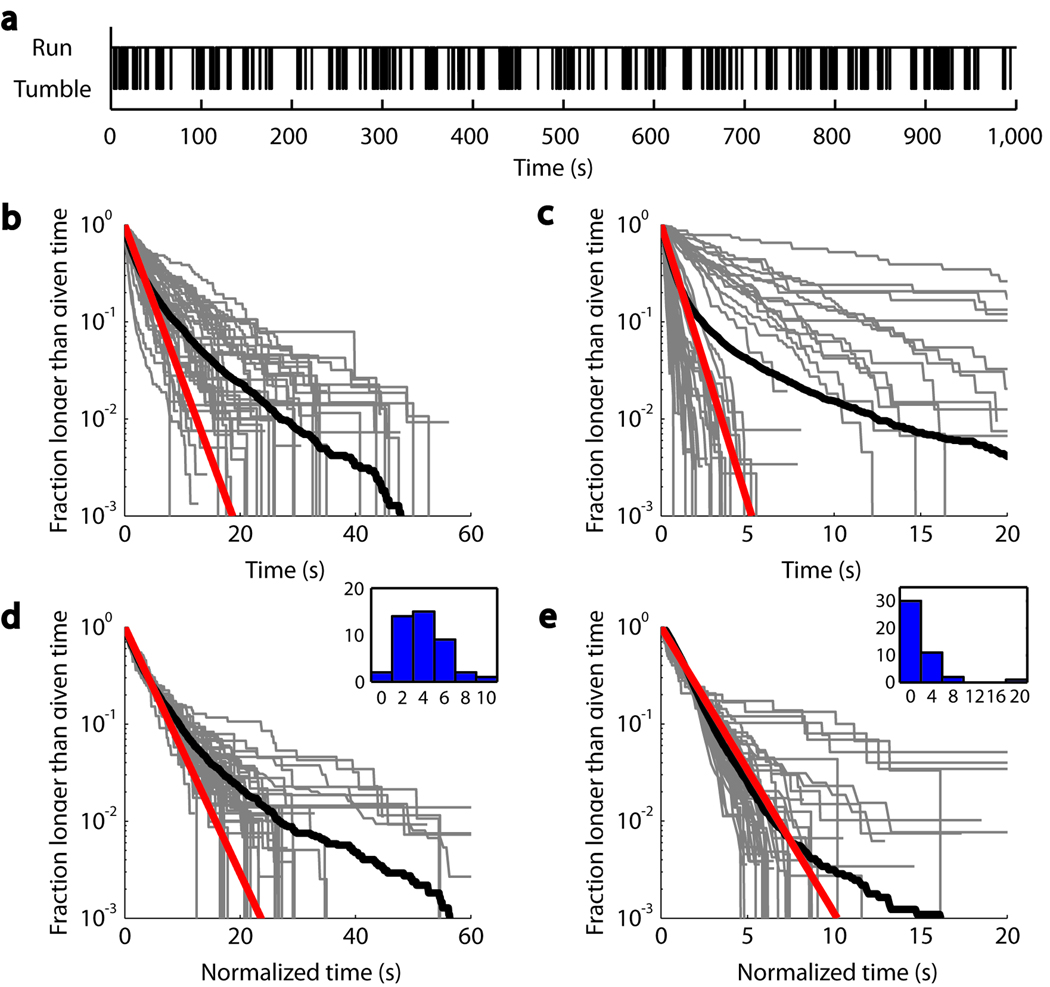
The ability to track an individual bacterium for an extended time period (Fig. 4a) allowed us to extract single-cell distributions of motility parameters. We determined the cumulative run duration distributions for 43 individual wild-type and 44 individual PS2001-pMS164 cells at a range of induction levels (Figures 4b and 4c; similar cumulative distributions for the tumble duration are shown in Supplementary Fig. 4a–d). Single-cell distributions are predominantly exponential but also display significant cell-to-cell variability. To determine more accurately the shape of the distributions, we normalized each curve by the individual-cell mean run duration (as determined by an exponential fit) along the time axis, maximizing the overlap of the individual distributions7 (Figures 4d and 4e).
Figure 4.
Run duration statistics in individual bacteria. (a) A typical binary time series generated from the swimming signal of a single trapped cell. (b) Cumulative distribution of run durations in wild-type cells. Each gray line shows the fraction of runs observed from a single cell that are longer than a given time. The thick black line is the population ensemble, comprising 5,473 runs observed from 43 wild-type cells. The red line is an exponential fit to the first decade of the ensemble distribution. (c) Same as b, from 44 inducible-bias mutants that showed 20 or more runs (total of 7,317 runs). (d) Same as b, except that individual run duration distributions were scaled so that the mean run duration equals the ensemble mean. This scaling procedure collapses data by effectively removing individual variability, thus revealing the underlying universal behavior in the population ensemble. (Inset) Histogram of mean tumble durations used in scaling. (e) Same as d, for the inducible bias mutant.
By pooling all the normalized data, we were able to characterize the “average” single-cell run duration distribution (solid black lines, Fig. 4d and 4e). Both wild-type and PS2001-pMS164 strains display exponential distributions at short times, but the former additionally exhibited a pronounced “heavy tail” corresponding to very long runs, which was much smaller in the mutant strain. The curves for individual wild-type cells further indicate that very long runs are taken in the majority of cells, rather than in a few outliers. Interestingly, this behavior matches that previously reported in single-motor tethered cell studies24 and may similarly represent the inherent stochasticity in the chemotactic signaling pathway in wild-type cells. Such a degree of stochasticity is not present in the PS2001-pMS164 strain, where the concentration of signaling protein CheYD13K is externally controlled. The ability to collect sufficient statistics from individual trapped bacteria provides information not available in population distributions. Note that taking the population averages of the single-cell distributions in Figures 4b prior to normalization does not give an accurate representation of the average distribution (compare solid black lines in Fig. 4b and 4d), emphasizing the importance of collecting single-cell statistics.
Higher-order features in cell motility
Our preceding analysis of trapped cells characterized their motility in terms of the standard two-state, “run-tumble” picture. Yet, this abstraction of cell swimming is only a first approximation. Researchers in the field have already pointed to aspects of movement beyond this approximation, including changes in cell velocity after a tumble7, reversal of swimming direction when the flagellar bundle changes its orientation25,26 and changes in motor and swimming velocity as a function of multiple physiological and mechanical factors6,13. Most of these observations, however, were sporadic in nature, limited by the noise or short time duration of available techniques.
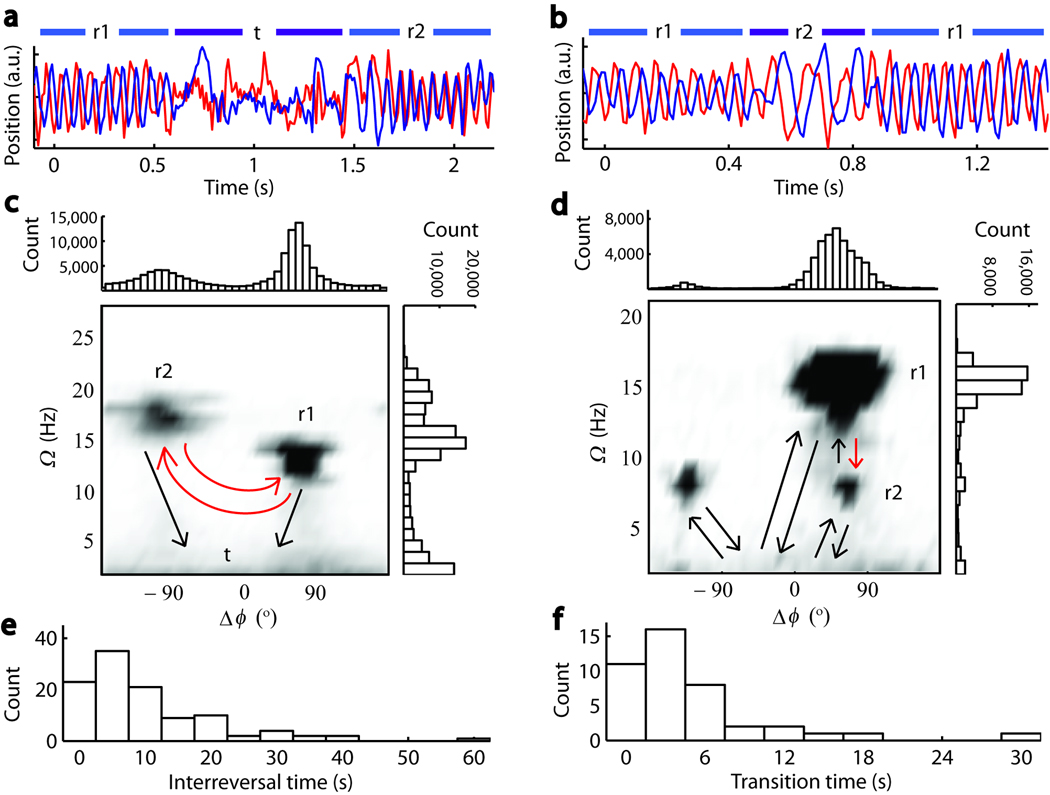
Swimming traces collected by our technique also exhibited “higher order” swimming dynamics, in particular reversals in phase difference between y and z signals (compare r1 and r2 in Fig. 5a), indicating reversals in swimming direction (as established in the fluorescence images of Supplementary Fig. 5) and changes in oscillation frequency (compare r1 and r2 in Fig. 5b), corresponding to changes in swimming speed14,19. To fully analyze such higher-order behavioral patterns, we used the continuous wavelet transform to determine not only the body roll frequency Ω but also the phase difference Δϕ between y and z signals at every point in time (Supplementary Fig. 6).
Figure 5.
Higher-order features in cell motility. (a) y-dimension (red) and z-dimension (blue) signals showing a reversal in run direction (periods designated r1, r2) following a tumble (designated t). (b) y-dimension (red) and z-dimension (blue) signals showing change in Ω (r2) in the middle of a run (r1). (c, d) Images are 2-D histograms of body roll frequency (Ω) and phase difference between swimming signals in y and z dimensions (Δϕ). All possible transitions between different swimming modes are marked by arrows. (e, f) Waiting time distributions for the transitions highlighted by red arrows in c and d. Data for a, c, and e are from the same cell, and data for b, d, and f from another cell.
Two-dimensional histograms in Ω and Δϕ for two representative cells are shown in Figures 5c and 5d. The majority of trapped wild-type cells (42 of 43 cells) exhibited reversals, illustrated by the two peaks along the horizontal Δϕ axis in the histograms. Reversals occurred frequently (an average of 21 reversal events were detected per time trace) and exclusively after the cell tumbles, on average one out of every 6 tumbles, or every 21.2 ± 1.1 s (mean ± s.e.m., n = 859) (the distribution of inter-reversal durations for a typical cell is shown in Fig. 5e). In certain cases (29 of 42 reversing cells), reversals were also accompanied by an observable change in body-roll rate Ω (Fig. 5c), and thus presumably swimming speed. Interestingly, a similar analysis on the flagellar bundle rotation signal indicated no corresponding changes in rotation rate ω in the majority of cells (data not shown). These observations suggest that reversals may play an important role in the motility of cells. This matter is further discussed in Supplementary Note 4 (see also Supplementary Fig. 7).
Occasionally (in 6 of 42 cells), cells exhibited noticeable, discrete changes in body roll rate with no corresponding change in swimming direction (illustrated in the two peaks along the vertical Ω axis in the histograms, Fig. 5d). Changes in speed occurred both spontaneously, without tumbling (69.5%) as shown in the time trace Figure 5b, or following a tumble (30.5%). Furthermore, the flagellar bundle exhibited no corresponding changes in rotation rate ω (data not shown). These observations suggest that speed changes may represent different conformational states of the flagellar bundle (see Supplementary Note 5).
In addition to these higher order features, many cells exhibited asymmetric Δϕ distributions (Fig. 5c and 5d), indicating a bias in swimming direction. While we found no preferred swimming direction in the cell population, reflecting the fact that our traps do not impose directionality, many individual bacteria do display a statistically significant bias (see Supplementary Note 6).
DISCUSSION
Over the last half century, tremendous progress has been made towards understanding bacterial motility and chemotaxis. This progress has been achieved by a combination of traditional biological tools such as genetics and biochemistry and quantitative methods from the physical sciences, both experimental7,27–29 and theoretical30. Despite these advances, measurement techniques have so far exhibited a limited ability to probe and collect statistics on bacterial swimming at the level of the whole cell. Here, our optical-trap assay offers a measurement tool for quantifying the long-term behavior of individual swimming cells. By limiting the physical translocation of the bacterial cell while at the same time allowing high-accuracy measurement of its rotational motion, we were able to follow bacterial swimming for long periods of time with high temporal resolution. The extensive run-tumble statistics thus collected from individual cells expand the range of measured distributions by over an order of magnitude over previous studies7. As an example of the consequences of this advance, our wild-type cell run distributions now reveal, for the first time, a pronounced tail similar to that observed in individual flagellar motors24. These findings suggest that stochastic variation in the levels of chemotactic proteins is manifested in the long-term run-tumble behavior of swimming cells.
With our technique we investigated cell swimming beyond the classical, binary run-tumble picture, and quantified the statistics of cell reversals, changes in swimming speed, and direction bias. While these features are unique to the swimming behavior of the whole cell (not revealed at the single flagellar motor level), they may also provide insight into the relationship of individual flagella and whole cell swimming phenotypes. For example, cell reversals may reflect tumbling states in which multiple flagella rotate CW and disrupt the flagellar bundle. Tumbles involving a single flagellum are unlikely to induce reversals, as a partial bundle is likely to persist and bias the cell’s direction during such tumbles14. Changes in swimming speed and bias in swimming direction may similarly reflect different states or spatial arrangements of the flagella.
This technique will be well-suited to investigate chemotaxis in individual cells. A critical requirement for a quantitative characterization of cell chemotactic response is the ability to create an arbitrary stimulus, in the form of spatiotemporally varying chemoeffector concentrations, and to follow the response of the cell in terms of its swimming behavior as well as changes in intracellular parameters such as gene expression. Possible approaches towards achieving this goal are described in Supplementary Note 7. These advances will enable the development of an integrated device to quantify whole-cell swimming and chemotactic response.
Supplementary Material
Figure 6.
ACKNOWLEDGMENTS
We are grateful to the following people for supplying us with reagents, and for their generous advice: Philippe Cluzel (Harvard University), Calin Guet (Harvard University), Heungwon Park (Harvard University), Michael McLachlan (University of Illinois), Keir Neuman (National Institutes of Health), Suddhashil Chattopadhyay (Penn State University), William Ryu (University of Toronto), Tom Shimizu (AMOLF), Ronen Segev (Ben Gurion University), George Ordal (University of Illinois), Ilya Nemenman (Los Alamos National Laboratory), Thierry Emonet (Yale University) and all members of the Golding, Chemla, Rao, Selvin and Ha labs. The work was supported by the National Science Foundation under Grant No. 082265, PFC: Center for the Physics of Living Cells. YRC is supported by Burroughs-Wellcome Fund - Career Awards at the Scientific Interface. TLM was supported by NIH Institutional NRSA in Molecular Biophysics PHS 5 T32 GM08276. CVR is supported by NIH Grant GM054365.
Footnotes
AUTHOR CONTRIBUTIONS
YRC and IG conceived the cell-trapping project. TLM developed the cell-trapping assay. TLM and PJM developed the measurement protocols, performed the experiments and analyzed the data. LMC and CVR constructed and tested bacterial strains used in this study. CVR provided expertise on bacterial physiology and chemotaxis. PJM, TLM, IG and YRC wrote the paper.
REFERENCES
- 1.Berg HowardC. E. coli in motion. New York: Springer; 2004. [Google Scholar]
- 2.Alon Uri. An introduction to systems biology : design principles of biological circuits. Boca Raton, FL: Chapman & Hall/CRC; 2007. [Google Scholar]
- 3.Brown DA, Berg HC. Proc Natl Acad Sci U S A. 1974;71(4):1388. doi: 10.1073/pnas.71.4.1388. [DOI] [PMC free article] [PubMed] [Google Scholar]
- 4.Khan S, et al. Biophysical Journal. 1993;65(6):2368. doi: 10.1016/S0006-3495(93)81317-1. [DOI] [PMC free article] [PubMed] [Google Scholar]
- 5.Block SM, Segall JE, Berg HC. Cell. 1982;31(1):215. doi: 10.1016/0092-8674(82)90421-4. [DOI] [PubMed] [Google Scholar]
- 6.Staropoli JF, Alon U. Biophysical Journal. 2000;78(1):513. doi: 10.1016/S0006-3495(00)76613-6. [DOI] [PMC free article] [PubMed] [Google Scholar]
- 7.Berg HC, Brown DA. Nature. 1972;239(5374):500. doi: 10.1038/239500a0. [DOI] [PubMed] [Google Scholar]
- 8.Silverman M, Simon M. Nature. 1974;249(452):73. doi: 10.1038/249073a0. [DOI] [PubMed] [Google Scholar]
- 9.Sowa Y, et al. Nature. 2005;437(7060):916. doi: 10.1038/nature04003. [DOI] [PubMed] [Google Scholar]
- 10.Bustamante C, Chemla YR, Moffitt JR. In: High resolution dual trap optical tweezers with differential detection, in Single-Molecule Techniques: A Laboratory Manual. Selvin P, Ha TJ, editors. Cold Spring Harbor, N.Y.: Cold Spring Harbor Laboratory Press; 2008. [Google Scholar]
- 11.Ashkin A, Dziedzic JM, Yamane T. Nature. 1987;330(6150):769. doi: 10.1038/330769a0. [DOI] [PubMed] [Google Scholar]
- 12.Rowe AD, Leake MC, Morgan H, Berry RM. J. Mod. Opt. 2003;50(10):1539. [Google Scholar]
- 13.Chattopadhyay S, Moldovan R, Yeung C, Wu XL. Proceedings of the National Academy of Sciences of the United States of America. 2006;103(37):13712. doi: 10.1073/pnas.0602043103. [DOI] [PMC free article] [PubMed] [Google Scholar]
- 14.Darnton NC, Turner L, Rojevsky S, Berg HC. J. Bacteriol. 2007;189(5):1756. doi: 10.1128/JB.01501-06. [DOI] [PMC free article] [PubMed] [Google Scholar]
- 15.Parkinson JS, Houts SE. J Bacteriol. 1982;151(1):106. doi: 10.1128/jb.151.1.106-113.1982. [DOI] [PMC free article] [PubMed] [Google Scholar]
- 16.Neuman KC, Chadd EH, Liou GF, Bergman K, Block SM. Biophysical Journal. 1999;77(5):2856. doi: 10.1016/S0006-3495(99)77117-1. [DOI] [PMC free article] [PubMed] [Google Scholar]
- 17.Rasmussen MB, Oddershede LB, Siegumfeldt H. Appl Environ Microbiol. 2008;74(8):2441. doi: 10.1128/AEM.02265-07. [DOI] [PMC free article] [PubMed] [Google Scholar]
- 18.Neidhardt FrederickC, Ingraham JohnL, Schaechter Moselio. Physiology of the bacterial cell : a molecular approach. Sunderland, Mass: Sinauer Associates; 1990. [Google Scholar]
- 19.Chattopadhyay S, Moldovan R, Yeung C, Wu XL. Proc Natl Acad Sci U S A. 2006;103(37):13712. doi: 10.1073/pnas.0602043103. [DOI] [PMC free article] [PubMed] [Google Scholar]
- 20.Turner L, Ryu WS, Berg HC. J. Bacteriol. 2000;182(10):2793. doi: 10.1128/jb.182.10.2793-2801.2000. [DOI] [PMC free article] [PubMed] [Google Scholar]
- 21.Alon U, et al. EMBO J. 1998;17(15):4238. doi: 10.1093/emboj/17.15.4238. [DOI] [PMC free article] [PubMed] [Google Scholar]
- 22.Misiti M, Misiti Y, Oppenheim G, Poggi J-M. Wavelet Toolbox for Use with MATLAB. Massachusetts: The MathWorks, Inc.; 1996. [Google Scholar]
- 23.Berg HC, Turner L. Proc Natl Acad Sci U S A. 1995;92(2):477. doi: 10.1073/pnas.92.2.477. [DOI] [PMC free article] [PubMed] [Google Scholar]
- 24.Korobkova E, Emonet T, Vilar JMG, Shimizu TS, Cluzel P. Nature. 2004;428(6982):574. doi: 10.1038/nature02404. [DOI] [PubMed] [Google Scholar]
- 25.Berg HC, Turner L. Proceedings of the National Academy of Sciences of the United States of America. 1995;92(2):477. doi: 10.1073/pnas.92.2.477. [DOI] [PMC free article] [PubMed] [Google Scholar]
- 26.Cisneros L, Dombrowski C, Goldstein RE, Kessler JO. Physical Review E. 2006;73(3) doi: 10.1103/PhysRevE.73.030901. [DOI] [PubMed] [Google Scholar]
- 27.Cluzel P, Surette M, Leibler S. Science. 2000;287(5458):1652. doi: 10.1126/science.287.5458.1652. [DOI] [PubMed] [Google Scholar]
- 28.Ishihara A, Segall JE, Block SM, Berg HC. J. Bacteriol. 1983;155(1):228. doi: 10.1128/jb.155.1.228-237.1983. [DOI] [PMC free article] [PubMed] [Google Scholar]
- 29.Sourjik V, Berg HC. Nature. 2004;428(6981):437. doi: 10.1038/nature02406. [DOI] [PubMed] [Google Scholar]
- 30.Tindall MJ, Porter SL, Maini PK, Gaglia G, Armitage JP. Bull Math Biol. 2008;70(6):1525. doi: 10.1007/s11538-008-9321-6. [DOI] [PubMed] [Google Scholar]
Associated Data
This section collects any data citations, data availability statements, or supplementary materials included in this article.


