Abstract
The lipooligosaccharide (LOS) from the N. meningitidis prototype serogroup A strain NMA Z2491, an L9 immunotype LOS, was isolated and structurally characterized using glycosyl composition and linkage determination, mass spectrometry and both 1- and 2-D nuclear resonance spectroscopy. The results show that the L9 LOS has an identical structure to that of an L4 LOS structure with the exception that it does not contain a sialic acid residue linked to position 3 of the lactoneotetraose terminal galactosyl residue. Further, two oligosaccharides are present in the Z2491 LOS preparation, OS1 and OS2. They differ from one another only in that OS2 contains an added glycine moiety, presumably at O-7 on the inner core Hep II residue. The structures of these oligosaccharides are as follows:
 |
Where R = H or Gly.
Keywords: Neisseria meningitidis, NMA, L9 Immunotype, Lipooligosaccharide, LOS, Structure, Phosphoethanolamine
1. Introduction
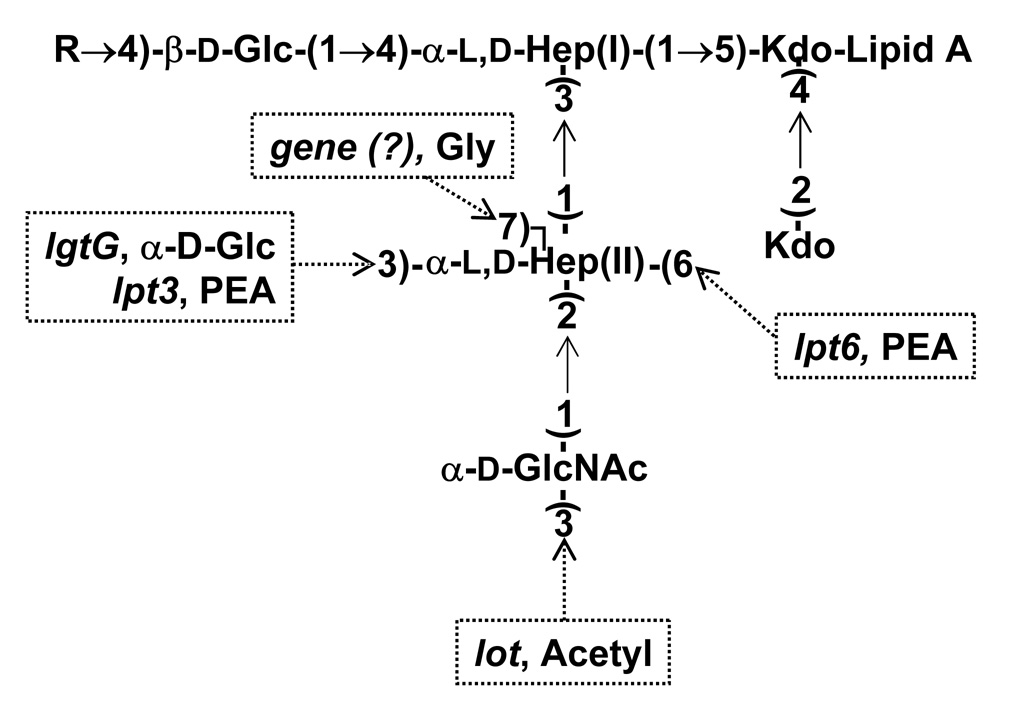
The lipooligosaccharides (LOSs) of meningococci are known to be involved in virulence and pathogenicity 1–3. Twelve immunologically and structurally distinct N. meningitidis LOSs are known. All of the N. meningitidis LOS structures contain a common inner core oligosaccharide structure: α-d-GlcNAc-(1→2)-α-l,d-Hep II-(1→3)-α-l,d-Hep I-(1→5)-[Kdo-(1→4)]-Kdo. An α-lactoneotetraose oligosaccharide can be attached to this inner core structure at O-4 of the Hep I residue. The structures of the different LOS immunotypes vary from one another in the type of substituents located on the α-d-GlcNAc-(1→2)-α-l,d-Hep II- portion of the inner core oligosaccharide, whether the α-lactoneotetraose oligosaccharide that is attached to Hep I is complete or truncated, and the addition of N-acetylneuraminic acid (NeuNAc) to the α-lactoneotetraose. Figure 1 gives a generalized N. meningitidis LOS inner core structure illustrating the various substituents that are observed among the different immunotypes and the genes encoding the necessary transferases.
Figure 1.
The inner core structure of N. meningitidis LOS is shown with the various substituents that can be attached, their location and the genes responsible for these substituents. The gene responsible for the addition of glycine has not yet been identified or reported.
The LOS has been shown to have numerous roles in meningococcal pathogenesis including modulation of attachment to and invasion of endothelial and epithelial cells, in addition to protecting the meningococcus from complement-mediated lysis. The α-lactoneotetraose chain has been shown to interfere with Opc-mediated attachment of meningococci to endothelial cells 4. Recent studies indicate, however, that the intact LOS structure has a significant role in triggering invasion, an effect that is lost upon truncation 5. The presence of exposed PEA substituents at O-3 or O-6 of Hep II of the LOS inner core are targets for the C4b complement component and dictate sensitivity to human complement-mediated lysis 6. Thus, structural modifications that mask or eliminate these groups have important implications for the virulence of the meningococcus.
The combination of these inner core substituents and the length of the α-neolactotetraose portion of the LOS are determined by the presence or absence of small genetic islands encoding the relevant transferases and the phased expression of these genes. lgtG and lpt6 encode the transferases responsible for the addition of O-3-linked glucose and O-6-linked PEA to Hep II and are located on genetic islands which are either present or absent in different isolates 7. lpt3, which encodes the transferase for adding the O-3-linked PEA group to the inner core, is also located on a genetic island found in all strains; however, in some strains lpt3 itself may contain an internal deletion that inactivates the gene 8. In addition to their presence or absence, expression of the genes lgtA, lgtD, and lgtC, which are responsible for α-chain synthesis 9, 10, and lgtG 11 and lot, 12 which are responsible for the glycosylation of Hep II and O-acetylation of the terminal α-GlcNAc residue, respectively, is determined by phase-variation of the coding frame. However, even when all of these genes are present and “phase-on”, the inner core substitution pattern can be restricted to a specific subset of structures. For example, in strain NMB (an L2 immunotype) all the genes are present and “phase-on” for addition of the α-lactoneotetraose, as well as for all of the possible inner core substituents; i.e., it has the genes responsible for the addition of both PEA groups, lpt3 and lpt6, and it has “phase-on” lgtG and lot genes 12. However, the NMB LOS lacks the O-3 PEA group and exclusively contains a α-Glc residue and a PEA group at O-3 and at O-6, respectively, on Hep II, and has an acetyl group at O-3 of the α-GlcNAc residue. Although strain NMB has an active Lpt3, the absence of the PEA group at O-3 on Hep II was found to be controlled by several factors. An O-3 PEA group is present on the inner cores of LOS of mutants unable to complete the α-lactoneotetraose addition to Hep I 13, on the LOS from the lgtK mutant that lacks the α-GlcNAc residue at O-2 of Hep II and lacks the α-lactoneotetraose 14, and on the LOS from a double lgtGlot mutant that contains the intact α-lactoneotetraose but lacks the inner core terminal α-Glc and the O-acetyl group 12. These results showed that when the α-lactoneotetraose was present, an acetyl group at O-3 of the inner core α-GlcNAc residue prevented Lpt3 from adding PEA to O-3 of Hep II in the absence of LgtG activity 12.
Prototype serogroup A N. meningitidis, strain NMA Z2491, has an L9 LOS structure. The glycosyl sequence of an L9 LOS was reported by Jennings et al. 15 to consist of the α-neolactotetraose attached to an inner core region that lacks the α-Glc residue attached to O-3 of Hep II. However, the location of the substituent groups, i.e., PEA and acetyl groups, on the inner core region has not been reported. Here, we report the structure of the L9 LOS from NMA Z2491, including the presence and location of the inner core substituent groups.
2. Results
2.1 Glycosyl composition and linkage analysis of the NMA Z2491 LOS
Composition analysis showed that the LOS glycosyl residues consisted of galactose (Gal), glucose (Glc), l-glycero-d-manno-heptose (Hep), N-acetyl glucosamine (GlcNAc) and 3-deoxy-d-manno-2-octulosonic acid (Kdo). The major fatty acids detected were lauric acid (C12:0), myristic acid (C14:0), β-hydroxy lauric acid (3-OH C12:0) and β-hydroxy myristic acids (3-OH C14:0). This glycosyl and fatty acyl composition is as expected for a N. meningitidis LOS. Notably, the NMA2491 LOS did not contain detectable levels of NeuNAc.
The oligosaccharides were released from the LOS by mild acid hydrolysis and fractionated by GPC using Bio-Gel P4. The GPC yielded two fractions termed as OS1 and OS2, respectively. Glycosyl residue composition analysis showed that both fractions contained Gal, Glc, Hep, GlcNAc, and Kdo. However, OS2 contained larger amounts of Kdo compared to OS1. This was due to the presence of monomeric Kdo that eluted with OS2. The monomeric Kdo was identified as the branching Kdo from the inner core that was also liberated during mild acid hydrolysis. Hence OS2 was further purified by Bio-Gel P2 (fine) which separated the OS2 from the monomeric Kdo. Approximately 60% of the carbohydrate was OS1 and 40% OS2.
Methylation analysis of OS1 indicated the presence of terminally linked Gal, 3-linked Gal, 4-linked Glc, (3→4)-linked Hep, 4-linked GlcNAc and terminally linked GlcNAc. Methylation analysis of OS2 gave the same glycosyl linkages. These linkages are consistent with an LOS that contains a lactoneotetraose [Gal-(1→4)-GlcNAc-(1→3)-Gal-(1→4)-Glc-(1→] attached to the 4-position of the (3→4)-linked Hep I residue, and an inner core region consisting of a terminal GlcNAc residue possibly attached to the 2-position of the second Hep residue (Hep II). The reason we do not see any of the Hep II residue in the methylation analysis is that this residue contains a phosphorylated substitutent (i.e., a PEA group) and is not detected by this procedure. Therefore, methylation analysis was repeated after removal of the PEA group by treating the OS with aqueous HF. This resulted in the appearance of 2-linked Hep which is consistent with a GlcNAc residue attached to O-2 of the Hep II residue. The presence and location of the PEA substituent is described below with regard to the mass spectrometric and NMR analyses.
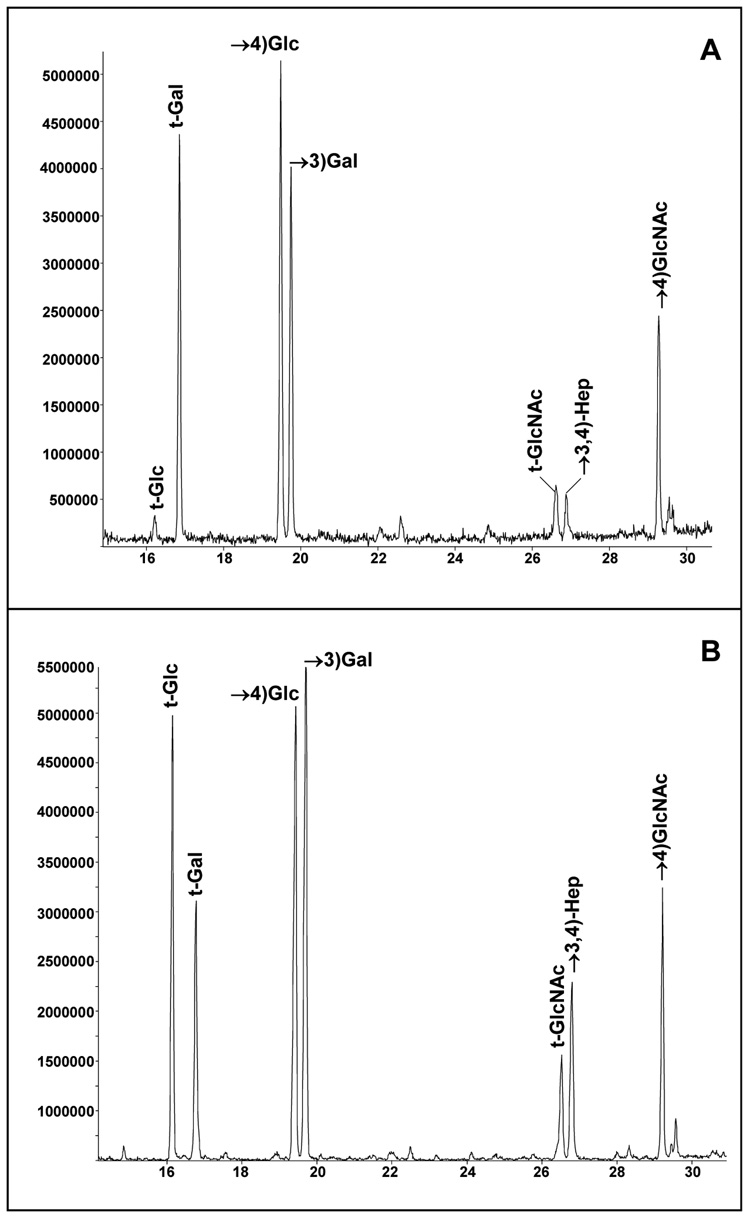
A comparison of the glycosyl linkages obtained from NMB LOS with those of the NMA Z2491 LOS is shown in Figure 2. The major difference observed in the PMAA profiles is that the NMB LOS contains terminally linked Glc, which is absent in the NMA Z2491 LOS. This terminally linked Glc residue in NMB L2 immunotype LOS is due to the α-Glc that is attached to O-3 of the Hep II residue,16 and these results show that this residue is not present in the NMA Z2491 LOS. There are also greater 3-linked and less terminally linked levels of Gal in the NMB LOS compared to the NMA Z2491 LOS due to the fact that a portion of the NMB LOS contains NeuNAc attached to O3 of the lactoneotetraose distal Gal residue,16 and the NMA Z2491 LOS does not contain NeuNAc.
Figure 2.
A comparison of the GC–MS profile of the partially methylated aldtitol acetates obtained from the LOS of (A.) N. meningitidis NMA Z2491, and (B.) N. meningitidis NMB. t-Glc = terminally linked glucose; t-Gal = terminally linked galactose, t-GlcNAc = terminally linked N-acetylglucosamine; →4)Glc = 4-linked glucose; →3)Gal = 3-linked galactose; →3,4)Hep = 3,4-linked heptose; and →4)GlcNAc = 4-linked N-acetylglucosamine.
2.2 Mass spectrometric analysis of the NMA Z2491 LOS oligosaccharides
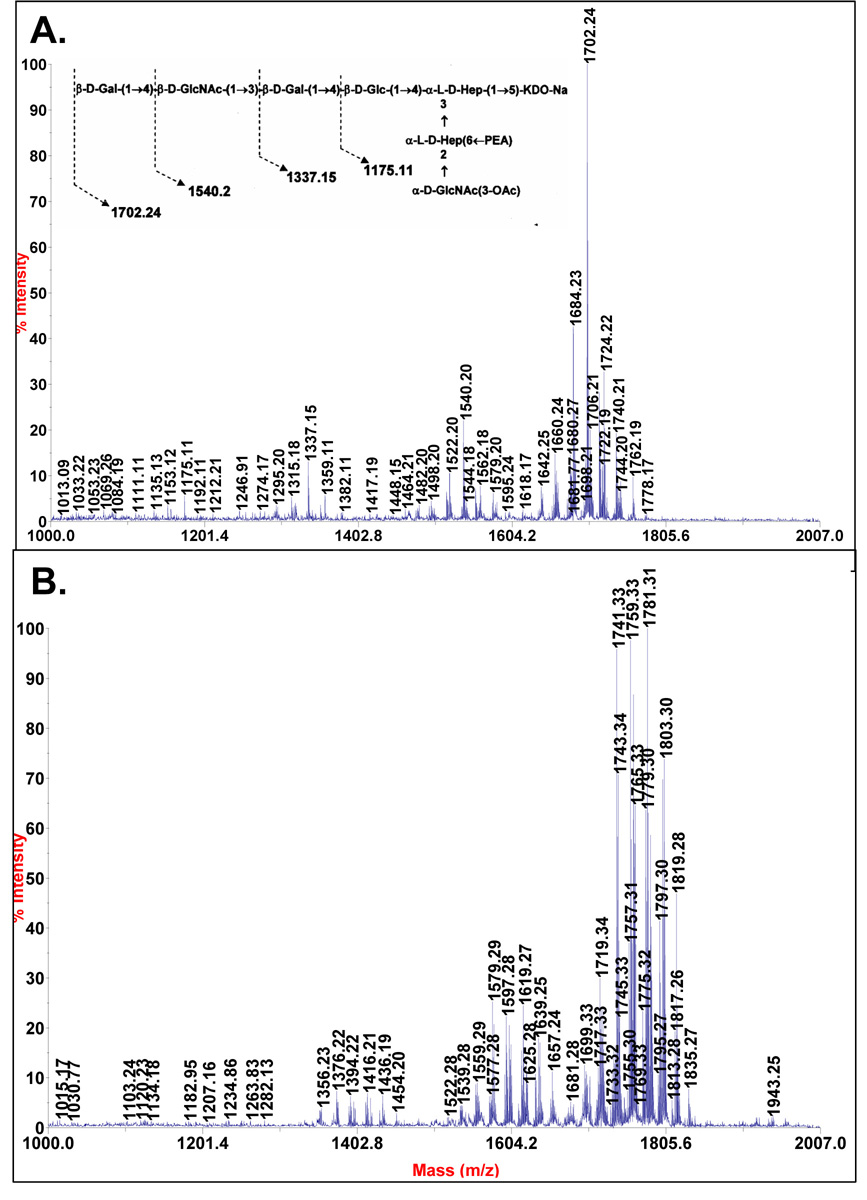
The MALDI-TOF mass spectrum of OS1 in the positive-ion mode showed the presence of a sodiated molecular ion with m/z of 1702.24 as the major component, along with anhydrous and di-sodiated ions, m/z 1684.3 and 1724.22, respectively (Figure 3A). Anhydrous molecules are generated during the mild acid hydrolysis method due to the formation of anhydro-Kdo residues. The proposed compositions for each of these ions are given in Table 1. Ions of minor intensities were also observed due to molecules that lack either a hexose (Hex), a Hex and a GlcNAc, or two Hex and a GlcNAc; e.g., m/z 1540.2, 1337.15, and 1175.11, respectively. The OS1 from NMB LOS has an m/z of [M+Na]+ 1864.3 12, which is 162 mass units greater that the mass of Z2491 OS1. This result is consistent with the above methylation results, which show that the Z2491 OS1 lacks the α-Glc residue that is terminally linked to O-3 of Hep II.
Figure 3.
MALDI-TOF/TOF mass spectra of the oligosaccharides isolated from NMA-LOS and purified by Bio-Gel P4 column. (a.) The mass spectrum of the OS1 fraction. (b.) The mass spectrum of the OS2 fraction. The spectra were acquired in positive mode and the proposed molecular compositions are shown in Table 1.
Table 1.
Observed masses obtained by MALDI-TOFMS analysis of OS1 and OS2 from the LOS of NMA Z2491.
| Observed Mass | Proposed Composition | OS Fraction |
|---|---|---|
| 1803.31 | GlcNAc2Gal2Glc1Hep2PEA1Ac1Gly1Kdo1Na+3 | OS2 |
| 1781.31 | GlcNAc2Gal2Glc1Hep2PEA1Ac1Gly1Kdo1Na+2 | OS2 |
| 1759.33 | GlcNAc2Gal2Glc1Hep2PEA1Ac1Gly1Kdo1Na+1 | OS2 |
| 1741.33 | GlcNAc2Gal2Glc1Hep2PEA1Ac1Gly1Kdo1Na+1(−H2O) | OS2 |
| 1724.22 | GlcNAc2Gal2Glc1Hep2PEA1Ac1Kdo1Na+2 | OS1 |
| 1702.24 | GlcNAc2Gal2Glc1Hep2PEA1Ac1Kdo1Na+1 | OS1 |
| 1685.23 | GlcNAc2Gal2Glc1Hep2PEA1Ac1Kdo1Na+1(−H2O) | OS1 |
| 1619.27 | GlcNAc2Gal1Glc1Hep2PEA1Ac1Gly1Kdo1Na+2 | OS2 |
| 1597.28 | GlcNAc2Gal1Glc1Hep2PEA1Ac1Gly1Kdo1Na+1 | OS2 |
| 1579.29 | GlcNAc2Gal1Glc1Hep2PEA1Ac1Gly1Kdo1Na+1(−H2O) | OS2 |
| 1579.2 | GlcNAc2Gal2Glc1Hep2Ac1Kdo1Na+1 | OS1 |
| 1562.18 | GlcNAc2Gal1Glc1Hep2PEA1Ac1Kdo1Na+2 | OS1 |
| 1540.2 | GlcNAc2Gal1Glc1Hep2PEA1Ac1Kdo1Na+1 | OS1 |
| 1522.2 | GlcNAc2Gal1Glc1Hep2PEA1Ac1Kdo1Na+1(−H2O) | OS1 |
| 1416.21 | GlcNAc1Gal1Glc1Hep2PEA1Ac1Gly1Kdo1Na+2 | OS2 |
| 1394.22 | GlcNAc2Gal1Glc1Hep2PEA1Ac1Gly1Kdo1Na+1 | OS2 |
| 1376.22 | GlcNAc2Gal1Glc1Hep2PEA1Ac1Gly1Kdo1Na+1(−H2O) | OS2 |
| 1359.11 | GlcNAc1Gal1Glc1Hep2PEA1Ac1Kdo1Na+2 | OS1 |
| 1337.15 | GlcNAc1Gal1Glc1Hep2PEA1Ac1Kdo1Na+1 | OS1 |
| 1315.18 | GlcNAc1Gal1Glc1Hep2PEA1Ac1Kdo1 | OS1 |
| 1175.11 | GlcNAc1Glc1Hep2PEA1Ac1Kdo1Na+1 | OS1 |
| 1153.11 | GlcNAc1Glc1Hep2PEA1Ac1Kdo1 | OS1 |
| 1135.13 | GlcNAc1Glc1Hep2PEA1Ac1Kdo1(−H2O) | OS1 |
The major molecular ions observed in the MALDI-TOF mass spectrum of OS2 are 57 mass units greater than those for OS1, i.e., m/z of 1759.33, 1781.31 and 1803.31. This increase in 57 mass units is consistent with these ions being due to mono-, di-, and tri-sodiated oligosaccharides containing an added glycine (+ 57 mass units) residue (Figure 3B). As with OS1, the OS2 ions and their proposed compositions are given in Table 1. The presence of glycine was also supported by HSQC NMR analysis of OS2 (data on shown) that showed a δ 3.56/42.4 1H/13C cross resonance as reported17 for the glycine methylene group for the inner core region of N. meningitidis LOS.
2.3 NMR spectroscopic analysis of the NMA Z2491 LOS OS1
The structure of the NMA Z2491 LOS was determined by comparing the NMR spectral data of its OS1 with those data published for the OS of the NMB LOS 16.
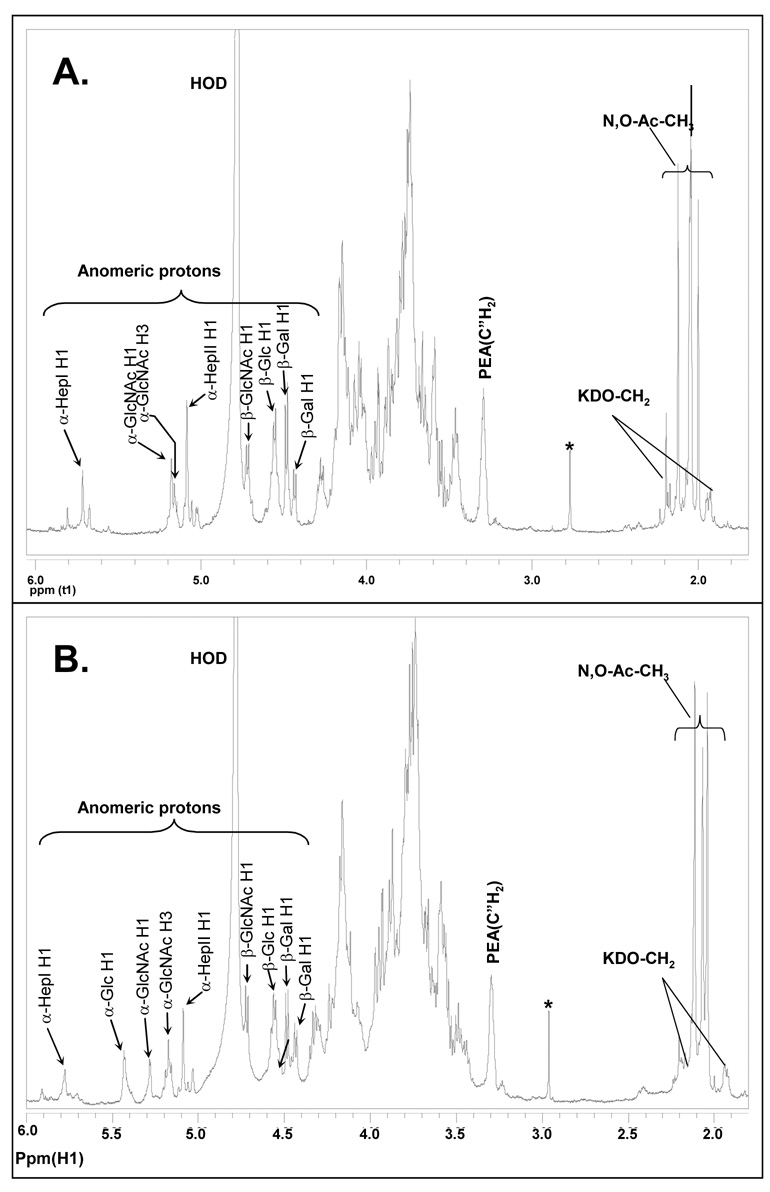
A comparison of the NMA Z2491 OS1 proton spectrum with that of NMB OS1 is shown in Figure 4. The assignments of the NMB OS1 proton resonances were as reported in the literature 12, 16. This spectral comparison clearly shows that the resonance for H-1 of the α-Glc (δ ~5.41) that is attached to O-3 of Hep II (residue B) in the NMB OS1 is absent in the spectrum of the NMA Z2491 OS1, and that the H-1 of the α-GlcNAc residue has shifted from δ ~5.25 to δ 5.18 However, the remaining anomeric resonances between the NMB and NMA Z2491 OSs are essentially identical, indicating that the Z2491 OS glycosyl structure differs from that of the NMB OS only in that it lacks the terminally linked α-Glc residue. Also, both the NMB and the NMA Z2491 OS have a resonance at δ ~3.30 that is indicative of a PEA group.
Figure 4.
1H NMR spectrum of OS1 isolated from (A.) NMA Z2491 LOS and (B.) NMB LOS. The data were acquired at 27 °C on Varian 600-MHz instrument. The anomeric region and structural reporter signals are as labeled.
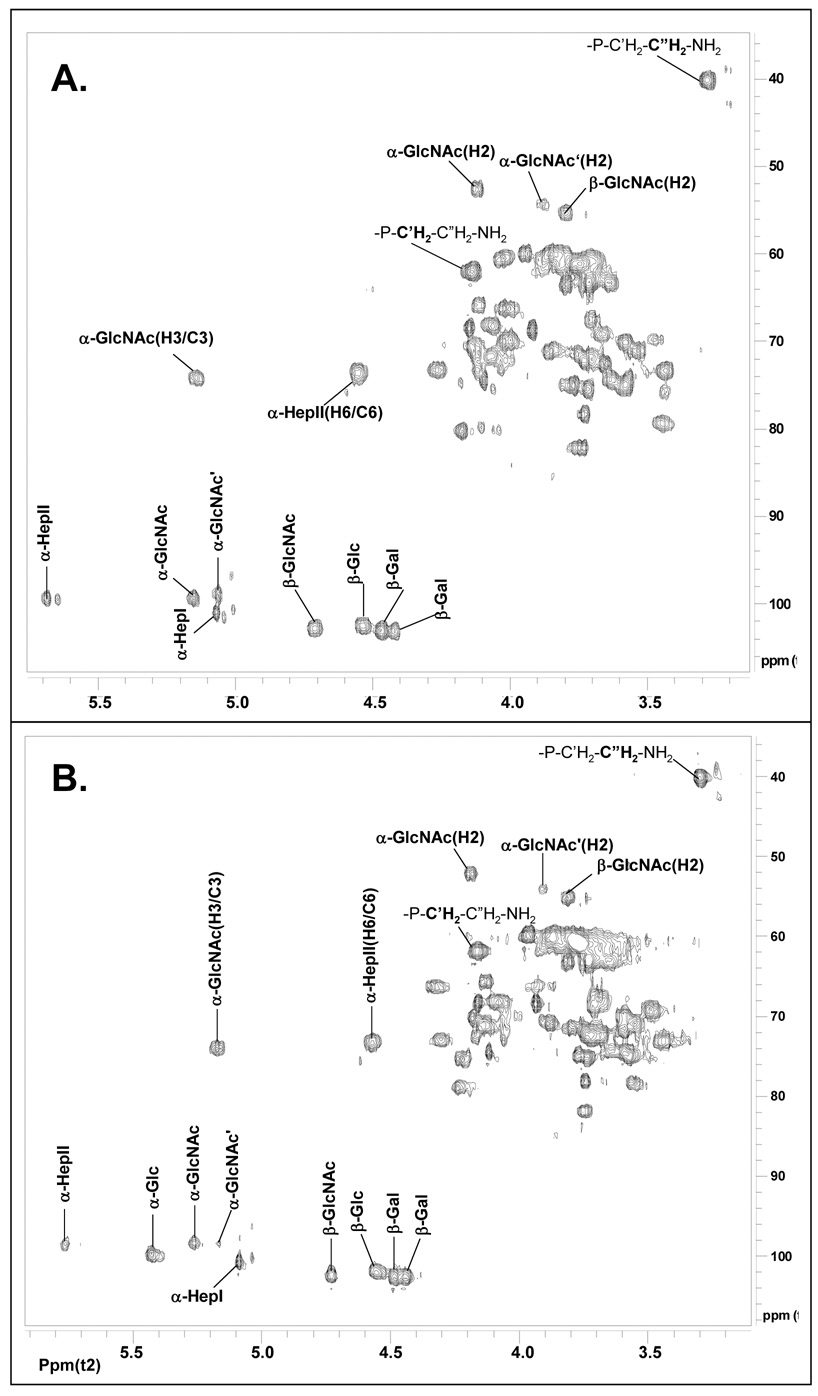
Further NMR analysis using gCOSY, TOCSY, and HSQC allowed assigning many of the proton and carbon resonances of the NMA Z2491 OS1. These assignments are shown in Table 2. Also, a comparison of the HSQC spectra for the NMB and NMA Z2491 OS1 fractions is shown in Figure 5. As with the comparison of the proton spectra, these results support the conclusion that the Z9241 OS structure is the same as that determined for NMB OS with the exception that it lacks the terminally linked α-Glc that is attached to O-3 of Hep II. It should also be noted that the location of the O-acetyl group is at O-3 of the α-GlcNAc residue as indicated by the H-3/C-3 chemical shift of δ 5.16/74.3, a result that is identical to that as reported for the NMB OS 12 and is shown in Figure 5B. The HSQC spectrum also shows a second α-GlcNAc H1 (δ 5.08/98.0) which is due to the presence of a small amount of OS that lacks the O-acetyl group. This structure is likely due to the partial removal of the O-acetyl group during the mild acid hydrolysis procedure.
Table 2.
Partial assignment of the proton and carbon chemical shifts for OS1 isolated from NMA Z2491 LOS.
| Residue | H1(C1) | H2(C2) | H3(C3) | H4(C4) | H5(C5) | H6(C6) | H7(C7) |
|---|---|---|---|---|---|---|---|
| →2)-α-Hep II [-6-PEA] |
5.71 (99.6) [4.14 (62.4)] |
4.20 (80.6) [3.30 (40.6)] |
4.03 (70.2) | 4.01 (66.5) | 3.82 (75.2) | 4.58 (74.0) | 3.82/3.79 (63.7) |
| t-α-GlcNAc [-3-OAc] |
5.18 (99.6) | 4.14 (53.1) [2.12 (20.9)] |
5.16 (74.3) | 3.72 (72.4) | 3.71 (72.4) | 3.74/nd (61.5) | |
| →3,4)-α-Hep I | 5.08 (99.9) | 4.13 (66.2) | 4.12 (74.6) | 4.27 (73.4) | 4.14 (71.4) | 4.08 (70.2) | 3.65/3.72 (63.7) |
| →4)-β-GlcNAc | 4.73 (103.1) | 3.82 (55.6) | 3.75 (72.4) | 3.74 (82.4) | 3.58 (75.2) | 3.86/nd (60.2) | |
| →4)-β-Glc | 4.55 (102.7) | 3.44 (73.7) | 3.63 (74.6) | 3.45 (79.6) | 3.60 (75.2) | 3.76/3.71 (61.4) | |
| t-β-Gal | 4.49 (103.4) | 3.54 (71.5) | 3.67 (73.1) | 3.93 (69.0) | 3.77 (75.6) | 3.82/nd (61.2) | |
| →3)-β-Gal | 4.44 (103.4) | 3.58 (71.5) | 3.75 (82.4) | 4.16 (68.7) | 3.74 (78.7) | 3.81/nd (61.5) | |
| →5)-Kdo | 1.93/2.09 (34.6) | 4.12 (71.5) | 4.17 | 4.29 | 3.75 |
Figure 5.
1H-13C HSQC NMR spectrum of OS1 isolated from (A.) NMA Z2491 LOS and (B.) NMB LOS. The data were acquired at 27 °C on a Varian 600-MHz instrument. The anomeric and some of the non-anomeric protons are labeled, the carbon chemical shifts of major signals are marked.
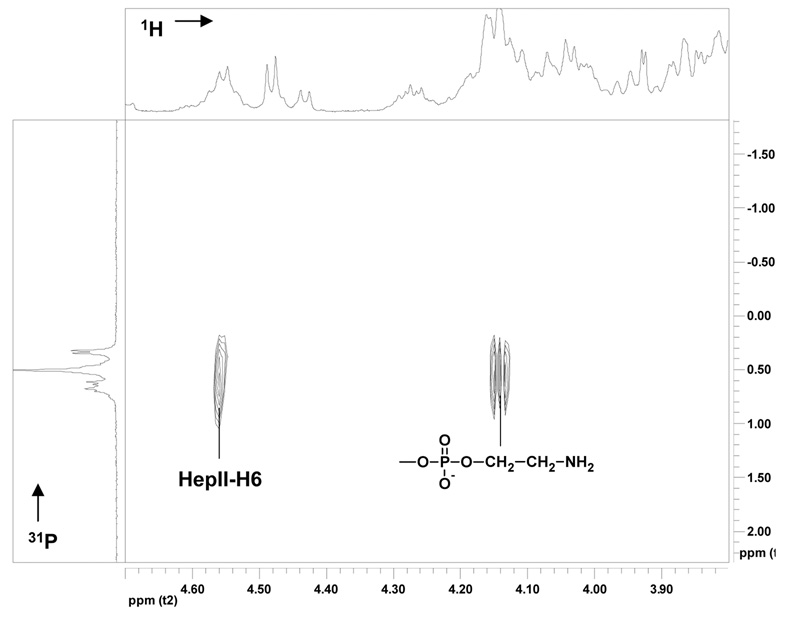
The above NMR and MS data clearly show that the NMA Z2491 OS contains a single PEA substituent. The PEA substituents of various N. meningitidis LOS OSs can be attached to the Hep II residue at O-3, O-6, or O-7, or at both O-3 and O-6. Since the NMA Z2491 OS clearly lacks the α-Glc residue at O-3 of Hep II, this position is open for substitution by a PEA group. Therefore, it was important to determine the location of the PEA substituent in the NMA Z2491 OS. This was accomplished by 31P-1H HMQC spectroscopy, Figure 6. This spectrum clearly shows that the protons of the PEA methylene group attached to the phosphate (δ 4.14) are coupled to both the phosphorous of the PEA group and to the Hep II H6 proton (δ 4.58). Therefore, the single PEA group in the NMA Z2491 oligosaccharide is at O-6 on the Hep II residue.
Figure 6.
1H-31P HMQC NMR spectrum of OS1 isolated from NMA-LOS and purified by a Bio-Gel P4 column. The data were acquired at 27 °C at pH 6.8 on a Varian 500-MHz instrument. The projection on top represents 1D proton spectrum and the projection on left hand side the 1D phosphorus indicating the connectivity between the phosphate and sugar ring.
In summary, these data are consistent with the following structure for the NMA Z9241 OS where R is either a proton or a glycine residue:
Approximately 40% of the LOS has the added glycine residue. The position of this glycine residue was not determined, but is likely to be at O-7 of the Hep II residue as reported by Cox et al. 17.
3. Discussion
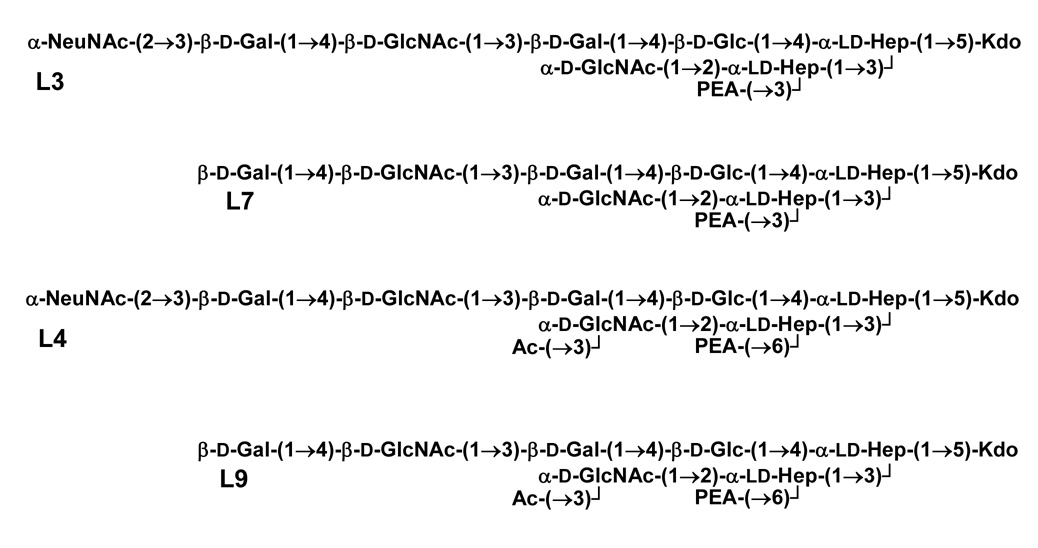
In this report, we have shown that the LOS structure of NMA Z2491 has an outer core oligosaccharide that consists of α-lactoneotetraose attached to O-4 of Hep I, and an inner core region in which Hep II is substituted at O-6 with a PEA group and at O-2 with α-GlcNAc. In addition, the α-GlcNAc residue is substituted with an acetyl group at O-3. A portion, approximately 40%, of the LOS consists of structures that are glycinylated in the inner core region, presumably at O-7 of the Hep II residue. As expected for an isolate without an endogenous supply of NeuNAc, the LOS is not sialylated. The structure of this oligosaccharide is shown in Figure 7, structure L9. For the purposes of the following discussion, the structures of the oligosaccharides from L3, L4, and L7 immunotypes are also shown in Figure 7.
Figure 7.
A comparison of the structures of the oligosaccharides from immunotypes L3, L7, L4, and L9.
Jennings et al. 18, reported that the LOSs from L3, L7, and L9 all had the same oligosaccharide structure as obtained after release from the lipid A by mild acid hydrolysis and after treatment with aqueous HF and O-deacetylation. Our results for the L9 LOS from NMA Z2491 also show the same oligosaccharide structure, after HF treatment, as reported by Jennings et al. 18, with the exception that we show that the terminally linked α-GlcNAc residue is acetylated at O-3. This exception was likely due to the fact that Jennings et al. O-deacetylation the OS in addition to HF treatment, which removed any O-acetyl groups. Therefore, it was possible that the L3, L7, and L9 LOSs could vary, not only in the location of PEA groups, but also in the presence or absence of the O-acetyl group. Subsequent to the findings of Jennings et al. 18, Kogan et al 19 reported that the L3 LOS was distinguished from L7 by the presence of a terminally linked NeuNAc residue. Similarly, comparison of the L4 structure with our results for the NMA Z2491 L9 structure reveals that the major distinction between these two structures is the presence or absence, respectively, of terminal NeuNAc on the lactoneotetraose portion of the LOS. In comparison to the L7 LOS structure, the L9 NMA Z2491 LOS structure differs in that it contains an acetyl group at the O-3 of the terminally linked α-GlcNAc residue, and it has a PEA substituent at O-6 rather than at O-3 of the Hep II residue.
The genetic basis for the structural differences between the L3, L4, L7, and L9 LOSs is due to the presence or absence or phase off or on status of lgtG, lpt3, lpt6, and lot, as well as the availability of CMP-NeuNAc for the addition of NeuNAc by the product of lst. For LOSs that contain a complete α-lactoneotetraose, the expression of lgtG or lot prevents the addition of a PEA to O-3 of Hep II 14. When both lgtG and lot are inactivated, the LOS contains the O-3 PEA substituent 12. In the case of the L3 and L7 immunotypes, lgtG and lot are absent or not expressed, and the resulting LOS contains PEA at O-3 of Hep II and lacks the acetyl group at O-3 of the terminally linked α-GlcNAc residue. Based on the genome sequence of NMA Z2491 20, lgtG is absent, lpt3 contains a deletion, and an active lot is present. This gene profile is consistent with the structure we observe; namely, a LOS that contains a PEA at O-6 of Hep II and not at O-3, and has an acetyl group at O-3 of the α-GlcNAc residue. The difference between this L9 structure and that reported for L4 is that the latter LOS contains a terminally linked NeuNAc. The lack of this terminally linked NeuNAc is due to the inability of serogroup A strains, and other strains that have a non-NeuNAc-containing capsule, to synthesize CMP-NeuNAc 19, 21.
The L9, L10, L11 and L12 immunotypes are expressed by serogroup A strains, which are unable to synthesize NeuNAc-containing capsules, while immunotypes L1 to L8 are expressed in serogroup B and C isolates that have varying levels of NeuNAc capsule expression. In previous surveys, the L3, L7, and L9 LOS all react similarly with a panel of immunotyping antibodies 3, 22. From the known structures of L3, L7 and L9, we can deduce that the immunotyping antibodies may be directed towards the common lactoneotetraose α-chain. Significantly, both immunotyping panels did not contain antibodies that cross-reacted between L4 and L9 structures, even though these structures share the same inner core with O-6 PEA and an O-acetyl group, and differ only in the lack of sialylation of the L9 lactoneotetraose. For this to occur, we would predict that L4 and L9 structures represent different conformations based upon the state of sialylation of the lactoneotetraose, and that this difference is driven by the position of the O-6 PEA group on Hep II. Future molecular modeling of these structures will assess this prediction.
In summary, the L9 LOS structure of NMA Z2491 has the same structure as that reported for the L4 immunotype with the exception that it lacks the terminal NeuNAc residue. The finding has significance for understanding the genetic and immunological basis of meningococcal LOS structure and for design of meningococcal vaccines that contain LOS.
4. Experimental Methods
4.1 Growth conditions
Meningococcal strain NMA Z2491 was grown on GC agar base (Oxoid) supplemented with 20 mM glucose, 0.43 µM thiamine pyrophosphate chloride, 6.8 mM glutamine and 12.4 µM Fe(NO3)3 in a 5% carbon dioxide atmosphere. Liquid cultures were vigorously aerated at 37 °C in GC broth with the same supplements and 0.51 M sodium bicarbonate 23.
4.2 Isolation of oligosaccharides
The LOS was prepared as previously described 24 and washed three times with 9:1 ethanol–water (v/v) mixture to remove contaminating phospholipids. The washed LOS preparation was suspended in water and lyophilized. It was then subjected to mild acid hydrolysis in 1% aq HOAc (v/v) for 2.5 h at 100 °C with constant stirring. The lipid A precipitate that formed during hydrolysis was collected by centrifugation at 3000 × g for 15 min at 4 °C, and the supernatant containing the released oligosaccharides (OSs) was decanted and lyophilized. The lyophilized OSs were further purified by gel-filtration chromatography using a Bio-Gel P-4 (Bio-Rad) column (120 × 1 cm) and water as eluent.
4.3 Glycosyl composition and linkage analysis of the oligosaccharides
Glycosyl compositional analysis was performed by gas chromatography–mass spectrometry (GLC–MS) of per-O-trimethylsilyl (TMS) methyl glycosides with myo-inositol used as an internal standard 25. The samples were hydrolyzed with methanolic 1 M HCl at 80 °C for 18 h. The released monosaccharides were dried under a stream of dry air and N-acetylated with 3:1:1 methanol–pyridine–acetic anhydride (v/v/v) at 100 °C for 1 h. After cooling, samples were dried-down and trimethylsilylated with Tri-Sil® reagent (Pierce) for 30 min at 80 °C. The resulting per-O-TMS derivatives were analyzed by GLC–MS, on Hewlett–Packard HP5890/HP5970 MSD gas chromatograph–mass spectrometer equipped with a Supelco DB-1 fused silica capillary column (30m × 0.25 mm I.D.) with helium as the carrier gas.
Glycosyl linkages were determined by methylation analysis carried out by the slurry NaOH method modified from that of Ciucanu and Kerek 26. Samples were dissolved in 0.5 mL of dimethyl sulfoxide (DMSO) by stirring overnight at room temperature under an N2 atmosphere. After dissolution, a freshly prepared slurry of NaOH in DMSO was added (0.5 mL), and the reaction mixture was stirred for 2 h at room temperature. Methylation was performed by the sequential addition of iodomethane (250 µL followed by 100 µL) at 30-min intervals. The permethylated monosaccharide was extracted into the organic phase after partitioning the reaction mixture between water and chloroform. The organic phase was then removed by evaporation under a stream of N2. The permethylated OS was hydrolyzed with 4 M TFA (100 °C, 6 h), reduced with NaBH4, acetylated and the resulting partially methylated alditol acetates (PMAAs) were dissolved in dichloromethane and analyzed by GLC–MS using an HP-1 (from Hewlett–Packard) capillary column (25 m × 0.25 mm).
Methylation analysis was also performed after treating the OS with aqueous 48% hydrogen fluoride (HF) to reveal the linkages of the glycosyl residues that contain phosphorylated components. Oligosaccharide (1 mg) was dissolved in 200 µL of 48% HF and kept at 4 ° C for 48 h. The solution was diluted 10 times by adding 2 mL of cold distilled water and dialyzed against cold water at 4 °C using a 500 MWCO dialysis bag for 3 days with three changes of water. Finally the solution was lyophilized and used for chemical and linkage analysis.
4.4 Mass spectrometry
Oligosaccharides were analyzed by matrix-assisted laser desorption ionization time of flight mass spectrometry (MALDI-TOF MS) using a 4700 Proteomics Analyzer instrument (Applied Biosystems). The OS samples were dissolved in water (1 µg/µL), mixed in a 1:1 (v/v) ratio with 0.5 M 2,5-dihydroxybenzoic acid (DHB) in methanol matrix solution, and spotted on a stainless steel MALDI plate. Spectra were acquired in both the positive- and negative-ion acquisition modes. The acceleration voltage was set to 20 kV, and data were acquired in the reflectron mode with a 200 ms delay
4.5 NMR Spectroscopy
NMR spectra were collected on Varian Inova 500 and 600 spectrometers using standard software supplied by Varian. The samples were exchanged several times with D2O (99.8% Aldrich), and final measurements were made in 0.5-mL D2O solutions (100% D; Cambridge Isotope Laboratories) at 27 °C. Proton NMR spectra were measured at 600 MHz using spectral width of 8 kHz and the data were processed with the HOD signal referenced at 4.78 ppm on the proton scale. The correlated spectroscopy (gCOSY) spectra were measured over a spectral width of 2.25 kHz using a dataset of (t1 × t2) of 256 × 2048 points with 32 scans. The total correlated spectroscopy (TOCSY) and nuclear Overhauser (NOESY) spectra were collected using the same sized data set with 32 scans with a mixing time of 80 and 200 ms, respectively. For the heteronuclear single quantum coherence (HSQC) experiment, the spectral widths in the proton and carbon dimensions were 2.5 and 22.0 kHz, respectively. 1D 31P NMR spectra were obtained at pH 7.0 using a Varian Inova 500 instrument with a broadband probe adjusted to 202.38 MHz. 1H-decoupled 31P spectra were acquired with spectral width of 10 kHz calibrated with phosphoric acid (85%) as the external standard (δp = 0.0 ppm). The 2D proton detected 1H–31P heteronuclear multiple bond quantum coherence (HMQC) and HMQC-TOCSY experiments were performed using the standard pulse sequence supplied by Varian. The measurements of HMQC and HMQC-TOCSY spectra were obtained using a spectral width of 2.2 and 5.8 kHZ in the proton and phosphorus dimensions, respectively.
Acknowledgements
D.S.S. and C.M.K were supported by National Institutes of Health R01 AI033517 and the CCRC is supported in part by a grant from the Department of Energy DE-FG09-93ER20097.
Footnotes
Publisher's Disclaimer: This is a PDF file of an unedited manuscript that has been accepted for publication. As a service to our customers we are providing this early version of the manuscript. The manuscript will undergo copyediting, typesetting, and review of the resulting proof before it is published in its final citable form. Please note that during the production process errors may be discovered which could affect the content, and all legal disclaimers that apply to the journal pertain.
References
- 1.Jones DM, Borrow R, Fox AJ, Gray S, Cartwright KA, Poolman JT. Microb. Pathol. 1992;13:219–224. doi: 10.1016/0882-4010(92)90022-g. [DOI] [PubMed] [Google Scholar]
- 2.Møller A-SW, Bjerre A, Brusletto B, Joø GB, Brandtzaeg P, Kierulf P. J. Infect. Dis. 2005;191:768–775. doi: 10.1086/427514. [DOI] [PubMed] [Google Scholar]
- 3.Scholten RJ, Kuipers B, Valkenburg HA, Dankert J, Zollinger WD, Poolman JT. J. Med. Microbiol. 1994;41:236–243. doi: 10.1099/00222615-41-4-236. [DOI] [PubMed] [Google Scholar]
- 4.Virji M, Makepeace K, Peak IR, Ferguson DJ, Jennings MP, Moxon ER. Mol. Microbiol. 1995;18:741–754. doi: 10.1111/j.1365-2958.1995.mmi_18040741.x. [DOI] [PubMed] [Google Scholar]
- 5.Lambotin M, Hoffmann I, Laran-Chich M-P, Nassif X, Couraud PO, Bourdoulous S. J. Cell Sci. 2005;118:3805–3816. doi: 10.1242/jcs.02514. [DOI] [PubMed] [Google Scholar]
- 6.Ram S, Cox AD, Wright JC, Vogel U, Getzlaff S, Boden R, Li J, Plested JS, Meri S, Gulati S, Stein DC, Richards JC, Moxon ER, Rice PA. J. Biol. Chem. 2003;278:50853–50862. doi: 10.1074/jbc.M308364200. [DOI] [PubMed] [Google Scholar]
- 7.Zhu P, Klutch MJ, Bash MC, Tsang RSW, Ng L-K, Tsai C-M. Microbiology. 2002;148:1833–1844. doi: 10.1099/00221287-148-6-1833. [DOI] [PubMed] [Google Scholar]
- 8.Mackinnon FG, Cox AD, Plested JS, Tang CM, Makepeace K, Coull PA, Wright JC, Chalmers R, Hood DW, Richards JC, Moxon ER. Mol. Microbiol. 2002;43:931–943. doi: 10.1046/j.1365-2958.2002.02754.x. [DOI] [PubMed] [Google Scholar]
- 9.Kahler CM, Stephens DS. Crit. Rev. Microbiol. 1998;24:281–334. doi: 10.1080/10408419891294216. [DOI] [PubMed] [Google Scholar]
- 10.Jennings MP, Srikhanta YN, Moxon ER, Kramer M, Poolman JT, Kuipers B, van der Ley P. Microbiology. 1999;145:3013–3021. doi: 10.1099/00221287-145-11-3013. [DOI] [PubMed] [Google Scholar]
- 11.Banerjee A, Wang R, Uljon SN, Rice PA, Gotschlich EC, Stein DC. Proc. Natl. Acad. Sci. U.S.A. 1998;95:10872–10877. doi: 10.1073/pnas.95.18.10872. [DOI] [PMC free article] [PubMed] [Google Scholar]
- 12.Kahler CM, Lyons-Schindler S, Choudhury B, Glushka J, Carlson RW, Stephens DS. J. Biol. Chem. 2006;281:19939–19948. doi: 10.1074/jbc.M601308200. [DOI] [PubMed] [Google Scholar]
- 13.Cox AD, Li J, Brisson J-R, Moxon ER, Richards JC. Carbohydr. Res. 2002;337:1435–1444. doi: 10.1016/s0008-6215(02)00161-1. [DOI] [PubMed] [Google Scholar]
- 14.Kahler CM, Datta A, Tzeng YL, Carlson RW, Stephens DS. Glycobiology. 2005;15:409–419. doi: 10.1093/glycob/cwi018. [DOI] [PubMed] [Google Scholar]
- 15.Jennings HJ, Johnson KG, Kenne L. Carbohydr. Res. 1983;121:233–241. doi: 10.1016/0008-6215(83)84020-8. [DOI] [PubMed] [Google Scholar]
- 16.Rahman MM, Stephens DS, Kahler CM, Glushka J, Carlson RW. Carbohydr. Res. 1998;307:311–324. doi: 10.1016/s0008-6215(98)00012-3. [DOI] [PubMed] [Google Scholar]
- 17.Cox AD, Li J, Richards JC. Eur. J. Biochem. 2002;269:4169–4175. doi: 10.1046/j.1432-1033.2002.03131.x. [DOI] [PubMed] [Google Scholar]
- 18.Jennings HJ, Johnson KG, Kenne L. Carbohydr.Res. 1983;121:233–241. doi: 10.1016/0008-6215(83)84020-8. [DOI] [PubMed] [Google Scholar]
- 19.Kogan G, Uhrin D, Brisson J-R, Jennings HJ. Carbohydr. Res. 1997;298:191–199. doi: 10.1016/s0008-6215(96)00305-9. [DOI] [PubMed] [Google Scholar]
- 20.Parkhill J, Achtman M, James KD, Bentley SD, Churcher C, Klee SR, Morelli G, Basham D, Brown D, Chillingworth T, Davies RM, Davis P, Devlin K, Feltwell T, Hamlin N, Holroyd S, Jagels K, Leather S, Moule S, Mungall K, Quail MA, Rajandream MA, Rutherford KM, Simmonds M, Skelton J, Whitehead S, Spratt BG, Barrell BG. Nature. 2000;404:502–506. doi: 10.1038/35006655. [DOI] [PubMed] [Google Scholar]
- 21.Tsang RSW, Law DKS, Tsai C-M, Ng L-K. FEMS Microbiol. Lett. 2001;199:203–206. doi: 10.1111/j.1574-6968.2001.tb10675.x. [DOI] [PubMed] [Google Scholar]
- 22.Gu XX, Tsai CM, Karpas AB. J. Clin. Microbiol. 1992;30:2047–2053. doi: 10.1128/jcm.30.8.2047-2053.1992. [DOI] [PMC free article] [PubMed] [Google Scholar]
- 23.Morse SA, Bartenstein L. Proc. Soc. Exp. Biol. Med. 1974;145:1418–1421. doi: 10.3181/00379727-145-38025. [DOI] [PubMed] [Google Scholar]
- 24.Kahler CM, Carlson RW, Rahman MM, Martin LE, Stephens DS. J. Bacteriol. 1996;178:1265–1273. doi: 10.1128/jb.178.5.1265-1273.1996. [DOI] [PMC free article] [PubMed] [Google Scholar]
- 25.York WS, Darvill AG, McNeil M, Stevenson TT, Albersheim P. Methods Enzymol. 1985;118:3–40. [Google Scholar]
- 26.Ciucanu I, Kerek F. Carbohydr. Res. 1984;131:209–217. [Google Scholar]


