Abstract
A key application of Field Asymmetric Waveform Ion Mobility Spectrometry (FAIMS) has been in selectively transmitting trace analyte ions that are present in a complex ion mixture to a Mass Spectrometer (MS) downstream for identification and quantification. The overall sensitivity of FAIMS-MS, however, still needs to be significantly improved through the optimization of the ion transmission in and out of FAIMS. Processes that can cause ion losses include diffusion, space charge, separation field in the FAIMS and fringe fields around the edges of the FAIMS electrodes. These were studied here by first developing an algorithm using SIMION™ as its core structure to compute ion trajectory at different ratios of electric field to buffer gas number density (E/N). The E/N was varied from a few Td to ~80 Td by using an asymmetric square waveform. The algorithm was then combined with Statistical Diffusion Simulation (SDS) model, columbic repulsion, and a parabolic gas flow profile to realistically simulate current transmission and resolution of the FAIMS. The algorithm was validated using a FAIMS model similar to the Sionex Corporation model SVAC in terms of its dimensions and geometry and selected low mass ions with Ko in the range of 2.17 (m=55) to 1.39 cm2.V−1.s−1 (m=368). Good agreement was achieved between simulated and experimental CV (peak maxima) values, peak width (FWHM), and transmitted ion current Ioutput. The model was then used to study fringe fields in a simple arrangement where a 0.5 mm (w) gap was created between the FAIMS exit and a capillary inlet (i.d = 0.5 mm). At an optimum CV (11.8 V), only ~18% (1.3 pA) of the total ion current that correlate to CV = 11.8V, entered the capillary; bulk of the ion loss was caused by the fringe fields. Current transmission into the capillary was improved, however, by applying a 500V DC bias across w (0.5 mm).
Introduction
Mobility of ions in the gas phase has been measured since the early 1900s for a range of pressures and electric field strengths. 1,2,3,4 Ions were often created through an electrical discharge in purified air. The process, first, forms high energy electrons that subsequently reacts with neutrals of the supporting atmosphere to form a complex mixture of thermalized hydrated proton ions. 5,6 Constituents of the ion mixture were characterized for their individual mobility (K) by propelling ions across a drift region under a weak electric field (< 2Td, where 1 Td = 10−17 V.cm2), against a flow of purified nonreactive buffer gas. Ions reached the detector over a range of arrival time (drift time) with groups of specific ionic species appearing over a narrow spread of drift time. This method of characterizing ions by their mobilities in the gas phase with weak electric field is now referred to as Ion Mobility Spectrometry (IMS). 7,8 Mobility measurements can also be achieved at high field strengths (> 70 Td ) where K becomes a function of E/N (where E is electric field and N is the number density of the buffer gas).4,9 One technique that makes use of the ion mobility at high electric fields is known as Field Asymmetric Waveform Ion Mobility Spectrometry (FAIMS). 10,11 Ions in FAIMS are propelled by an alternating E that was created by an asymmetric waveform, and separated into individual constituents in space according to their mobility differences between the high and low electric fields. Separation of the ions can be achieved in the millisecond time scale in both IMS and FAIMS. This makes the analyzers suitable for explosives detection 12,13,14 and biological warfare agent analyses 15,16,17 owing to their potential to performing near real time monitoring of air composition.18 The mobility measuring capabilities of IMS and FAIMS have also stimulated studies of ion structures in the gas phase 19,20,21 and gas phase orientation of macromolecules.22,23 Moreover, IMS, FAIMS or FAIMS/IMS combination can be readily coupled with mass spectrometry (MS) to acquire orthogonal measurements of both ion mobility and mass to charge ratio (m/z). In certain applications, ion mobility (K) can add confidence to the identification of constituents. 24, 25,26
Initial efforts to couple mobility analyzers to mass spectrometers were hampered by the poor ion transmission efficiency at the interface region and the poor resolution of IMS or FAIMS. Significant improvement in both resolution and sensitivity has been accomplished in recent years for IMS/MS instruments by the use of longer drift tubes and ion funnel interface.27, 28 However, only limited performance improvement has been achieved for FAIMS so far through the use of long planar electrodes (resolution)29 and planar (p-) FAIMS with slit shaped interface (sensitivity). As the effort to develop high sensitivity and high resolution IMS/MS and FAIMS/MS instruments continues, there is a pressing need to develop a comprehensive theoretical model and software tools that can supplement the IMS/MS and FAIMS/MS hardware development. Software tools are valuable in simulating ion motion in these hybrid instruments which incorporate various ion optics configurations and operate under different gas flow conditions. For instance, FAIMS is mostly operated at atmospheric pressure (e.g. high gas density environment). When FAIMS is coupled to MS, a large pressure drop occurs at the interface (e.g. from atmospheric pressure to ~1 Torr in the first MS vacuum chamber). Such a dramatic pressure drop combined with the ion defocusing by the rf fringe-field at the FAIMS exit can cause severe ion loss at the FAIMS/MS interface. Fringe-field may also limit ion transmission between an ion source and FAIMS inlet. Understanding ion motion at the FAIMS interface can provide insights for better instrument design. Such problem can often be effectively handled by simulations.30, 31,32 Although IMS has been modeled with a commercially available software, SIMION, (Scientific Instrument Services, Inc., Ringoes, NJ)33, over a wide range of pressure conditions from atmospheric pressure down to a few Torrs to correctly predict ion drift time profile, achieving the same for FAIMS has been challenging due to the difficulty in calculating the ion mobility in high electric field. As a result, computational studies of FAIMS to date have only been reported with custom developed software. 34, 35, 36, 37 SIMION is a powerful ion optics software capable of calculating ion trajectory in the electric field under different pressure, temperature, gas composition, and electrode geometry conditions.38,39,40,41 However, no algorithms or “user programs” are available in SIMION to allow comprehensive simulation of ion motion in FAIMS under different operating conditions. To make it possible, SIMION's simulation capability needs to be extended to allow ion mobility calculation at different E/N ratios. Ion diffusion in the gas medium also needs to be included to realistically simulate ion trajectory and transmission through the FAIMS.
In a FAIMS device, ions are transported by a carrier gas between two parallel electrodes separated by a narrow gap. When in the gap, ions oscillate along the direction of an alternating electric field created by applying an asymmetric waveform to one of the FAIMS electrode with its amplitude (dispersion voltage) varied between a few Td to ~80 Td or more. In general, ion drift velocity Vd can be expressed as Vd = K.E and the mobility K can be described as7
| (1) |
| (2) |
During the low field period of the asymmetric waveform, FAIMS is operated in a so called “low field limit” to make the α term in equation (1) negligible and K becomes essentially independent of E/N. In contrast, the mobility of ion in the high field period of the asymmetric waveform deviates significantly from its low field limit due to the significant contribution of the α term. The difference in mobility (ΔK = Khigh - Klow) in each waveform cycle causes a net displacement of ions towards one of the FAIMS electrodes and all ions are discharged to the FAIMS electrodes after many cycles of the waveform. Ions of a given ΔK can pass through the FAIMS gap by applying a dc offset (compensation voltage, CV) to one of the FAIMS electrodes to cancel the net displacement of the ions. A plot of CV versus ion current is termed as a FAIMS output spectrum. The measurements of ion CV values at different dispersion voltages (DVs) allow the extraction of α value for the ions. A plot of DV versus α (alpha plot) yields characteristic curves that allow categorization of ions in three types (e.g. A, B or C type). For A type ions, α increases as DV increases but for C type ions α decreases as DV increases. For B type ions, α initially increases as DV increases and then decreases with further increase in DV after reaching a maximum.
The objective of this study is to develop a computational tool that can calculate ion mobility in any field strength, and simulate the motion of all three types of ions over a broad range of E/N. This is demonstrated here through a pilot study using micro-machined p-FAIMS model equivalent to the FAIMS (model SVAC-V) from Sionex (Bedford, MA).42 Ions used for testing the simulation algorithm included low mass hydrated protons/oxygen, amino acids, and ketones with known experimental CV and α2/ α4 values and covered all three ion types. Experimental and simulated CV spectra for these ions were compared for peak position, FWHM and current transmission to validate the simulation. A qualitative study of the fringe-field effect on ion transmission at the exit of the p-FAIMS is also reported using hypothetical geometries including a Faraday plate and a capillary that mimics a MS inlet.
Simulation Model and Procedure
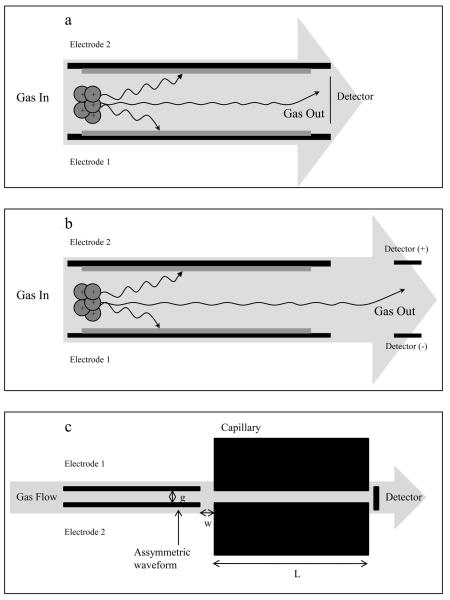
A schematic of the p-FAIMS model used in the simulation is shown in Figure 1a. The p-FAIMS consists of two 15 mm long and 5 mm wide rectangular electrodes separated by 0.5 mm gap. A rectangular asymmetric waveform applied to the bottom electrode was used to create the alternating electric field in the gap. The FAIMS CV was applied to the top electrode. Ions were introduced from the left side of the FAIMS electrodes along the centerline (x axis) of the FAIMS gap with a spatial distribution specified as x = 0.1 mm, y = 0.25 mm and z = 0. When diffusion and space charge were both enabled, the spatial distribution or Time of Birth (TOB) of ions was then set as a “Uniform Distribution” (available in SIMION under the ion direction option) where up to a 1000 ions were continuously propagated over a period equivalent to the ion residence time (tres = 2250 μs). The gas velocity in the FAIMS gap was calculated by using Q/(w*g) where Q is the total carrier gas flow rate, w is the width of FAIMS entrance (5.0 mm) and g is the analytical gap (0.5 mm). A charge collector was placed at the right side (exit, x = 15.0 mm) of the FAIMS electrodes to collect ions and generate a CV spectrum. The model ions used for all the simulations here are listed in Table 1 and were selected because their properties including Ko, α2, and α4 were available in the literature.43,44
Figure 1.
shows three FAIMS models in which the micro-fabricated FAIMS geometry in the model “a”, “b” and “c” are identical (L =15 mm and g = 0.5 mm). The models defer in the detector assembly. In model “a” single vertical detector electrode is placed at 14.99 mm; in model “b” two parallel electrodes (L = 5 mm) separated by 0.5 mm were placed 5 mm away from the FAIMS electrodes; in model 3 the detector electrodes were replaced by a capillary (L = 60 mm and i.d = 0.5 mm) 0.5 mm away from the FAIMS electrodes.
Table 1.
List of ion parameters of ions that were used to validate the SIMION-SDS-FDMC.
| Chemical | Ion | Mass (amu) | Ko (10−4 m2.V−1.s−1) | α2 (Td−2) | α4 (Td−4) |
|---|---|---|---|---|---|
| 1. Hydrated Proton | H+(H2O)3 | 55.00 | 2.34 | 1.78 × 10⁻⁵ | −4.91 × 10⁻¹⁰ |
| 2. Hydroxyproline | (C5H9NO3)H+ | 131.13 | 2.18 | 5.82 × 10⁻⁶ | −1.09 × 10⁻¹⁰ |
| 3. Leucine | (C6H13NO2)H+ | 131.17 | 2.17 | 4.06 × 10⁻⁶ | 0.79 × 10⁻¹⁰ |
| 4. Hydrated Oxygen | O2−(H2O)3 | 86.00 | 2.13 | 1.93 × 10⁻⁵ | −4.30 × 10⁻¹⁰ |
| 5. 2-Propanone (dimer) | (C3H6O)2H+ | 116.16 | 1.85 | 7.44 × 10⁻⁶ | −6.94 × 10⁻¹⁰ |
| 6. 2-Dodecanone (dimer) |
C12H24O)2H+ | 368.62 | 1.39 | −2.16 × 10⁻⁶ | −0.84 × 10⁻¹⁰ |
To study the fringe field effect on ion transmission at FAIMS exit, the charge collector in Figure 1a was replaced with two additional electrodes that were 5.0 mm in length and separated by 0.5 mm gap (Figure 1b). The electrodes were placed 5.0 mm from the FAIMS exit and biased at +5.0 V and −5.0 V to collect negative and positive ions, respectively. To further study fringe field effect on the ion transmission through FAIMS/MS interface, a capillary 15 mm in length and 0.5 mm i.d. was placed at an adjustable distance (w) from the FAIMS exit, as shown in Figure 1c. Hydrated oxygen anions were introduced into the FAIMS gap under the following operating condition: f = 0.8 MHz, DV = 750V, CV = 11.8 V (peak maxima), gas flow of 1.0 L.min−1 and waveform duty cycle (d) = 0.3 where d is defined as the width of the high voltage period of the square asymmetric waveform (Th, μs) over the entire period of the waveform (T, μs).
Simulation Algorithm
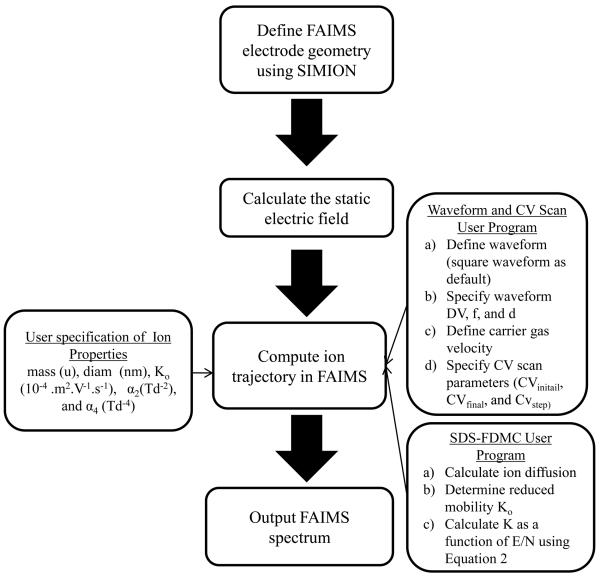
The simulation algorithm uses SIMION 8.0 as the core structure. Figure 2 shows a flow diagram of the simulation process. A 2D FAIMS electrode geometry was first constructed in the SIMION workbench by sketching two parallel plates with a gap of 50 grid units. All the FAIMS electrodes were specified as fast adjustable electrodes to allow rapid field adjustment during ion trajectory calculation. Once the model geometry was established in the SIMION workbench, the static electric potential in the workbench was calculated using SIMION's refine feature. Two user programs were introduced to allow the application of an asymmetric waveform and CV scan to the FAIMS electrodes, the incorporation of statistical diffusion simulation (SDS), and field-dependent mobility calculation (FDMC).
Figure 2.
Shows a flow chart of key computational steps involved in simulating a FAIMS spectrum using SIMION-SDS-FDMC.
In the waveform and CV scan user program, the asymmetric square waveform was defined by four time steps in which two time steps were used to define the low and high field periods of the waveform and the remaining two time steps were used to define the sharp transitions at the edges of the waveform. The number of time steps could be increased through “wave_timesteps” in SIMION workbench window for more precise modeling of the field transition region at the expense of simulation speed. The other relevant parameters including FAIMS carrier gas velocity (m.s−1), CV start, CV end, and stepping voltages (V), DV, d, pressure (Torr), and temperature (K) were defined through a variables tab in SIMION's view/load workbench window. Alternatively, these parameters could also be defined in the “collision_sds.lua” file. Additional parameters related to the ion properties including ion mass (u), ion diameter (nm), reduced mobility (Ko 10−4 m2.V−1.s−1), α2 (Td−2), and α4 (Td−4) were defined in a separate “m_def” file.
In the SDS-FDMC user program, the original SDS algorithm containing the ion diffusion model was modified to allow the calculation of ion mobility K at any E/N according to equation (1). This was achieved by combining the “collision_sds” for original SDS algorithm with the new K calculation in the “accel_adjust” user program segment.
The α2 and α4 values were extracted from the “m_def” files and the mobility of ions was calculated by using Eq. 1 which was truncated at α4 term. The original SDS user program also allows the estimation of reduced mobility Ko based on the ion mass or diameter, if experimental Ko is not available. The feature was retained in the SDS-FDMC user program. The computation details on estimating Ko can be found elsewhere.30
Computational hardware requirements
Simulations were performed on a personal computer equipped with Core Duo CPU 2.33 GHz processor, 2.0 GB RAM and Microsoft Windows XP Professional operating system. Upon the completion of a FAIMS simulation the CV values and ion counts were stored in a Microsoft Excel file “.xls” file and a plot of ion count versus CV was created. A single CV spectrum, including diffusion, can be produced within minutes using the SIMION-SDS-FDMC algorithm. Results from FAIMS analysis is commonly graphed as ion current versus CV or ion current versus DV. For this study, CV and DV are normalized to the gas number density (N = 2.374 x 10 25 cm−3 at 730 Torr and 297 K) and reported in units of Td. Therefore, the terms CV and DV are replaced with compensation electric field (CVE/N) and dispersion electric field (DVE/N), respectively.
Results and Discussion
Dependence of ion motion on the asymmetric waveform in p-FAIMS
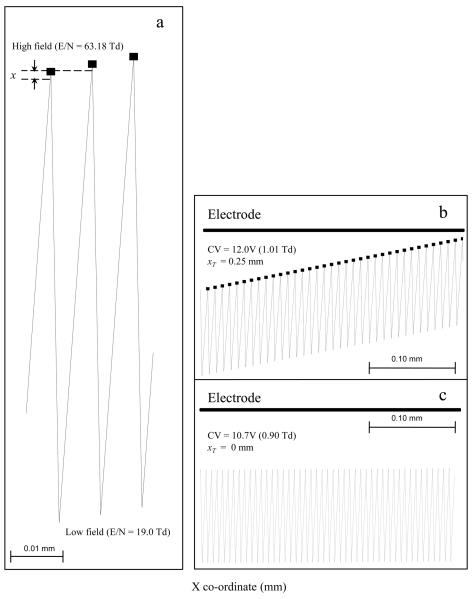
An A type ion, H+(H2O)3, was used to evaluate the SIMION-SDS-FDMC algorithm for computing K(E/N) and predicting the ion trajectory in the p-FAIMS. Ion parameters that were used in the simulations are listed in Table 1. A single H+(H2O) ion was introduced at the center of the FAIMS gap (y = 0.25 mm and x = 0.1 mm) and transported by an uniform air flow (1.0 L.min−1). The asymmetric square waveform (DV = 750 V, d = 0.3, f = 0.8MHz) was applied to the bottom FAIMS electrode and an electric field was established that alternated between 63.2 Td and 21.1 Td with a 1.25 μs period. This caused an oscillation of the H+(H2O)3 ion between the electrodes (Figure 3a) and resulted in a net displacement (xT = 1.0 × 10⁻³ mm) towards the top electrode. Over a lifetime, the ion experienced ~250 cycles of the asymmetric waveform which amounted to a displacement of 0.25 mm that caused the ion to terminate on the electrode surface (Figure 3b). The collision is avoided by applying a proper CVE/N of 0.90 Td (CV = 10.7 V) to the top electrode which causes the ion to oscillate in the center of the gap with xT = 0 (Figure 3c). Successive simulations for a range of CVE/N values showed the ion can be transmitted over a 0.2V window (10.5 V to 10.7 V) when diffusion is neglected.
Figure3.
a. Shows the trajectory of an A type ion, H+(H2O)3, over a few waveform cycles in the p-FAIMS gap that causes a radial displacement per cycle (x) towards the top electrode; b. Summary of the H+(H2O)3 trajectory over several cycles of the waveform with an incorrect CVE/N of 1.01 Td (12.0 V); c. the trajectory with correct CVE/N of 0.90 Td (10.7 V) to allow the ion to travel along the center of the FAIMS gap.
Role of diffusion, space charge and DV on ion transmission efficiency and peak width
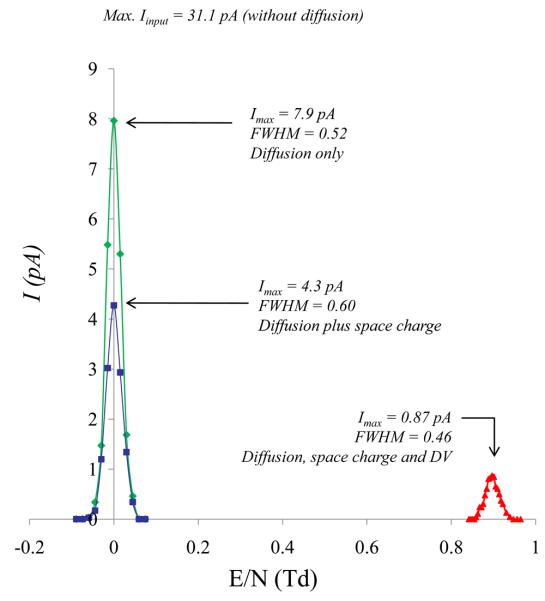
Factors such as diffusion and space charge can spread the ion density in the gap significantly during the ions tres, particularly, for ions that have high diffusion coefficient (D). This may widen the CV range across which ions can be transmitted and consequently broaden the peak width or limit ion current transmission. SIMION-FDMC was combined with SDS algorithm to account for diffusion in the buffer gas and coulombic repulsion among ions. Ion losses in the FAIMS gap, due to diffusion only, were estimated by comparing simulated CV spectrum of H+(H2O)3 with and without the application of SDS algorithm and by disabling the asymmetric waveform (DV = 0V). Figure 4 (green trace) shows that diffusion alone limits ion transmission efficiency in micro-fabricated p-FAIMS to 25.6% ± 0.7%, allowing 8.0 pA to be transmitted through the FAIMS from 31.1 pA input current. Additional ion loss in the gap due to space charge phenomena was investigated by using the coulombic repulsion feature available in SIMION. Coulombic repulsion is an N-body technique that is described in detail elsewhere.33 Briefly, the total charge is partitioned among N charged particles, each of which can carry many charges. Each charged particle imposes coulombic forces on all other particles [on the order of O (N2) interactions]. These forces are superimposed on other forces acting on the particles such as the electric field. The choice of the Iouput (8.0 pA) for space charge study correlates to a maximum experimental current that was reported for micro-fabricated p-FAIMS with square asymmetric waveform under the following conditions: DV = 100V, d = 0.24, f = 0.8MHz, g= 0.5 mm for hydrated proton (m = 55).43 Therefore the Iinput (31.1 pA), assuming a ~74.4% ± 0.7% diffusional loss, correlated to a coulombic charge (Q) of ~7.0 × 10 −14 C where Q = I*tres. Figure 4 also shows a comparison of simulated CV spectrum without (green trace) and with (blue trace) the inclusion of space charge. Key differences include reduction in ion current transmission where space charge alone accounted for 53.8 % ± 0.7% [Ioutput (4.3 pA/ (Iinput (8.0 pA)] decrease in ion current. Therefore, combined diffusion and space charge can limit the ion transmission in micro-fabricated FAIMS to ~14% ± 0.7% [Iinput (4.3 pA)/Ioutput (31.1 pA)]. Moreover, a ~13.5% increase in FWHM was observed with space charge effect but peak width at base remained unchanged (1.8 V). This is because the effect of space charge is significant mainly at the entrance of the FAIMS (only a few fractions of the total tres).
Figure 4.
CV spectra of hydrated proton showing the effects of diffusion, coulumbic repulsion and DV (750V) on Ioutput (pA) and FWHM in micro-fabricated p-FAIMS.
Unlike in cylindrical FAIMS, ion transmission in p-FAIMS can be further reduced by the application of the asymmetric waveform. This was estimated by repeating selected simulations with diffusion, space charge and asymmetric square waveform applied to one of the electrodes. Figure 4 (red trace) shows diffusion, space charge and the asymmetric square waveform combined can limit the transmitted current to less ~1.0 pA which is also accompanied by narrowing of the peak (FWHM = 0.46 V, width at base = 1.1 V). Both the observations can be explained by the elimination of the ions traveling close to the electrode surface when the asymmetric waveform is applied. In summary, diffusion, space charge and the DV in p-FAIMS govern peak width and current transmission but diffusion plays a dominant role on (accounting for ~74.4% current loss) both transmitted current and peak width.
Resolution and sensitivity dependence on gas flow (U)
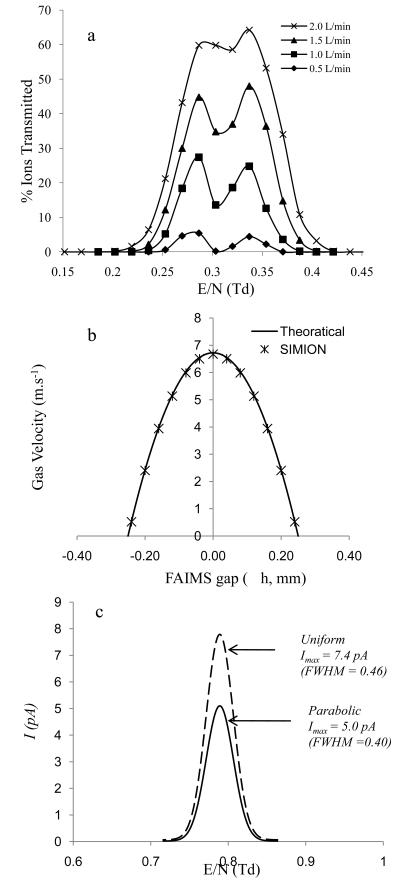
The significant ion losses and peak broadening caused by diffusion suggest that the tres of ions in the gap is a critical parameter and determines both FAIMS resolution and ion transmission efficiency. Under such conditions the peak width (w) can be estimated as .45 This implies that w is proportional to tres−1/2 and that U will significantly influence FWHM through tres. This was studied here by varying the gas flow between 0.5 L.min−1 to 2.0 L.min−1 and analysing Leucine and Hydroxyproline ions that have comparable reduced mobility Ko (Table 1). At 0.5 L.min−1 the resolution for Leucine (0.29 Td) and Hydroxyproline (0.34 Td) was R=12.3 and R = 11.2, respectively. At 2.0 L.min−1 the resolving power decreased to R = 5.0 and R = 5.9 for Leucine and Hydroxyproline, respectively, while the ion transmission efficiency increased by 16 fold (Figure 5a). The decrease in R and increase in ion transmission efficiency can be attributed to the decrease in tres in the gap. For instance, Leucine ions tres decreased from ~4.50 ms at 0.5 L.min−1 to ~1.12 ms at 2.0 L.min−1 which results in less time for the ions to diffuse to the electrode surface and be annihilated.
Figure 5.
a. Plot of CVE/N versus ion transmission for Leucine (0.29 Td, 3.2 V) and Hydroxyproline (0.34 Td, 4.0 V) at various gas flow rates ranging from 0.5 L.min−1 to 2.0 L.min−1; b. Comparison of theoretical (--) and SIMION (*) calculated parabolic flow profile that was derived from Navier-Stokes equation; c. a comparison of CV elution profile of hydrated proton with linear gas flow (--) and parabolic gas flow (—) that was applied across the FAIMS gap (±h).
Since U plays a key role in determining the ion current transmission and FWHM, applying a correct gas velocity profile as opposed to a simple uniform gas speed can be critical in simulating accurate ion transmission and FWHM. Gas flows in pipes or between parallel plates is either in a laminar or turbulent flow regime. Turbulence occurs if the Reynolds number [( where ρ (kg.m−3) is the density of air under standard condition, V (m.s−1) is the free stream velocity and μ (kg.m−1.s−1) is the viscosity of air)] exceeds the Recritical (~2300).46 In micro-fabriacted p-FAIMS, Re << Recritical and the gas flow is considered to be laminar.37 Furthermore, assuming Uy = 0 and Uz = 0 and no-slip condition (i.e the velocity of fluid is zero at the FAIMS electrodes), Navier-Stokes equation can be used to estimate the Ux across g by using the following equation:
| (3) |
where μ (Pa.s) is the viscosity of air, y = ±h (m), h = g/2 (m) and (Pa.m−1) is the pressure drop across the length of the FAIMS. Equation 3 was incorporated into SIMION to acquire Ux across g (Figure 5b) and acquire a CV scan of H+(H2O)3 which was compared with simulations using a constant gas speed of 6.67 m.s−1 across g. Comparison of CV scans (Figure 5c) revealed that a parabolic profile gas speed yields a spectrum with ~65% less ion transmission and 15% narrower peak compared to the uniform gas flow. The narrowing of peak and reduction in ion transmission both can be explained by an increase in ion loss near the electrode region due to an increase in residence time of ions that is caused by the decrease in gas velocity from 6.67 m.s−1 (gap center) to zero (electrode surface) with the parabolic profile.
Predicting FAIMS CV spectrum for A, B and C type ions
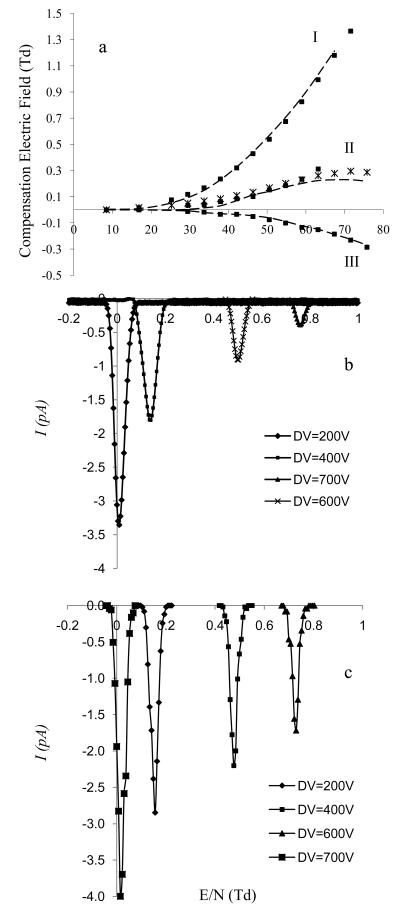
Although, we have demonstrated that the SIMION-SDS-FDMC algorithm can correctly correlate resolution with transmitted ion current under various operating conditions in p-FAIMS, the ability of SIMION-SDS-FDMC algorithm to accurately predict an experimental CV under specific operating conditions is also essential to validate the algorithm. This is demonstrated here using all three known types of ions (Table 1) including O2−(H2O)3 (A type), (C3H6O)2H+ (B type), and (C12H24O)2H+ (C type) across a wide E/N range. Figure 6a shows excellent agreement between experimental (broken lines) and simulated (squares) CVs for A (I) and C (II) type ions while some discrepancy is observed for the B type ion (II). This was corrected (squares) by deriving new alpha values and restricting the fitting of the polynomial function to the experimental data up to DVE/N of ~59 Td rather than ~80Td. SIMION-SDS-FDMC simulation correctly reflects the behavior of ions for all three ion types in p-FAIMS. Comparison was also made between simulated and experimental FWHM, resolution and ion current transmission. Figures 6b and 6c shows experimental (b) and simulated (c) CV spectrum for hydrated oxygen at selected DVE/N [16.9 Td (200V), 33.7 Td (400V), 50.5 Td (600V), and 59.0 Td (700V)]. Simulations were acquired by including diffusion, coulombic repulsion, and parabolic gas flow profile. The average simulated FWHM (0.47 ± 0.05) across the DV is less than the experimental FWHM across the same DV range (0.74 ± 0.05 V). This discrepancy can be explained by the experimental peak broadening due to signal jittering during the CV spectrum averaging process which becomes especially problematic at high E/N where the ion current transmission is low. Discrepancy was also observed between simulated and experimental Ioutput across all DV range and can be explained by the dependence of the diffusion coefficient on the separation field [i.e the longitudinal diffusion coefficient (DL), along the field may be much larger than the tangential diffusion coefficient (DT) across the field]. This may cause additional ion loss to the FAIMS electrodes.
Figure 6.
a shows a comparison of experimental (broken line) and simulated (squares) dispersion plot (CVE/N versus DVE/N) of O2−(H2O)3 (I), (C3H6O)2H+ (II), and (C12H24O)2H+ (III). The DVE/N range translates to ~8Td to ~80 Td; b) shows a comparison of simulated and experimental plot of CVE/N versus ion transmission of O2−(H2O)3 at selected E/N: 16.85 Td (200V), 33.70 Td (400V), 50.55 Td (600V), and 59.0 Td (700V). CV was scanned from 0 V to 14 V, d = 0.3 and f = 0.83 MHz.
Ion motion in the fringe field at p-FAIMS exit
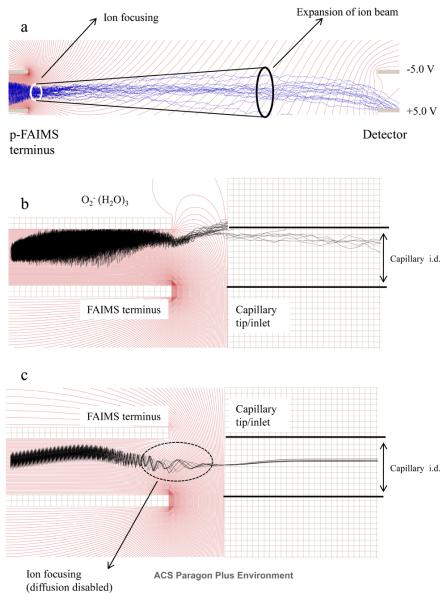
The asymmetric waveform and CV applied to the FAIMS electrodes create a non uniform electric field at the exit of the FAIMS that can potentially skew the trajectory of an ion beam that exit the FAIMS analyzer and prevent it from reaching the detector or entering a MS sampling orifice. To investigate the fringe field effect on the ion trajectory at p-FAIMS exit, the simulation was performed on two modified FAIMS detectors. The first model included two parallel electrodes that was separated by a 0.5 mm gap and were placed 5.0 mm downstream of the FAIMS exit (Figure 1b). The second model included a metal capillary that mimicked the FAIMS/MS interface (Figure 1c). A total of 1000 ions were flown in each configuration under the following conditions: E/N~62 Td (DV = 750 V), d = 0.3, f = 0.8 MHz, and CV = 11.8 V (at peak maxima), and with a uniform air flow of 1.0 L.min−1. At the end of the simulation a static bias of 750V was applied to the top electrode to create a contour plot of constant electric potential lines to visualize the electric field lines that develops when the asymmetric waveform reaches its positive amplitude. The contour plot of electric potential lines was then superimposed with the trajectory of selected hydrated oxygen anions. The simulation results in Figure 7a, corresponding to the configuration in Figure 1b, showed that ions exiting the FAIMS were initially focused, suggesting an ion focusing fringe field at the FAIMS exit. The ion beam expands further downstream owing to diffusion and the transport of ions is mainly governed by gas flow. Most of the ions exiting the FAIMS reach the bottom Faraday plate where the collection of the anion was aided by +5.0 V bias that was applied to the electrode. This part of the simulation indicates that the fringe-field at the FAIMS exit helps to focus ions when a pair of Faraday plate is used as the FAIMS detector. Repeating the simulation by using a metal capillary as the FAIMS detector, corresponding to the configuration in Figure 1c, at the same operating conditions reveals severe ion loss to the top electrode and poor ion transmission into the capillary inlet (Figure 7b). For instance, of the ~7.3 pA ion current exiting the FAIMS, only ~1.7 pA transmitted (CV = 11.8V) into the capillary. With an additional ~0.4 pA ion current loss to the inner wall of the capillary, the total ion transmission efficiency was about 17%. This major loss of hydrated oxygen anions was mainly due to the non uniform fringe field in the FAIMS exit region that caused excessive displacement of the anions towards the top electrode. The simulation indicated that the ion transmission efficiency could be significantly improved by applying a DC bias between the FAIMS electrode and the capillary inlet. As shown in Figure 7c, applying a 500V DC bias to the capillary allowed all the ions that are exiting the p-FAIMS to enter the capillary.
Figure 7.
a shows the effect of fringe field on the transmission of O2−(H2O)3 between the p-FAIMS terminus and the detector plates (Figure 1, model “b”). Figure 7b and c shows the transmission of O2−(H2O)3 between p-FAIMS and the capillary inlet (Figure 1, model “c”) with and without the correction of fringe fields, respectively.
Conclusions
Through this study the SIMION-SDS-FDMC model has been shown to accurately simulate a FAIMS spectrum under a variety of operating conditions. This shows that the model can accurately simulate processes that govern the spatial distribution and transport of the ions in the FAIMS gap. The model also revealed that in p-FAIMS diffusion dominates ion current transmission and resolution, unlike in cylindrical FAIMS where separation and compensation field dominates ion current transmission and resolution. Moreover, the model can be extended to study ion transmission in fringe fields at the terminus of the p-FAIMS. This can potentially help the overall FAIMS-MS system design. Although, the experimental and simulated spectrum were in close agreement the model could be further refined by including anisotropic diffusion where the DL >> DT, improving the space charge calculation by accounting for imaging charge on the electrode surfaces, and accurately accounting for lateral and axial expansion of the ion cloud in the gap by including a 3D geometry with accurate gas flow vectors in the x, y and z direction.
Supplementary Material
Acknowledgements
The authors are grateful to Dr. Alexandre A. Shvartsburg for insightful discussions. This research was supported by the NIH National Center for Research Resources (RR018522). Computational studies were performed in the Environmental Molecular Sciences Laboratory, a DOE national scientific user facility located at the PNNL in Richland, Washington. PNNL is a multi-program national laboratory operated by Battelle for the DOE under Contract DE-AC05-76RLO 1830.
References
- 1.Langevin P. Ann. Chim. Phys. 1903;28:289. [Google Scholar]
- 2.Langevin P. Ann. Chim. Phys. 1905;8:245. [Google Scholar]
- 3.Moseley JT, Gatland IR, Martin DW, McDaniel EW. Phys. Rev. 1969;178:234. [Google Scholar]
- 4.Tyndall AM. Cambridge Physical Tracts. In: Oliphant MLE, Ratcliffe JA, editors. The Mobility of Positive Ions in Gases. Cambridge University Press; Cambridge, U.K.: 1938. [Google Scholar]
- 5.Siegel MW. Atmospheric Pressure Ionization. In: Carr TW, editor. Plasma Chromatography. Plenum Press; New York: 1984. pp. 95–113. chap. 3. [Google Scholar]
- 6.Shahin MM. J. Chem. Phys. 1966;45:2600. [Google Scholar]
- 7.Eieman GA, Karpas Z. Ion Mobility Spectrometry. CRC Press; Boca Raton, FL: 2005. [Google Scholar]
- 8.Kanu AB, Dwivedi P, Tam M, Matz L, Hill HH., Jr. Ion Mobility-Mass Spectrometry. J. Mass Spectrom. 2008;43:1. doi: 10.1002/jms.1383. [DOI] [PubMed] [Google Scholar]
- 9.Buryakov IA, Krylov EV, Nazarov EG, Rasulev UK. Int. J. Mass Spectrom. Ion Processes. 1993;128:143. [Google Scholar]
- 10.Guevremont R. Chrom. A. 2004;1058:3. [PubMed] [Google Scholar]
- 11.Miller RA, Nazarov EG, Eiceman GA, King AT. Sens. Actuators B-Chemical. 2001;67:300. [Google Scholar]
- 12.Ewing RG, Miller CJ. Field Anal. Chem. Tech. 2001;5:215. [Google Scholar]
- 13.Eiceman GA, Stone JA. Anal. Chem. 2004;76:390. doi: 10.1021/ac041665c. [DOI] [PubMed] [Google Scholar]
- 14.Eiceman GA, Krylov EV, Krylova NS. Anal. Chem. 2004;76:4937. doi: 10.1021/ac035502k. [DOI] [PubMed] [Google Scholar]
- 15.Schmidt H, Tadjimukhamedov F, Mohrenz IV, Smith GB, Eiceman GA. Anal. Chem. 2004;76:5208. doi: 10.1021/ac0497611. [DOI] [PubMed] [Google Scholar]
- 16.Prasad S, Schmidt H, Lampen P, Wang M, Gueth R, Rao JV, Smith GB, Eiceman GA. Analyst. 2006;131:1216. doi: 10.1039/b608127d. [DOI] [PubMed] [Google Scholar]
- 17.Prasad S, Pierce KM, Schmidt H, Rao JV, Güth R, Bader S, Synovec RE, Smith GB, Eiceman GA. Analyst. 2007;132:1031. doi: 10.1039/b705929a. [DOI] [PubMed] [Google Scholar]
- 18.Dworzanski JP, McClennen WH, Cole PA, Thornton SN, Meuzelaar HLC, Arnold NS, Snyder AP. Field Anal. Chem. Tech. 1998;1:295. [Google Scholar]
- 19.Clemmer DE, Jarrold MF. J. Mass Spectrom. 1997;32:577. [Google Scholar]
- 20.Robinson EW, Williams ER. J. Am. Soc. Mass Spectrom. 2005;16:1427. doi: 10.1016/j.jasms.2005.04.007. [DOI] [PMC free article] [PubMed] [Google Scholar]
- 21.Koeniger SL, Clemmer DE. J. Am. Soc. Mass Spectrom. 2007;18:322. doi: 10.1016/j.jasms.2006.09.025. [DOI] [PubMed] [Google Scholar]
- 22.Shvartsburg AA, Bryskiewicz T, Purves RW, Tang K, Guevremont R, Smith RD. J. Phys. Chem. B. 2006;110:21966. doi: 10.1021/jp062573p. [DOI] [PubMed] [Google Scholar]
- 23.Shvartsburg AA, Li F, Tang K, Smith RD. Anal. Chem. 2006;78:3304. doi: 10.1021/ac060283z. [DOI] [PubMed] [Google Scholar]
- 24.Koeniger SL, Merenbloom SI, Valentine SJ, Jarrold MF, Udseth HR, Smith RD, Clemmer DE. Anal. Chem. 2006;78:4161. doi: 10.1021/ac051060w. [DOI] [PubMed] [Google Scholar]
- 25.Merenbloom SI, Koeniger SL, Valentine SJ, Plasencia MD, Clemmer DE. Anal. Chem. 2006;78:2802. doi: 10.1021/ac052208e. [DOI] [PubMed] [Google Scholar]
- 26.Tang K, Li F, Shvartsburg AA, Strittmatter EF, Smith RD. Anal. Chem. 2005;77:6381. doi: 10.1021/ac050871x. [DOI] [PMC free article] [PubMed] [Google Scholar]
- 27.Tang K, Shvartsburg AA, Lee Hak-No., Prior DC, Buschbach MA, Li F, Tolmachev AV, Anderson GA, Smith RD. Anal. Chem. 2005;77:3330. doi: 10.1021/ac048315a. [DOI] [PMC free article] [PubMed] [Google Scholar]
- 28.Clowers BH, Ibrahim YH, Prior DC, Danielson WF, III, Belov ME, Smith RD. Anal. Chem. 2008;80:612. doi: 10.1021/ac701648p. [DOI] [PMC free article] [PubMed] [Google Scholar]
- 29.Shvartsburg AA, Li F, Tang K, Smith RD. Anal. Chem. 2006;78:3706. doi: 10.1021/ac052020v. [DOI] [PMC free article] [PubMed] [Google Scholar]
- 30.Appelhans AD, Dahl DA. Int. J. Mass Spectrom. 2005;244:1. [Google Scholar]
- 31.Dahl DA, McJunkin TR, Scott JR. Int. J. Mass Spectrom. 2007;266:156. [Google Scholar]
- 32.Willoughby RC, Sheehan E, Fries D. Proc. 56th ASMS Conf. Mass Spectrometry and Allied Topics; Denver, Colorado: 2008. [Google Scholar]
- 33.SIMION 3D v8.0. Scientific Instrument Services Inc; [Google Scholar]
- 34.Guevremont R, Purves R. J. Am. Soc. Mass Spectrom. 2005;16:349. doi: 10.1016/j.jasms.2004.11.013. [DOI] [PubMed] [Google Scholar]
- 35.Shvartsburg AA, Tang K, Smith RD. J. Am. Soc. Mass Spectrom. 2004;15:1487. doi: 10.1016/j.jasms.2004.06.018. [DOI] [PubMed] [Google Scholar]
- 36.Shvartsburg AA, Tang K, Smith RD. J. Am. Soc. Mass Spectrom. 2005;16:2. doi: 10.1016/j.jasms.2004.09.009. [DOI] [PubMed] [Google Scholar]
- 37.Shvartsburg AA, Tang K, Smith RD. J. Am. Soc. Mass Spectrom. 2005;16:1447. doi: 10.1016/j.jasms.2005.04.003. [DOI] [PubMed] [Google Scholar]
- 38.Lai Hanh., McJunkin TR, Miller CJ, Scott JR, Almirall JR. Int. J. Mass Spectrom. 2008;276:1. [Google Scholar]
- 39.Xu J, Whitten WB. Int. J. Ion Mobil. Spec. DOI 10.1007/s12127-008-0001-x. [Google Scholar]
- 40.May JC, Gillig KJ, Russell DH. Proc. 56th ASMS Conf. Mass Spectrometry and Allied Topics; Denver, Colorado: 2008. [Google Scholar]
- 41.Wouters ER, Splendore M, Senko MW, Syka JEP, Dunyach J. Proc. Proc. 56th ASMS Conf. Mass Spectrometry and Allied Topics; Denver, Colorado: 2008. [Google Scholar]
- 42.Nazarov GE, Coy SL, Krylov EV, Miller RA, Eiceman GA. Anal. Chem. 2006;78:7697. doi: 10.1021/ac061092z. [DOI] [PubMed] [Google Scholar]
- 43.Papanastasiou D, Wollnik H, Rico G, Tadjimukhamedov F, Mueller W, Eiceman GA. J. Phys. Chem. A. 2008;112:3638. doi: 10.1021/jp711732c. [DOI] [PubMed] [Google Scholar]
- 44.Guevremont R, Barnett DA, Purves RW. J. Chem. Phys. 2001;114:10270. [Google Scholar]
- 45.Krylov EV, Nazarov EG, Miller RA. Int. J. Mass. Spectrom. 2007;266:76. [Google Scholar]
- 46.Schlichting H, Gertsen K. In: Boundary-Layer Theory. 8th ed. McGraw-Hill, editor. Springer; New York: 2001. [Google Scholar]
Associated Data
This section collects any data citations, data availability statements, or supplementary materials included in this article.


