Abstract
This work demonstrates a novel, convenient utilization of capillary electrophoresis (CE) instrumentation for the determination of critical micelle concentrations (CMCs). Solution viscosity differences across a range of surfactant concentrations were monitored by hydrodynamically forcing an analyte towards the detector. Upon reaching the surfactant's CMC value, migration times were observed to change drastically. CMC values for four commonly employed anionic surfactants were determined - sodium dodecyl sulfate: 8.1 mM; sodium caprylate- 300 mM; sodium decanoate- 86 mM; sodium laurate- 30 mM; and found to be in excellent agreement with values previously reported in the literature. The technique was then applied to the less well-characterized nonionic surfactants poly(oxyethylene) 8 myristyl ether (CMC ~ 9 μM), poly(oxyethylene) 8 decyl ether (CMC ~ 0.95 mM) and poly(oxyethylene) 4 lauryl ether.
Keywords: Capillary electrophoresis, critical micelle concentration, surfactant, viscosity
1. Introduction
Capillary electrophoresis has proven robust in separating a wide range of analytes owing to high separation efficiencies, excellent resolution, rapid analysis times, and minimal sample requirements. [1,2] Of the techniques available, several variations of micellar electrokinetic chromatography (MEKC) and capillary zone electrophoresis (CZE) have emerged as the most employed modes of electrokinetic separation. MEKC separations utilize background electrolyte (BGE) solutions incorporating one or more surfactants above their critical micelle concentrations. Separation occurs due to the partitioning of analytes between the stationary micellar phase and the bulk aqueous phase. [3] Selectivity in separating neutral and charged analytes with MEKC can be adjusted by the choice of surfactant. Surfactants are also often employed in CZE at concentrations below their CMC to modify electroosmotic flow (EOF) and adjust separation selectivity. [4] Knowledge of a variety of surfactant CMC values is, therefore, highly useful in the field of analytical separations.
Interestingly, the importance of micelle formation has also come to the forefront of numerous commercial endeavors. [5] For instance, the recent response to increased consumer demand for “green” products has lead to vendor reformulation of mass-produced, household detergents. This phenomenon has required manufacturers to determine surfactant properties for numerous novel substances [6] and reinforced the demand for efficient CMC determination methods.
Capillary electrophoresis has continued to be employed in efforts to determine CMC values because of the numerous advantages outlined above. As such, several efficient methods of determining CMC values currently utilize CE instrumentation. Examples of such methods include those based on the retention model [7], the electrophoretic mobility of a marker compound [8] and even the measurement of electrical current as a function of surfactant concentrations. [9]
Prior use of viscometry, concerned with absolute viscosity measurements, has also proven highly useful in efforts to collect surfactant information. [10,11] Capillary-based viscometers, in particular, have been widely employed because they are inexpensive and relatively simple to use.
In this study, an exceptionally convenient method for the determination of CMC values is presented that uses CE instrumentation to monitor relative viscosity changes [12,13] in progressively more concentrated surfactant solutions [14,15]. Characterizations of several well-known surfactants in pure deionized water are used as proof of concept prior to applying this technique to less well-characterized systems.
2. Experimental
2.1 Instrumentation
A P/ACE MDQ Capillary Electrophoresis System (Beckman Coulter, Fullerton, CA) controlled by 32 Karat Software (v. 8.0) was used to carry out all discussed work. All detection was carried out using UV/Vis detection (λ = 214 nm) and constant temperature (T = 25 °C). Fused-silica capillaries (75 μm i.d.) were prepared using materials purchased from Polymicro Tecnologies Inc. (Phoenix, AZ) and conditioned, prior to initial use, with NaOH (1 M) for 10 minutes at 10 psi, and rinsed with deionized water (~ 16 MΩ) for 10 minutes at 10 psi.
Nonionic surfactant purities were determined using an Ionspec FT-MS (Irvine, CA) equipped with an an electrospray ionization source and a Harvard Operators single syringe flow injection system (Holliston, MA). Analyzed samples were prepared in DI water at a concentration of ~ 1 mM. For all analyses, the temperature of the source was 120 °C and the system polarity was kept in the positive mode. The infusion flow rate was between 5 and 10 μL for each of the experiments.
2.2 Chemicals
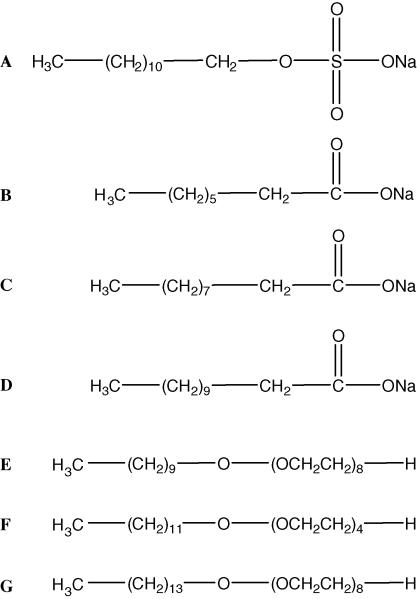
Sodium dodecyl sulfate (SDS) was obtained from Matheson Coleman & Bell Manufacturing Chemists (Norwood, OH). Sodium Caprylate (NaC), sodium decanoate (NaD), sodium laurate (NaL), poly(oxyethylene) 8 myristyl ether (C14E8), poly(oxyethylene) 4 lauryl ether (C12E4) and poly(oxyethylene) 8 decyl ether (C10E8) were acquired from Sigma Aldrich (St. Louis, MO). Structures are given in Figure 1. Nitromethane and sodium hydroxide were purchased from Fisher Scientific (Fair Lawn, NJ).
Figure 1.
Investigated Surfactants. A) Sodium Dodecyl Sulfate (SDS) B) Sodium Caprylate (NaC) C) Sodium Decanoate (NaD) D) Sodium Laurate (NaL) E) Poly(oxyethylene) 8 Decyl Ether (C10E8) F) Poly(oxyethylene) 4 Lauryl Ether (C12E4) G) Poly(oxyethylene) 8 Myristyl Ether (C14E8).
Surfactant stock solutions were prepared daily by dissolving the desired amounts of surfactant in deionized water. Dilutions were carried out into deionized water (DI) to obtain surfactant working solutions of various concentrations.
2.3 Procedures
A previously conditioned capillary was filled with the surfactant solution of interest for 10 minutes at a pressure of 10 psi. Following this step, nitromethane (5% v/v) was injected hydrodynamically (0.5 psi for 3 seconds) and forced through the capillary at a pressure of 1 psi. Following analyte detection, the capillary was rinsed with DI for 10 minutes at a pressure of 10 psi. All migration measurements were carried out in triplicate prior to data processing. Analyte migration times through the capillary media were plotted against employed surfactant concentrations to determine the CMC value for the surfactant of interest.
3. Results and Discussion
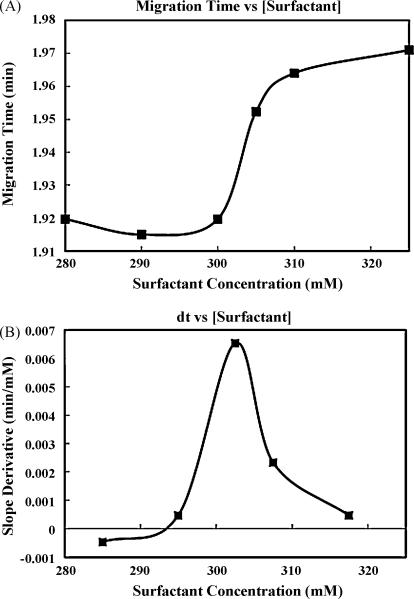
Migration times for nitromethane were recorded in triplicate (RSD < 2% in all cases) and plotted against increasing concentrations of four commonly employed surfactants, SDS, NaL, NaD, and NaC. In each case, migration times were observed to change dramatically within isolated regions of the tested range. One example of these findings is shown clearly in Figure 2A. In this experiment, nitromethane was forced through progressively higher concentrations of sodium caprylate and a substantial increase in migration time was observed to occur at 300 mM, presumably due to a drastic change in the relative viscosity of the surfactant solutions. While Figure 2A clearly demonstrates the change in migration, these findings are demonstrated more effectively by considering the first derivative plot shown in Figure 2B. Upon comparison with the range of previously reported CMC values [16,17] for sodium caprylate, these results were found to be in excellent agreement. Similar comparisons were carried out utilizing this approach to characterize sodium dodecyl sulfate, sodium laurate, and sodium decanoate. In every case, sharp increases in migration were recorded at the previously established CMC value for the investigated surfactant. A summary of these efforts is presented in Table 1, which further illustrates the comparison of our findings to previously reported values and supports this approach as a viable method for the determination of CMC values utilizing CE instrumentation.
Figure 2.
A) Nitromethane migration times, through a 38.5 cm capillary (75 um i.d.), plotted against increasing concentrations of sodium caprylate at 25 °C. B) First derivative of the analyte migration curve.
Table 1.
Comparison of CMC values obtained via the proposed approach with those reported in accepted literature
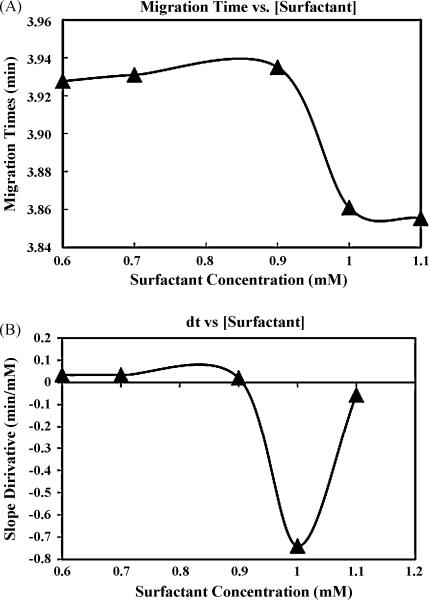
Additional testing of the proposed technique used the nonionic surfactants C10E8, C14E8, and C12E4. The CMC value for C10E8 was determined, as literature values for this compound are somewhat inconsistent. [19,21] These results, plotted similarly to those for sodium caprylate, are shown in Figure 3 and suggest that the critical micelle concentration is ~ 0.95 mM. This CMC is similar to values previously reported as well as CMC values for closely related molecules. [22] Interestingly, upon reaching the CMC, C10E8 displayed a reversed behavior from the surfactants previously discussed. The observation of reduced relative viscosity may indicate that micellization leads to a more compact solution structure. It is believed that this may be caused by reduced surfactant entanglement as the molecules are redistributed within the solution. This idea is consistent with some previous work investigating the interactions of mixed surfactant systems incorporating oxyethylene groups. [23] The results for C14E8 showed a similar viscosity trend as that seen with C10E8 and provided a CMC value of ~ 9 μM. [24] The investigations for C12E4, however, did not reveal a well-defined CMC value; prior work [25] with this neutral surfactant had also revealed anomalous behavior. Electrospray-mass spectrometry revealed that this surfactant was actually a multi-component mixture comprised of a homologous series related to the analyte of interest whereas C10E8 and C14E8 were verified to be single component solutions. This finding suggests that this pressure-driven method may be exceptionally sensitive to sample impurities.
Figure 3.
A) Nitromethane migration times, through a 58 cm capillary (75 um i.d.), plotted against increasing concentrations of C10E8 at 25 °C. B) First derivative of the analyte migration curve.
It should be noted that, given the required precision, the proposed method is likely to be influenced by several variables, including ambient temperature changes, irregularities in system pressure control, alterations in injection timing, etc. As such, accurate use of this procedure demands a well-regulated experimental environment and properly operating instrumentation.
4. Conclusions
The results shown in this work support the use of the proposed technique, based on measuring relative viscosity changes within the capillary environment, as both a logical extension of these earlier efforts and an excellent complement to other CE based methods currently employed for the characterization of surfactants. Additionally, this technique appears to offer several desirable advantages. This approach does not require voltage optimization to accurately determine the CMC, as in the widely used method based on the measurement of electric current. [9] This method can be easily automated and is rapid. Typically, individual data points were collected in less than four minutes following capillary filling. Assuming triplicate injections of 5-8 different surfactant concentrations, total determination of a CMC is achievable in less than five hours. The total sample requirements for this approach are minimal, making this technique amenable to investigations involving isolated biosurfactants or exceptionally expensive materials. Further, CMCs for either ionic or non-ionic surfactants can be obtained without any system alteration. Lastly, this technique does not rely upon the measurement of electroosmotic flow, a parameter which has previously caused some controversy regarding CE based methods of CMC determination. [26]
Acknowledgements
The authors acknowledge Dr. Kevin Parker and Dr. Thomas L. Chester for helpful discussions.
References
- 1.Khaledi MG. High-Performance Capillary Electrophoresis: Theory, Techniques, and Applications. Wiley; New York: 1998. [Google Scholar]
- 2.Li SFY. Capillary Electrophoresis: Principles, Practice, and Applications. Elsevier; Amsterdam: 1992. [Google Scholar]
- 3.Terabe S, Otsuka K, Ichikawa K, Tsuchiya A, Ando T. Anal. Chem. 1984;56:111. [Google Scholar]
- 4.Beckers JL, Bocek P. Electrophoresis. 2002;23:1947. doi: 10.1002/1522-2683(200206)23:12<1947::AID-ELPS1947>3.0.CO;2-M. [DOI] [PubMed] [Google Scholar]
- 5.Mccoy M. Chem. Eng. News. 2009;87:13. [Google Scholar]
- 6.Rein L. The Washington Post. 2007 March 23rd;:B1. [Google Scholar]
- 7.Khaledi MG, Smith SC, Strasters JK. Anal. Chem. 1991;63:1820. doi: 10.1021/ac00017a029. [DOI] [PubMed] [Google Scholar]
- 8.Martin PR, Prieto G, Rega C, Varela LM, Sarmiento F, Mosquera V. Langmuir. 1998;14:4422. [Google Scholar]
- 9.Cifuentes A, Bernal JL, Diez-Masa JC. Anal. Chem. 1997;69:4271. [Google Scholar]
- 10.Aniansson EAG, Wall SN, Almgren M, Hoffman H, Kielmann I, Ulbricht W, Zana R, Lang J, Tondre C. J. Phys. Chem. 1976;80:905. [Google Scholar]
- 11.Priyanto S, Ali Mansoori G, Suwono A. Chem. Eng. Sci. 2001;56:6933. [Google Scholar]
- 12.Bello MS, Rezzonico R, Righetti PG. J. Chrom. A. 1994;659:199. [Google Scholar]
- 13.Cragg LH, Van Oene H. Can. J. Chem. 1961;39:203. [Google Scholar]
- 14.Sata N, Tyuzyo K. Bulletin Chem. Soc. Japan. 1953;26:177. [Google Scholar]
- 15.Tyuzyo K. Colloid and Polymer Sci. 1961;175:40. [Google Scholar]
- 16.Akhter MS. Colloids Surf. A. Physiochem. Eng. Aspects. 1997;121:103. [Google Scholar]
- 17.Gonzalez-Perez A, Ruso JM, Prieto G, Sarmiento F. Langmuir. 2004;20:2512. doi: 10.1021/la035724d. [DOI] [PubMed] [Google Scholar]
- 18.Akhter MS, Al-Alawi SM. Colloid Surface A. 2000;164:247. [Google Scholar]
- 19.Merta J, Garamus VM, Kuklin AI, Willumeit R, Stenius P. Langmuir. 2000;16:10061. [Google Scholar]
- 20.Chirita CN, Necula M, Kuret J. J. Bio. Chem. 2003;278:25644. doi: 10.1074/jbc.M301663200. [DOI] [PubMed] [Google Scholar]
- 21.Daniel RC, Berg JC. J. Colloid Interface Sci. 2003;260:244. doi: 10.1016/s0021-9797(02)00148-0. [DOI] [PubMed] [Google Scholar]
- 22.Hinze WL, Pramauro E. Crit. Rev. Anal Chem. 1993;24:133. [Google Scholar]
- 23.Koshy L, Saiyad AH, Rakshit AK. Colloid Polym. Sci. 1996;274:582. [Google Scholar]
- 24.Tabata Y, Ueno M, Meguro K. J. Am. Oil Chem. Soc. 1984;61:1123. [Google Scholar]
- 25.Schneiderman E. Cyclodextrin Versatility; Part 1: Binary and Ternary Cyclodextrin Complexes with Nonionic Surfactants; Part 2: Utilization of Sulfated beta-Cyclodextrin in Preparative Electrophoretic Chiral Separation of Ritalin Enantiomers. University of Cincinnati; 2001. p. 108. Ph.D. Dissertation. [Google Scholar]
- 26.Morigaki K, Walde P, Misran M, Robinson BH. Colloids Surf A: Physicochem. Eng. Aspects. 2003;213:37. [Google Scholar]


