

Abstract
The activity of a protein can be reversibly modulated by post-translational, covalent modifications, such as phosphorylation and dephosphorylation. In many cases, the modulated protein may be phosphorylated by the same kinase on many different amino acid residues. Such multisite phosphorylations may occur progressively (during a single binding event of kinase to substrate) or distributively (the kinase dissociates from its substrate after each phosphorylation reaction). If a protein is phosphorylated by a distributive multisite mechanism, then the net activity of a population of these protein molecules can be a highly nonlinear function of the ratio of activities of the kinase and phosphatase enzymes. If the multiply phosphorylated protein is embedded in a positive feedback loop with its kinase and/or phosphatase, then the network may exhibit robust bistable behavior. Using numerical simulations and bifurcation theory, we study the properties of a particular bistable reaction network motivated by the antagonistic relationship between cyclin-dependent kinase and its multiply phosphorylated target, Cdh1, which is involved in the degradation of cyclin molecules. We characterize the bistable switch in terms of (i) the mechanism of distributive phosphorylation (ordered or disordered), (ii) the number of phosphorylation sites on the target protein, (iii) the effect of phosphorylation on the target protein (abrupt or progressive inactivation), and (iv) the effects of stochastic fluctuations in small cells with limited numbers of kinase, phosphatase and target proteins.
Keywords: distributive phosphorylation, positive feedback, double-negative feedback, bifurcation diagram, stochastic simulation, cyclin-dependent kinase, cyclin B, Cdh1
Introduction
Cellular proteins are often subject to post-translational modifications like phosphorylation (Manning et al., 2002), acetylation (Mellor, 2006), hydroxylation (Schofield and Ratcliffe, 2004) and ubiquitinylation (Hershko and Ciechanover, 1998). These covalent modifications are made on specific amino acid residues of the target protein by modifying enzymes (kinases, methylases, etc.). Usually the modifications are removed by another enzyme working in the opposite direction (phosphatases, demethylases, etc.). Often the same type of modification happens at more than one amino acid of the target protein, a phenomena called multisite modification.
Post-translational modifications change the biochemical properties of the target protein. For example, the phosphorylation of a transcription factor may exclude it from the nucleus (see e.g. (Moll et al., 1991). In this way, reversible covalent modification of proteins provides a fast and efficient way to regulate protein functions, and it is used to control all basic cellular processes, including metabolism, signaling, motility, growth, proliferation, differentiation, organelle trafficking and membrane transport.
The most characteristic example of reversible, multisite protein modification is phosphorylation and dephosphorylation by protein kinases and phosphatases. Like any other multisite modification, multisite phosphorylation can happen via a processive or distributive mechanism (Gunawardena, 2005). During processive phosphorylation, the kinase phosphorylates more than one amino acid residue on its substrate during a single binding event. Therefore the kinetics of a processive mechanism is not essentially different from a single phosphorylation event. In contrast, under the distributive rule, only one phosphorylation takes place during a single enzyme-substrate binding event. After the substrate is phosphorylated, the kinase dissociates from its substrate and then must bind anew at a different site of phosphorylation. A distributive mechanism is said to be disordered or ordered if the kinase phosphorylates the target sites randomly or in a specific sequence, respectively. Of course, the mechanism of dephosphorylation may also be either processive or distributive (ordered or disordered).
Because multiple binding events occur during a distributive mechanism, a sigmoidal signal-response curve was expected between the phosphorylation state of the target protein (the response) and the ratio of kinase activity to phosphatase activity (the signal) (Ferrell, 1996). However, an analytical study of the ordered distributive case revealed a more complex story (Gunawardena, 2005). The fraction of the target protein in the maximally phosphorylated form (fN) is maintained close to zero below a threshold (θ) of the kinase/phosphatase ratio (KT/HT). The value of θ increases with the number of phosphorylation sites N. Close to the threshold, fN increases abruptly from 0 to 0.5. Above the threshold, fN increases gradually (hyperbolically) from 0.5 to 1 with increasing KT/HT. Therefore multisite phosphorylation makes a good threshold, but it is a poor switch (in Gunawardena's terminology).
Our interest in multisite phosphorylation stems from the fact that many cell-cycle regulatory proteins are multiply phosphorylated by cyclin-dependent kinase (CDK). Examples include Wee1 (Kim and Ferrell, 2007; Mueller et al., 1995), Cdc25 (Kumagai and Dunphy, 1992), Sic1 (Verma et al., 1997) and Cdh1 (Zachariae et al., 1998). During progression through the cell cycle, these proteins undergo characteristic shifts, easily visible on polyacrylamide gels, between their unphosphorylated and heavily phosphorylated forms. The possible roles of multisite phosphorylation of these proteins have been considered in several papers from Qu's group (Qu et al., 2003; Yang et al., 2004). They showed that multiple phosphorylation of regulatory proteins like Cdc25 and Sic1 can produce sigmoidal response curves (Cdc25 activity as a function of CDK activity). When these proteins are coupled in positive and negative loops back to CDK, the networks generate interesting emergent behavior, such as bistability and limit cycle oscillations.
To understand and extend this pioneering work, we undertook a close analysis of the properties of multisite phosphorylation chains in isolation and embedded in positive feedback loops. In this paper, we will review how simple mass-action kinetics of elementary phosphorylation events can generate highly nonlinear signal-response curves (fN versus KT/HT) when the target is distributively phosphorylated on multiple sites. Then we use these results to study the emergent properties of bistability and hysteresis in the double-negative feedback loop between CDK and Cdh1. This example is of great significance for cell cycle regulation (Tyson and Novak, 2008). Of course, similar examples could be given from other aspects of cell physiology (metabolism, motility, etc.) and for other sorts of covalent modifications (methylation, hydroxylation, etc.). In all cases, the basic principles are the same.
Results
Steady-state distribution of phosphoforms
Let us consider a protein X with N phosphorylation sites, and let XP0, XP1, …, XPN refer to the different phosphorylated forms. For simplicity, we assume that the sum of the concentrations of all forms of X is constant: [XP0] + [XP1] + …+ [XPN] = XT = constant. We assume that the phosphorylation and dephosphorylation reactions are distributive. Let k and h denote the activities of the kinase and phosphatase, respectively (activity = probability of an event per unit time per unit concentration of substrate). We assume that these activities are independent of the phosphorylation state of the substrate, XPi.
For an ordered distributive mechanism (Fig. 1A, top), the net phosphorylation rate is the same for each step of the chain, and the same is true of the net dephosphorylation rate. Assuming that these rates are limited by the binding of enzyme to substrate, we write vphos = kassoc · [K] · [XPi] and vdephos = hassoc · [H] · [XPi]. If the enzyme-substrate complexes are so short-lived that their concentrations can be neglected compared to KT and HT, then we can assume that vphos = k · [XPi] and vdephos = h · [XPi], where k = kassoc KT and h = hassoc HT.
Figure 1. Steady state distributions of the modified forms of a protein that is multiply phosphorylated by an ordered (A) or a disordered (B) mechanism.

Assuming 10 phosphorylation sites on X, we plot the relative distribution of the phosphoforms, [XPi]/XT, as functions of the kinase-to-phosphatase ratio, k/h.
For a disordered mechanism (Fig. 1B, top), the rates of phosphorylation and dephosphorylation depend on the number of unphosphorylated and phosphorylated sites, respectively, on the substrate. With the same assumptions in the previous paragraph, the rates of phosphorylation and dephosphorylation of XPi are given by (N−i) · k · [XPi] and i · h · [XPi], respectively.
If kinase and phosphatase activities are constant in time, the phosphorylation chain will approach a steady state in which the concentrations of the various phosphorylated forms no longer change with time. For an ordered distributive mechanism, the steady state concentrations are given by
| (1) |
These fractions are plotted as functions of k/h in Fig. 1A (bottom). At low and high values of k/h, the dominant species are the unphosphorylated and the fully phosphorylated forms, respectively. When k = h, the different phosphoforms are uniformly distributed.
For a disordered mechanism, the steady-state concentrations of phosphoforms are given by (Salazar and Hofer, 2007):
| (2) |
These fractions are plotted on Fig. 1B (bottom). Intermediate phosphoforms are more abundant in the disordered mechanism than in the ordered one, and the unphosphorylated and fully phosphorylated forms are negligible when k = h.
Stepwise activity change of the multiphosphorylated protein
Phosphorylation can increase or decrease the biological activity of the target protein. The most important question in regard to multisite phosphorylation is how does the activity of the target protein depend on its phosphorylation state? Unfortunately, few experimental measurements address this crucial question. From a theoretical point of view, the simplest option is that the activity of protein X changes abruptly after a certain number of phosphorylations (let this number be denoted q). In this case, the phosphorylation chain is divided into two parts (0, 1, … q, and q+1, q+2, …, N), with one part representing the active forms and the other part representing the inactive forms. We define XI as the sum of the concentrations of XP0, XP1, …, XPq, and XII as the sum of the concentrations of the remaining species; of course, XII = XT − XI.
From Eq. (1), we derive for the ordered mechanism:
| (3) |
The activity of X is
| (4) |
in the case where phosphorylation inactivates or activates X, respectively.
In Fig. 2A we plot Xa/XT = XI/XT as a function of k/h given by Eq. (3) for N = 10 and for increasing values of q. Notice that for large values of q, multisite phosphorylation of X provides, as expected (Gunawardena, 2005), a sharp threshold for inactivation but a ‘soft landing’ as Xa approaches 0.
Figure 2. Activity profiles for inactivation of a protein after q sites have been phosphorylated.

We plot Xa/XT = XI/XT as a function of k/h, as given by Eq. (3) for an ordered distributive mechanism (A) and by Eq. (5) for a disordered distributive mechanism (B). In either case, N = 10 and q is varied between 0 and 8. The value of q is given in the circle superimposed on each curve.
For the disordered mechanism,
| (5) |
In Fig. 2B we plot Xa/XT as a function of k/h for the case of inactivation of X by disordered distributive phosphorylation, with N = 10 and increasing values of q. In the disordered case, the activity curve is still ‘sigmoidal’, but the threshold is not nearly as sharp as and the landing is even softer than the ordered distributive mechanism.
Multisite phosphorylation with multiplicative activity changes
In this section we assume that the activity of X changes by a constant multiple α with each additional phosphorylation. If 0 < α < 1, then X is inactivated by phosphorylation, whereas α > 1 corresponds to activation by phosphorylation. With this assumption the weighted activity of X for the ordered mechanism is:
| (6) |
where Ω = 1 for 0 < α < 1, and Ω = α−N for α > 1. (Ω is a normalization constant, introduced so that the highest activity form of X has a relative weight of 1.) For the disordered mechanism:
| (7) |
In Figs. 3A and B we plot the activity curves, Xa/XT as a function of k/h, given by Eqs. (6) and (7) for N = 10 and increasing values of α between 0 and 1 (the case where phosphorylation inactivates X).
Figure 3. Weighted activity profiles for inactivation of a protein by a factor α < 1 with each successive phosphorylation.

We plot Xa/XT as a function of k/h, as given by Eq. (6) for an ordered distributive mechanism (A) and by Eq. (7) for a disordered distributive mechanism (B). In either case, N = 10 and α is given the value in the circle superimposed on each curve.
Embedding multisite phosphorylation within feedback loops
As we show in Figs. 2 and 3, multisite phosphorylation by a distributive mechanism (either ordered or disordered) can produce sigmoidal response curves for activation or inactivation of the target protein as a function of the kinase-to-phosphatase ratio. When these nonlinear response curves are embedded in feedback loops (either positive or negative), they can generate new dynamical features (toggle switches or clocks) of immense significance for information processing by living cells (Tyson et al., 2003). We will illustrate these features with examples from cell cycle regulation.
Bistability by embedding X in a double-negative feedback loop
In this case, we assume that the multiphosphorylated protein X is part of an antagonistic (‘double negative’) feedback loop with its kinase K. In a double-negative feedback loop, two regulatory components have negative effects on each other (Ferrell, 2002), which is quite similar to a traditional positive feedback loop where both components activate each other. Both positive and double-negative feedback loops can create alternative stable steady states (bistability), provided the feedback loops are characterized by sufficient nonlinearity (Tyson et al., 2003). Our goal here is to determine the conditions under which multisite phosphorylation can provide the required nonlinearity for bistability in a double-negative feedback loop.
We suppose that protein X promotes degradation of the kinase K that inactivates it (Fig. 4, top). Our paradigm for this motif comes from eukaryotic cell cycle control, where the Cdh1 subunit of a ubiquitin ligase, APCCdh1 (X in this paper), is inactivated by a cyclin-dependent kinase, CDKCycB (K in this paper) (Zachariae et al., 1998), and APCCdh1 destroys the kinase activity by labeling (ubiquitinylating) its cyclin subunit, CycB, for degradation by proteasomes (Schwab et al., 1997).
Figure 4. Multisite phosphorylation in a double-negative feedback loop.

Top: we assume that X is inactivated by phosphorylation and the active forms of X promote the degradation of the protein kinase, K. For fixed values of K, the steady state activity of X (the solid line) is given by Eq. (3) in the ordered case (A) and Eq. (5) in the disordered case (B). For fixed values of Xa, the steady value of K (the dashed line) is given by Eq. (9). Parameter values: κs = 0.02, κd = 0.02, κa = 0.98, XT = 1, N = 10, q = 0, h = 0.1 (ordered) or 0.5 (disordered).
The APC and CDK subunits are present in excess, so their cofactors, Cdh1 and CycB, are determinative of the ubiquitin ligase and protein kinase activities of X and K, respectively. Assuming a constant rate of synthesis (κs) of CycB and an X-dependent rate of degradation of CycB, we write the following differential equation for the time rate of change of K = [CDKCycB]:
| (8) |
where κd is the first-order rate constant for the ‘basal’ degradation of K, and κa is the second-order rate constant for the degradation of K induced by the active forms of X. The kinase activity, k, in Eqs. (1-7) is always proportional to K in Eq. (8). Without loss of generality, we can take the proportionality constant to be 1 and use k and K interchangeably. The steady state level of K from Eq. (8) is simply
| (9) |
The dynamic features of a double-negative feedback loop are conveniently illustrated in a ‘pseudo-phase plane’ spanned by K and Xa (Fig. 4, bottom). In Figs. 4A and B we plot, with a solid line, Xa as a function of K from Eqs. (3+4) and (5+4), respectively, for q = 0. In both panels of Fig. 4, the dashed line is K as a function of Xa from Eq. (9). Since both the solid and dashed lines have been derived under steady state assumptions, the intersections of the two curves represent steady state solutions of the full set of differential equations describing the reaction network. (However, because Xa is a composite variable, the solid curves are not ‘nullclines’ in the sense that dXa/dt = 0. Hence, one must not misinterpret these diagrams as phase planes that predict trajectories of the dynamical system.) As a consequence of multiple phosphorylation, the solid line has a sigmoidal shape, which can intersect more than once with the hyperbolic dashed line. In case of three intersections, the two extremes are stable steady states separated by an intermediate unstable steady state.
Whether the curves intersect in 1, 2 or 3 points depends on the values of the parameters characterizing the protein interaction network, such as h (phosphatase activity) and q (inactivation threshold). These dependencies are captured in bifurcation diagrams. Figure 5 shows that, for either an ordered or disordered mechanism, the activity of CDKCycB (K) is a Z-shaped function of phosphatase activity (h). Along the upper branch, CycB (K) is abundant and Cdh1 (X) is largely phosphorylated and inactive. Along the lower branch, CycB level is low because Cdh1 is largely unphosphorylated and active. The middle branch is a locus of unstable steady states (saddle points), which coalesce with the upper and lower branches of stable steady states (nodes) at two distinct saddle-node (SN) bifurcation points.
Figure 5. One-parameter bifurcation diagrams for a double-negative feedback loop with multisite phosphorylation by an ordered (A) or disordered (B) distributive mechanism.

The steady state level of kinase (K) is plotted against the phosphatase activity (h) for different thresholds (q). Parameter values: κs = 0.02, κd = 0.02, κa = 0.98, XT = 1, N = 10.
We may identify these one-parameter ‘bifurcation diagrams’ with physiological ‘signal-response curves’, which express how CDK activity responds to signaling through the phosphatase activity (Tyson et al., 2003). From these diagrams it is clear that multisite phosphorylation embedded in a double-negative feedback loop can create a bistable signal-response curve. By toggling back and forth between the low-CDK and high-CDK states, this particular network can switch a proliferating cell line between the G1 phase of the cell cycle (unreplicated chromosomes) and the S/G2/M phase (DNA synthesis and mitosis).
For both ordered and disordered mechanisms, the range of bistability is larger if the inactivation threshold (q) is lower (see Fig. 5). This effect is illustrated on the two-parameter bifurcation diagrams in Fig. 6A. It is interesting to notice that the largest range of bistability arises when q = 0, i.e., when the first phosphorylation step inactivates protein X. If X had only a single site whose phosphorylation inactivates the target, then its activity would be Xa = XTh/(h+K), which is a hyperbolic function of K and can have only a single intersection with K's steady-state curve, Eq. (9). Consequently, bistability is impossible if X has only one phosphorylation site which inactivates it, but bistability is possible (and very robust) when X has multiple phosphorylation sites and yet only one phosphate group is necessary to inactivate it. Clearly bistability is an emergent phenomena generated by multiple phosphorylation of the regulatory protein. The extra phosphorylation sites have no influence on X activity but they make the transition between active and inactive forms highly nonlinear (sigmoidal). This reasoning suggests that, for q = 0, the bistable zone will increase with increasing N, as confirmed in Fig. 6B.
Figure 6. Two-parameter bifurcation diagrams for a double-negative feedback loop with multisite phosphorylation.

(A) q versus h; (B) N versus h; other parameters as in Fig. 5.
Very similar results hold for the case where the activity of X decreases by a constant factor α with each successive phosphorylation. For details, see Supplementary Material A.
Stochastic effects on the bistable switch
A bistable system has two attracting stable steady states for intermediate values of phosphatase activity, h1 < h < h2 (see Fig. 5). To switch from one stable state to the other, either the state variables (K and Xa) must be perturbed sufficiently to cross the boundary between the domains of attraction of the two stable steady states, or the phosphatase activity must be moved outside the bistable domain (h < h1 or h > h2) and then back to its original value. Although these statements are true for a deterministic system (large numbers of molecules) described by ordinary differential equations, they must be modified for a stochastic system, like a single yeast cell, where the numbers of molecules may be small. In such cases, stochastic fluctuations in state variables or ‘parameters’ (e.g., phosphatase activity) may induce unexpected transitions between the alternative stable steady states (Paulsson, 2004).
Stochastic simulations of our multisite phosphorylation model of a bistable switch can be implemented, without further ado, by Gillespie's algorithm (Gillespie, 2007) because the underlying reaction mechanism is formulated in terms of elementary (first and second order) reactions described by the law of mass action. (In this case, of course, we are no longer using the pseudo-steady state approximation on the multisite phosphorylation chain, but rather we describe each phosphorylation and dephosphorylation event as an elementary reaction.)
We have carried out stochastic simulations of K and X, the numbers of molecules of CycB and Cdh1, assuming that H, the number of molecules of phosphatase, is fixed at different values. (See Supplementary Material B for details, such as the definition of V = cell volume.) In Fig. 7 we visualize the probability distribution of time spent in each integer-value of K, during a lengthy stochastic simulation. These time distributions are superimposed on the one-parameter bifurcation diagram of the deterministic system. The color code represents the logarithm (base 10) of time spent in each K state. For each (fixed) value of H, stochastic simulations were started from a stable steady state of the deterministic system (either the lower steady state or the upper steady state in the bistable region).
Figure 7. Effect of the number of molecules on the behavior of the switch.
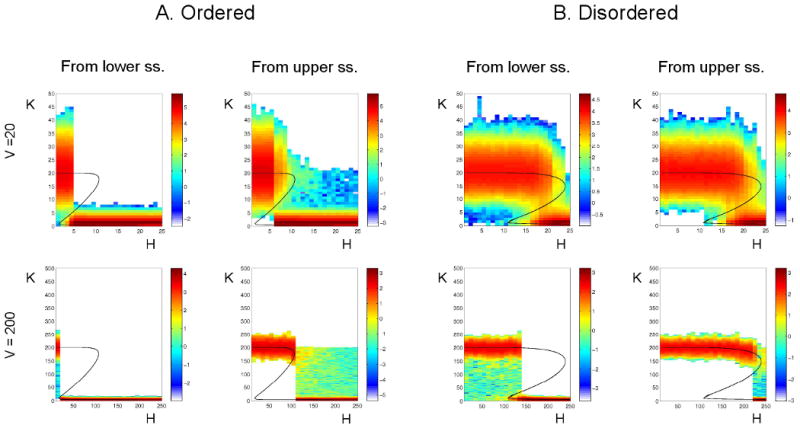
Stochastic simulations of the double-negative feedback loop, for distributive phosphorylation (Panel A: Ordered, and Panel B: Disordered), with N = 10 and q = 0. Top row: V = 20 (small cell); bottom row: V = 200 (large cell). In each panel, the left column corresponds to initializing the stochastic simulations in the lower steady state predicted by the deterministic equations, and the right column to initializing in the upper steady state. In each simulation H is held fixed at the number of molecules indicated on the abscissa. In panel A, the total time of each simulation is 106 arbitrary time units; in panel B it is 105 au. During each of these simulations, we record the total time, Ti, spent with a particular number, i, of kinase molecules, and we plot these times using a color code to indicate log10(Ti). Parameter values: κs = 0.02, κd = 0.02, κa = 0.98
For a large number of molecules (Fig. 7, lower panel; V = XT = 200), the stochastic double-negative feedback system operates as predicted by the deterministic model, switching between the two alternative stable steady states as H crosses the SN bifurcation points. However, when the number of molecules is small (Fig. 7, upper panel; V = XT = 20), the bistable region is effectively wiped out by noise, and the feedback system behaves more like an ultrasensitive switch.
Very similar results hold for the case where the activity of X decreases by a constant factor α with each successive phosphorylation. For details, see Supplementary Material A.
Time scales in stochastic simulations of a bistable system
In the previous section we showed that a double-negative feedback loop, which is predicted to be bistable in a deterministic context, may not appear to be bistable in a stochastic simulation. This conclusion depends very much on the time scale over which observations are made. To understand why, we plot in Fig. 8 the mean ‘first passage time’ (FPT) for transitions from one stable steady state to the other of the double-negative feedback loop. To calculate the FPT distribution, we initialize the system at one steady state of the deterministic network and run a stochastic simulation until the system first reaches the value of K given by the other steady state of the deterministic network. We record this time as one sample of the FPT distribution, and we repeat the process until we have collected enough samples to compute the mean of the FPT distribution. In Fig. 8 we plot, for both ordered and disordered mechanisms, the mean FPT from the upper steady state to the lower and vice versa, for fixed integer values of H spanning the bistable region. These calculations are done for V = 20 (i.e., XT = 20, and K = 20 in the upper steady state).
Figure 8. Mean first passage time between deterministic steady states.
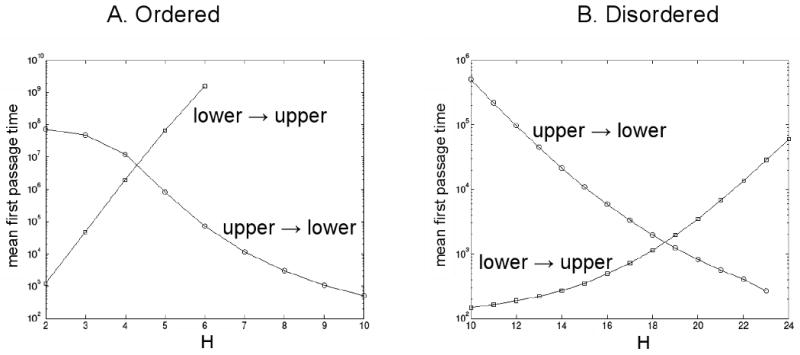
Stochastic simulations of the double-negative feedback loop with distributive phosphorylation according to an ordered (A) or disordered (B) mechanism. Parameter values: N = 10, q = 0, κs = 0.02, κd = 0.02, κa = 0.98. Open circles: for each fixed value of H, a stochastic simulation is initialized in the upper steady state (according to the deterministic equations) and run until the fluctuating value of K first reaches its lower steady state value. This time is one sample of the first passage time (FPT) distribution. Many such stochastic simulations are run until the mean of the FPT distribution can be estimated. Open squares: Similar, except that each simulation is initialized at the lower steady state and run until K first reaches its upper steady state value.
Consider the case of ordered distributive phosphorylations (Fig. 8A). For H < 4, it is quite likely that, during a total time of 106 au (arbitrary units), the system will jump from the lower steady state to the upper steady state but will not jump back again. Similarly, for H > 6, the system will jump from the upper steady state to the lower steady state but not back again. For H = 4, there will be some jumps from the lower to the upper steady state but hardly any in the reverse direction; and for H = 5, there will be some jumps from the upper to the lower steady state but none in the reverse direction. These expectations are confirmed by the distributions in Fig. 7A, which are calculated over a total time of 106 au.
For the disordered mechanism, the transitions between steady states occur much more frequently (Fig. 8B). Hence, for V = 20 and total time = 105 au, the molecular distributions in Fig. 7B look much more like true, steady-state probability distributions with a bimodal distribution of kinase molecules in the region of H values where the deterministic system is bistable.
It should be clear by now that whether a stochastic system appears to be bistable or not depends on the time scale over which it is observed relative to the MFPT (mean first passage time) from one stable steady state to the other. If the relevant time scale of a process is much less than the MFPT of the stochastic system, then the steady state appears to be perfectly stable. But if the relevant time scale is longer than the MFPT, then the system makes spontaneous transitions out of the steady state, and hence the system does not behave as expected.
We illustrate this principle in Fig. 9 where we ask if the double-negative feedback loop can function as a toggle switch in response to changing values of H. We consider the case of ordered distributive phosphorylation with V = 20, i.e., small numbers of molecules. In each panel of Fig. 9, we start a stochastic simulation with H = 0 and K = 20, and we increase H by 1 molecule every Δt time units, until H = 20. The contours in each panel indicate the distribution of K molecules throughout the entire simulation. If Δt is small, say < 103, then the system stays close to the upper steady state until H exceeds 10 (the SN bifurcation point), and then the system flips to the lower steady state, exactly as predicted by the deterministic model. Premature transitions from the upper to the lower steady state are rare because H is changing on a time scale much faster than the MFPT for spontaneous transitions (Fig. 8A). If Δt is large, say > 103, then the system begins to make the transition prematurely. Indeed, when Δt ≈ MFPT (Ĥ), then the system tends to make the switch at H = Ĥ instead of at H = 10. Similar behavior is observed (see Supplementary Figure A3) when we start each simulation at H = 20, K = 0, and decrease H by 1 molecule every Δt time units, until H = 0.
Figure 9. Response of the stochastic double-negative feedback loop to increasing levels of phosphatase.
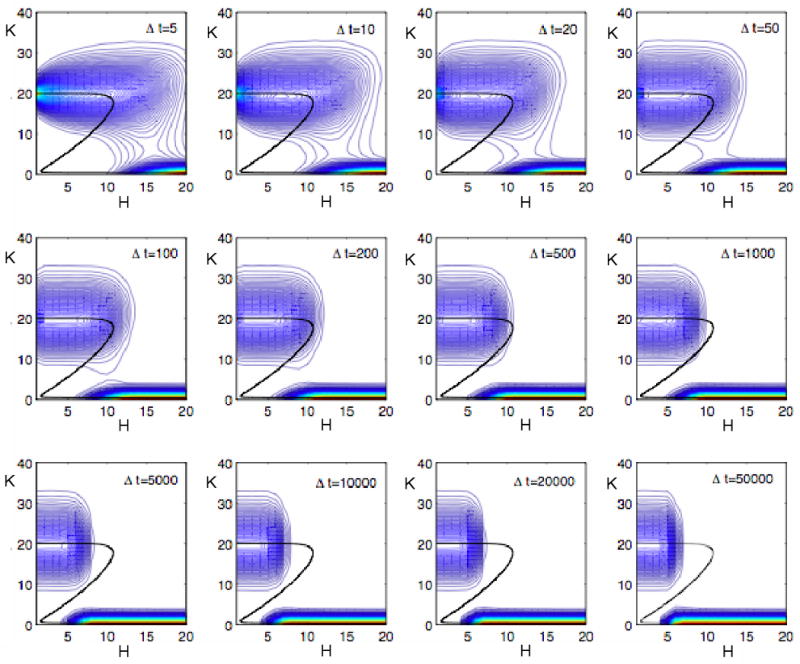
Stochastic simulations as in Fig. 7A (ordered distributive phosphorylation with N = 10, q = 0), but in this case H is not constant. In each panel, H starts at 0 and increases by 1 each Δt time units until H = 20. If Δt < 103 au, then the feedback loop flips from the upper steady state to the lower steady state close to H = 10, the deterministic SN bifurcation point. If Δt > 103 au, then the switch begins to flip spontaneously at H values less than 10. The more slowly H changes, the sooner the switch flips. For Δt > 104 au, the switch flips on and off at H ≈ 5, acting like a ‘buzzer’ instead of a ‘toggle’ switch.
Discussion
In this paper we have studied the appearance of multiple steady states in a double-negative feedback loop (K ⊣ X and X ⊣ K) where kinetic nonlinearity is generated by a mechanism of multisite phosphorylation of X by K. (Let H denote the phosphatase that converts X back to the more active, dephosphorylated forms.) This reaction network may exhibit ‘bistability’ (alternative stable steady states: X-active and X-inactive) when the activity of the phosphatase, H, lies in the ‘bistable interval’ [Hoff, Hon]. The robustness of the bistable switch can be defined as the relative size of this interval: R = (Hon−Hoff)/Hoff. We have found that R depends on four characteristics of the reaction network:
To generate multiple steady states at all, the phosphorylation mechanism must be distributive rather than processive; and bistability is more robust for an ordered distributive mechanism than for a disordered distributive mechanism.
Bistability is favored by large values of N, the number of phosphorylation sites on X.
Bistability is more robust when the inactivation of X occurs abruptly at a certain threshold phosphorylation level (q) than when phosphorylation progressively decreases the activity of X. For the threshold case, R increases with decreasing values of q.
Bistable switching behavior requires that cells are large enough to contain hundreds of molecules of K, X and H. For cells with only tens of molecules of K, X and H, the bistable switching behavior of the network may be wiped out by molecular fluctuations. The network cannot ‘remember’ which state it is in for times much longer than the ‘mean first passage time’ from the less stable X-activity state to the more stable X-activity state. If the characteristic time for sweeping H across the bistable interval is much less than this mean first passage time, then the switch flips on and off in response to the phosphatase as expected. But, if H is changing too slowly, then the switch flips spontaneously into its more stable state and no longer appears to be ‘bistable’.
To put our results in context, we need to distinguish between mechanisms that generate ‘bistability’ and mechanisms that generate ‘sigmoidicity’. By ‘sigmoidicity’ we mean a signal-response curve (e.g., activity of a phosphorylated protein as a function of kinase-to-phosphatase ratio) that has an inflection point. (For example, the curves in Fig. 2 are concave down for small values of k/h and concave up for large values of k/h. Sigmoidicity is sometimes called ‘ultrasensitivity’.) Sigmoidicity can be generated in many different ways: positive or negative cooperativity (e.g., O2 binding to hemoglobin; (Ogata and McConnell, 1972)), zero-order ultrasensitivity (Goldbeter and Koshland, 1981), and multisite phosphorylation (Gunawardena, 2005; Qu et al., 2003; Salazar and Hofer, 2007) Zero-order ultrasensitivity refers to the case of a protein that is phosphorylated on a single site, when the substrate is in great excess over the kinase and phosphatase. In this case, the phosphorylation and dephosphorylation reactions can be modeled by Michaelis-Menten kinetics in the regime of enzyme saturation (‘zero-order’ rate law). It is the saturation of the enzymes with substrate that generates sigmoidicity of the signal-response curve. Our analysis of sigmoidicity generated by multisite phosphorylation confirms and extends earlier studies by Gunawardena (2005) and Salazar & Hoefer (2007).
In our experience, bistability requires both sigmoidicity in the signal-response curve and positive feedback between the response and the signal. (Of course, the ‘positive’ feedback could be a double-negative relationship.) Our example in this paper (of multisite phosphorylation embedded in a double-negative feedback loop) was preceded by Krishnamurthy et al. (2007) who considered the case that the fully phosphorylated form of X activates the kinase K. Our results, including our stochastic simulations, confirm and extend the observations and conclusions of Krishnamurth et al. (2007).
Our association of bistability with positive feedback would seem to be contradicted by the report of Markevich et al. (2004) of bistability arising from two-site phosphorylation in a K-X-H mechanism with no explicit positive feedback. In their case, however, bistability depends on modeling the phosphorylation and dephosphorylation reactions by Michaelis-Menten kinetics and taking into account the enzyme substrate complexes: K·XP0, K·XP1, H·XP1 and H·XP2. The mechanism is bistable (high and low levels of [XP2] for a range of k/h values) if K has a much higher affinity for XP0 than for XP1. In this case XP0 can inhibit the conversion of XP1 into XP2, and this sort of feed-forward inhibition of a removal reaction
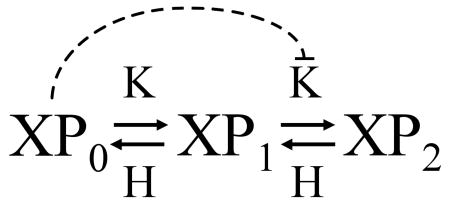 |
is a type of ‘positive feedback’ in disguise. As the affinity of K for XP0 decreases, bistability in the network is quickly lost (see Fig. 4 in their paper). In our case, the phosphorylation and dephosphorylation reactions are described by mass-action kinetics, assuming that the rate-limiting step for each of these reactions is the initial association of enzyme and substrate. In this case, bistability requires that the phosphorylation cascade be embedded in an explicit positive feedback loop.
We have motivated this study of bistable switching properties of multiply phosphorylated regulatory proteins by the case of Cdh1 phosphorylation by cyclin B-dependent protein kinase (CDK); an interaction that is crucial to understanding regulation of the eukaryotic cell cycle (Tyson and Novak, 2008). In a subsequent publication, we will elaborate on this idea with a more comprehensive model of the control of CDK activity in budding yeast (Barik et al., in preparation). For cell cycle modeling, multisite phosphorylation is an improvement over earlier models employing zero-order ultrasensitivity to generate sigmoidal signal-response curves, for the following reasons:
CDK target proteins are, in fact, multiply phosphorylated.
CDK is not likely to be operating in the zero-order regime for any of its substrates. If it were, then it would be unavailable to phosphorylate any other of its very many distinct substrates. It is much more likely that CDK molecules bind only transiently to their substrates, releasing quickly in order to find some other substrate that needs to be phosphorylated. Under these conditions, our mass-action formulation of the kinetics of multisite phosphorylation chains is correct.
When formulated in terms of mass-action kinetics, the cell cycle control mechanism is equally well suited for either deterministic or stochastic simulation. Considered as a nonlinear dynamical system, the model is amenable to the powerful tools of bifurcation theory. Considered as a stochastic system, the model is immediately applicable to cutting-edge measurements of mRNA and protein levels in single cells.
Supplementary Material
Acknowledgments
JJT acknowledges financial support from the National Institutes of Health (R01-GM07898 and R01-GM079207) and the hospitality of Merton College, Oxford. B.N. acknowledges support from the BBSRC (UK) and from the European Community's 7th Framework Programme (FP7/2007-2013) under grant agreement n° 201142.
Footnotes
Publisher's Disclaimer: This is a PDF file of an unedited manuscript that has been accepted for publication. As a service to our customers we are providing this early version of the manuscript. The manuscript will undergo copyediting, typesetting, and review of the resulting proof before it is published in its final citable form. Please note that during the production process errors may be discovered which could affect the content, and all legal disclaimers that apply to the journal pertain.
References
- Ferrell JE., Jr Tripping the switch fantastic: how a protein kinase cascade can convert graded inputs into switch-like outputs. Trends Biochem Sci. 1996;21:460–6. doi: 10.1016/s0968-0004(96)20026-x. [DOI] [PubMed] [Google Scholar]
- Ferrell JE., Jr Self-perpetuating states in signal transduction: positive feedback, double-negative feedback and bistability. Curr Opin Cell Biol. 2002;14:140–8. doi: 10.1016/s0955-0674(02)00314-9. [DOI] [PubMed] [Google Scholar]
- Gillespie DT. Stochastic simulation of chemical kinetics. Annu Rev Phys Chem. 2007;58:35–55. doi: 10.1146/annurev.physchem.58.032806.104637. [DOI] [PubMed] [Google Scholar]
- Goldbeter A, Koshland DE., Jr An amplified sensitivity arising from covalent modification in biological systems. Proc Natl Acad Sci U S A. 1981;78:6840–4. doi: 10.1073/pnas.78.11.6840. [DOI] [PMC free article] [PubMed] [Google Scholar]
- Gunawardena J. Multisite protein phosphorylation makes a good threshold but can be a poor switch. Proc Natl Acad Sci U S A. 2005;102:14617–22. doi: 10.1073/pnas.0507322102. [DOI] [PMC free article] [PubMed] [Google Scholar]
- Hershko A, Ciechanover A. The ubiquitin system. Annu Rev Biochem. 1998;67:425–79. doi: 10.1146/annurev.biochem.67.1.425. [DOI] [PubMed] [Google Scholar]
- Kim SY, Ferrell JE., Jr Substrate competition as a source of ultrasensitivity in the inactivation of Wee1. Cell. 2007;128:1133–45. doi: 10.1016/j.cell.2007.01.039. [DOI] [PubMed] [Google Scholar]
- Krishnamurthy S, Smith E, Krakauer D, Fontana W. The stochastic behavior of a molecular switching circuit with feedback. Biol Direct. 2007;2:13. doi: 10.1186/1745-6150-2-13. [DOI] [PMC free article] [PubMed] [Google Scholar]
- Kumagai A, Dunphy WG. Regulation of the cdc25 protein during the cell cycle in Xenopus extracts. Cell. 1992;70:139–51. doi: 10.1016/0092-8674(92)90540-s. [DOI] [PubMed] [Google Scholar]
- Manning G, Plowman GD, Hunter T, Sudarsanam S. Evolution of protein kinase signaling from yeast to man. Trends Biochem Sci. 2002;27:514–20. doi: 10.1016/s0968-0004(02)02179-5. [DOI] [PubMed] [Google Scholar]
- Markevich NI, Hoek JB, Kholodenko BN. Signaling switches and bistability arising from multisite phosphorylation in protein kinase cascades. J Cell Biol. 2004;164:353–9. doi: 10.1083/jcb.200308060. [DOI] [PMC free article] [PubMed] [Google Scholar]
- Mellor J. Dynamic nucleosomes and gene transcription. Trends Genet. 2006;22:320–9. doi: 10.1016/j.tig.2006.03.008. [DOI] [PubMed] [Google Scholar]
- Moll T, Tebb G, Surana U, Robitsch H, Nasmyth K. The role of phosphorylation and the CDC28 protein kinase in cell cycle-regulated nuclear import of the S. cerevisiae transcription factor SWI5. Cell. 1991;66:743–58. doi: 10.1016/0092-8674(91)90118-i. [DOI] [PubMed] [Google Scholar]
- Mueller PR, Coleman TR, Dunphy WG. Cell cycle regulation of a Xenopus Wee1-like kinase. Mol Biol Cell. 1995;6:119–34. doi: 10.1091/mbc.6.1.119. [DOI] [PMC free article] [PubMed] [Google Scholar]
- Ogata RT, McConnell HM. Mechanism of cooperative oxygen binding to hemoglobin (spin-labeled triphosphate-concerted transition model-hemoglobin chesapeake) Proc Natl Acad Sci U S A. 1972;69:335–9. doi: 10.1073/pnas.69.2.335. [DOI] [PMC free article] [PubMed] [Google Scholar]
- Paulsson J. Summing up the noise in gene networks. Nature. 2004;427:415–8. doi: 10.1038/nature02257. [DOI] [PubMed] [Google Scholar]
- Qu Z, Weiss JN, MacLellan WR. Regulation of the mammalian cell cycle: a model of the G1-to-S transition. Am J Physiol Cell Physiol. 2003;284:C349–64. doi: 10.1152/ajpcell.00066.2002. [DOI] [PubMed] [Google Scholar]
- Salazar C, Hofer T. Versatile regulation of multisite protein phosphorylation by the order of phosphate processing and protein-protein interactions. Febs J. 2007;274:1046–61. doi: 10.1111/j.1742-4658.2007.05653.x. [DOI] [PubMed] [Google Scholar]
- Schofield CJ, Ratcliffe PJ. Oxygen sensing by HIF hydroxylases. Nat Rev Mol Cell Biol. 2004;5:343–54. doi: 10.1038/nrm1366. [DOI] [PubMed] [Google Scholar]
- Schwab M, Lutum AS, Seufert W. Yeast Hct1 is a regulator of Clb2 cyclin proteolysis. Cell. 1997;90:683–93. doi: 10.1016/s0092-8674(00)80529-2. [DOI] [PubMed] [Google Scholar]
- Tyson JJ, Chen KC, Novak B. Sniffers, buzzers, toggles and blinkers: dynamics of regulatory and signaling pathways in the cell. Curr Opin Cell Biol. 2003;15:221–31. doi: 10.1016/s0955-0674(03)00017-6. [DOI] [PubMed] [Google Scholar]
- Tyson JJ, Novak B. Temporal organization of the cell cycle. Curr Biol. 2008;18:R759–R768. doi: 10.1016/j.cub.2008.07.001. [DOI] [PMC free article] [PubMed] [Google Scholar]
- Verma R, Annan RS, Huddleston MJ, Carr SA, Reynard G, Deshaies RJ. Phosphorylation of Sic1p by G1 Cdk required for its degradation and entry into S phase. Science. 1997;278:455–60. doi: 10.1126/science.278.5337.455. [DOI] [PubMed] [Google Scholar]
- Yang L, MacLellan WR, Han Z, Weiss JN, Qu Z. Multisite phosphorylation and network dynamics of cyclin-dependent kinase signaling in the eukaryotic cell cycle. Biophys J. 2004;86:3432–43. doi: 10.1529/biophysj.103.036558. [DOI] [PMC free article] [PubMed] [Google Scholar]
- Zachariae W, Schwab M, Nasmyth K, Seufert W. Control of cyclin ubiquitination by CDK-regulated binding of Hct1 to the anaphase promoting complex. Science. 1998;282:1721–4. doi: 10.1126/science.282.5394.1721. [DOI] [PubMed] [Google Scholar]
Associated Data
This section collects any data citations, data availability statements, or supplementary materials included in this article.