

Abstract
Previous work demonstrated that liposomes, containing an amino acid sequence that binds to hepatic heparan sulfate glycosaminoglycan, show effective targeting to liver hepatocytes. These liposomes were tested to determine whether they can deliver doxorubicin selectively to liver and hepatocytes in vivo. Fluid-phase liposomes contained a lipid-anchored 19-amino acid glycosaminoglycan targeting peptide. Liposomes were loaded with doxorubicin and were non-leaky in the presence of serum. After intravenous administration to mice, organs were harvested and the doxorubicin content extracted and measured by fluorescence intensity and by fluorescence microscopy. The liposomal doxorubicin was recovered almost entirely from liver, with only trace amounts detectable in heart, lung, and kidney. Fluorescence microscopy demonstrated doxorubicin preferentially in hepatocytes, also in non-parenchymal cells of the liver, but not in cells of heart, lung or kidney. The doxorubicin was localized within liver cell nuclei within five minutes after intravenous injection. These studies demonstrated that liposomal doxorubicin can be effectively delivered to hepatocytes by targeting the heparan sulfate glycosaminoglycan of liver tissue. With the composition described here, the doxorubicin was rapidly released from the liposomes without the need for an externally supplied stimulus.
Keywords: doxorubicin, heparan sulfate proteoglycan, liposomes, targeted drug delivery, triggered release
1. Introduction
An important effort in contemporary pharmaceutical nanotechnology is the development of targeted delivery of nanoparticles in vivo. For normal organs, particular attention has been placed on delivery to liver and hepatocytes (Daemen et al., 1997; Murao et al., 2002; Scherphof et al., 2002; Wu et al., 2002; Managit et al., 2003; Kamps and Scherphof, 2004; Nishikawa, 2005). Targeting of nanoparticle systems to tumors is also under extensive investigation (Kim, 2007; Nie et al., 2007; Byrne et al., 2008; Haley and Frenkel, 2008). For diagnostic applications, highly-specific targeting is particularly desirable for non-invasive imaging technologies, in order to reduce or eliminate signals from non-specific uptake by surrounding tissues. For therapeutic application, targeted delivery is important to minimize detrimental effects on healthy tissue, particularly for tumor-related therapies, which typically involve delivery of cytotoxic compounds, nuclear medicines, or toxins. For both diagnostic and therapeutic applications, it is also important that the delivery characteristics remain constant upon repeat administration, and are not significantly altered by host defense mechanisms.
In recent years, our laboratories have evaluated the potential for incorporating cell-specific and organ-specific glycosaminoglycan targeting ligands into fully synthetic nanoparticle delivery systems. Our initial studies (Longmuir et al., 2006; Haynes et al., 2008; Robertson et al., 2008) have involved liposome delivery to the hepatocytes of liver, as the presence of relatively wide fenestrae and the very sparse basal lamina associated with liver endothelial cells (Wisse, 1970; 1972; Wisse et al., 1985; Baratta et al., 2009) allow for relatively unimpeded passage of systemically administered nanoparticles from blood into parenchymal regions. In a series of publications (Longmuir et al., 2006; Haynes et al., 2008; Robertson et al., 2008), we have reported the development of fluid-phase liposome systems containing an amino acid sequence from the circumsporozoite protein of the Plasmodium sporozoite, a microorganism that displays highly specific and highly efficient targeting to liver (Shin et al., 1982; Frevert, 1994; Ying et al., 1997; Ménard, 2000; Mota and Rodriguez, 2002; Pradel et al., 2002). When administered systemically to BALB/c mice, these liposomes are cleared rapidly from the circulation, and appear primarily in the liver by binding to the highly-sulfated heparan sulfate proteoglycan found in the sinusoidal region and the space of Disse (Longmuir et al., 2006; Robertson et al., 2008). Quantitative electron microscopic analysis demonstrated that most of the liposomal material was delivered to the hepatocytes (Longmuir et al., 2006). The liver targeting was effective when the liposome contained a high mole fraction (10%) of lipid-polyethyleneglycol conjugate, and the delivery properties were unchanged upon repeat administration (Haynes et al., 2008).
It is important to demonstrate that the glycosaminoglycan targeting nanoparticles we have developed are capable of effective delivery of therapeutic contents and subsequent release of these contents into the targeted organ and cells. Demonstration of effective contents delivery in vivo involves several considerations. These include demonstration of efficient loading of the therapeutic compound into the nanoparticle, absence of contents leakage in the presence of serum, selective contents delivery to the targeted organ after systemic administration, cellular distribution of contents within the organ, and evidence that the contents are released upon delivery and appear within appropriate intracellular compartments. These considerations are addressed in this communication. Doxorubicin was chosen as the model compound for the demonstration of contents delivery because of its appeal as a cancer chemotherapeutic agent and because its fluorescence allows it to be identified within tissues and cells. In these studies, we demonstrate that the liver targeting liposome system we have developed is capable of effective delivery of entrapped doxorubicin to liver and hepatocytes, with apparent rapid and triggered release of contents from the liposomes into cell nuclei.
2. Materials and methods
2.1. Peptide synthesis
The peptide acetyl-CKNEKKNKIERNNKLKQPP-amide contained an N-terminal acetylcysteine followed by amino acids 76–93 of the N-terminal region of the circumsporozoite protein of Plasmodium berghei, Anka strain (Swiss Protein entry name: CSP_PLABA; Primary accession number: P23093). The peptide was synthesized by Fmoc chemistry (Fields et al., 1991) and cleaved from the resin as described (Guy and Fields, 1997). The peptide was purified by chromatography on a 75 mL column of G-25 Sephadex in aqueous 1 mM HCl. Column fractions containing the peptide (identified using Ellman’s reagent) were combined, filter-sterilized, and lyophilized in approximately 10 mg aliquots. The vials were sealed under vacuum within the lyophilizer and stored at −70°C until further use.
2.2. Lipid synthesis
1,2-Dierucoyl-sn-3-phosphatidylcholine (di22:1-PC) was obtained from Avanti Polar Lipids, Alabaster, AL. 1,2-Dierucoyl-sn-3-phosphatidylethanolamine (di22:1-PE) was synthesized by base-exchange of di22:1-PC with ethanolamine, catalyzed by Streptomyces sp. phospholipase D (Sigma, St. Louis, MO) (Sato et al., 2004). 1,2-Dierucoyl-sn-3-aminopropane (di22:1-AP, the 3-amino analogue of 1,2-sn-diacylglycerol) was synthesized in three steps from 3-aminopropanediol as described previously (Longmuir et al., 2006; Haynes et al., 2008).
The mPEG2000 conjugate of di22:1-PE was prepared by reacting 10 μmol di22:1-PE with 20 μmol of mPEG2000 carboxylic acid N-hydroxysuccinimidyl ester (Nektar, Huntsville, AL) and 100 μmol of triethylamine in dichloromethane. The product was purified by precipitation in t-butyl methyl ether, followed by separation from excess free mPEG2000 by column chromatography on G-75 Sephadex in deionized water. Thin layer chromatography analysis (chloroform/methanol 16:3) of the column fractions indicated complete separation of the di22:1-PE-PEG2000 conjugate (eluting first) from free mPEG2000, due to the propensity of the conjugate to form higher molecular weight micelles in water. The column fractions containing the di22:1-PE-PEG2000 bioconjugate were lyophilized and the amount of product was determined by weight. The product was stored in distilled reagent alcohol at −70°C prior to use.
Di-22:1-AP-Bodipy-FL was prepared by reacting 2 μmol di22:1-AP with 3 μmol Bodipy-FL STP ester (Molecular Probes/Invitrogen, Eugene, OR) with 10 μmol triethylamine in 200 μl dimethylformamide (dmf). The fluorescent lipid product was purified by LH-20 Sephadex chromatography in reagent alcohol/water (95:5). Concentrations were determined by absorbance (504 nm, ε = 68,000 M −1 cm −1).
2.3. Lipid-peptide conjugate
The liver-targeting peptide was conjugated to di22:1-AP using the heterobifunctional cross-linker EMCS (N-[ε-maleimidocaproyloxy]succinimide ester, Pierce, Rockford, IL). The EMCS was first conjugated to lipid by combining 20 μmol di22:1-AP with 40 μmol EMCS in 100 μmol triethylamine in 200 μl dmf for 1 h. The product was purified by chromatography on LH-20 Sephadex in 95:5 reagent alcohol/water.
For the preparation of di22:1-AP-C6-succinyl-peptide, 4 μmol of peptide in dmf was titrated with aliquots of the di22:1-AP-EMCS conjugate (also dissolved in dmf) until analysis with Ellman’s reagent showed less than 2% of the initial concentration of free cysteine. This lipid-peptide bioconjugate was stored at −70°C in dmf.
2.4. Preparation of doxorubicin-loaded, liver-targeting liposomes
Doxorubicin was loaded into liver-targeting liposomes using the ammonium sulfate gradient method (Abraham et al., 2005). In a typical preparation, stock solutions of di-22:1-PC, di-22:1-PE-PEG2000, and di-22:1-AP-C6-succinyl-peptide were mixed at a molar ratio of 91:7:2, 8 μmol total lipid (Haynes et al., 2008). Also, a small quantity (0.2%) of di22:1-AP-Bodipy-FL was added in order to measure recoveries at various steps of the assembly and loading procedure. Organic solvents were evaporated (N2 gas), and the residue dried in vacuo at <100 μbar pressure for >1 h at room temperature. The residue was suspended in 0.5 mL of 250 mM ammonium sulfate, pH 7.5, and subjected to two freeze-thaw cycles. The sample was extruded 5x through a double stack of 100 nm Nuclepore filters, followed by dialysis twice against a solution of 5% glucose + 0.1 mM ammonium sulfate. The liposomes were filter-sterilized through a 0.22 μm filter and the concentration of liposomes determined by the fluorescence of the Bodipy-FL labeled lipid (λex = 480 nm; λem = 515 nm). Liposomes were loaded with doxorubicin (Polymed Therapeutics, Houston, TX) by adding a 10 mg/ml solution of sterile doxorubicin in 5% glucose to the liposomes at a ratio of 0.25 mg doxorubicin per μmol liposomal lipid, and incubating overnight at 37°C.
The Z-average diameter, polydisperity index, and zeta potentials were measured both before and after loading with doxorubicin using a Malvern Nano ZS Zetasizer (Malvern Instruments, Westborough, MA).
2.5. Determinations of loading efficiency and serum-induced leakage
The following procedure was used to quantitatively measure free vs. liposome-encapsulated doxorubicin. Approximately 0.1 μmol doxorubicin-loaded liposomes in a volume of 25 to 50 μl were applied to a 2 mL column of G-75 Sephadex in 5% glucose and eluted with 3 mL 5% glucose. Under these conditions, the small quantity of free doxorubicin does not elute and instead is retarded on the column by interaction with the Sephadex gel. The free doxorubicin was eluted by flushing the column with 3 mL of 2.5% Triton X-100. The liposome-encapsulated doxorubicin was released by addition of a 1/10th volume of 25% Triton X-100. The ratio of free vs. liposome-encapsulated doxorubicin was determined by measuring doxorubicin fluorescence intensities (λex = 480 nm; λem = 590 nm) and correcting the intensities for the small differences in total volume of the free and liposome-encapsulated doxorubicin column fractions.
To measure doxorubicin loading efficiency, 0.5 μmol liposomes (prepared with encapsulated ammonium sulfate as described above) were mixed in triplicate with doxorubicin at ratios ranging from 0 to 0.45 mg doxorubicin per μmol liposomal lipid and incubated overnight at 37°C. Free vs. encapsulated doxorubicin was determined by the G-75 Sephadex column separation procedure described above. Significant free doxorubicin was found only in the sample containing the highest level of doxorubicin (0.45 mg per μmol liposomes, see Fig. 1).
Fig. 1.
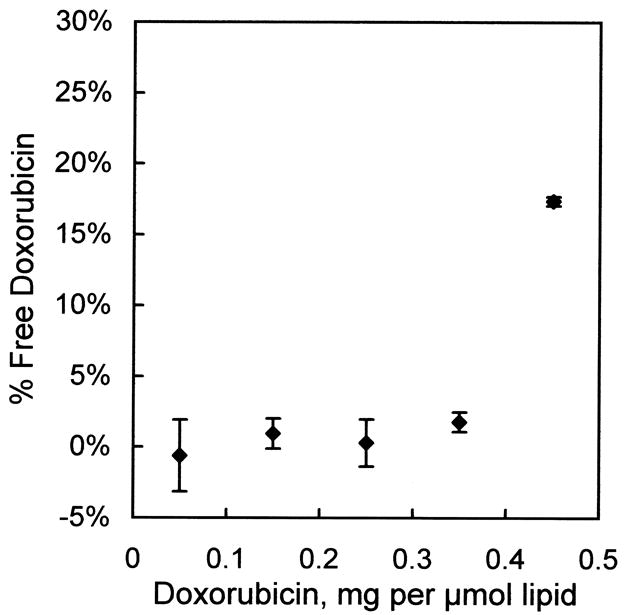
Loading efficiency of doxorubicin into liver-targeting liposomes. Doxorubicin was added to liver-targeting liposomes at the indicated ratios and left overnight at 37°C. Free vs. encapsulated doxorubicin was determined by the G-75 Sephadex column chromatography procedure. Values are mean ± s.e.m., n=3.
Serum-induced leakage of liposomal doxorubicin was measured by incubating 0.5 μmol liposomes in 80% calf serum at 37°C for 0, 1, and 4 h. Free vs. encapsulated doxorubicin was determined by the G-75 Sephadex separation procedure.
2.6. In vivo studies
All in vivo protocols were reviewed and approved by the University of California, Irvine, Institutional Animal Care and Use Committee (IACUC) prior to conducting the experiments. All research adhered to the ”Principles of Laboratory Animal Care” (NIH publication #85–23, revised in 1985). Adult BALB/c female mice, approximately 20–25 grams, were injected via the tail vein with doxorubicin-loaded, liver-targeting liposomes (0.4 μmol lipid; 100 μg doxorubicin) in 100 μl 5% glucose. Other animals were treated with 100 μg free doxorubicin in 100 μl 5% glucose. For collection of tissue, mice were deeply anesthetized with sodium pentobarbital (100mg/kg; i.p.), then perfused through the heart with 10 ml of 0.9% saline using a perfusion pump set at a flow rate of 5 ml/min. Liver, lungs, spleen, kidneys, and heart were removed and placed in phosphate-buffered saline for subsequent lipid extraction and fluorescence measurements, as described below.
2.7. Blood clearance
To evaluate liposome clearance from blood, 400 nmol (liposomal lipid) of either the liver targeting liposomes, or control liposomes (in which the liver targeting peptide was omitted) were prepared and injected into the tail vein as described above. Blood samples were collected at 10 min and 1 h following injection, using Sarstedt Microvette CB300 (Sarstedt, Newton, NC) capillary blood collection tubes. Tubes were centrifuged at 4,000 × g for 5 min. Then, 3 μl of plasma was diluted to 1.0 ml with phosphate-buffered saline, and the Bodipy-FL emission spectra recorded digitally. The integrated fluorescence spectra were compared to the spectrum of a known quantity of liposomes, also diluted to 1.0 ml in phosphate-buffered saline, in order to compute the nmol liposomal lipid in the plasma sample.
2.8. Extraction of doxorubicin from tissue and fluorescence analysis
The weights of the entire liver, lungs, spleen, kidneys, and heart were recorded, then portions of each tissue (0.05 to 0.2 g each) were weighed, then homogenized in 1 ml of 0.2 M borate buffer, pH 9.5, with a Teflon-glass homogenizer. The homogenate was mixed with 0.1 ml 25% Triton X-100 and 0.5 ml methanol, and placed at room temperature for 30 min. The solution was separated into two phases by the addition 2.0 ml 1 M NaCl, 0.5 ml methanol, and 2.5 ml chloroform. After vortex mixing and centrifugation, the upper (aqueous) phase was removed, and the lower phase taken for fluorescence analysis.
Fluorescence emission scans of tissue-extracted doxorubicin were obtained on a Varian Eclipse fluorometer (λex = 480 nm; λem = 500 to 700 nm). Scans of the chloroform extracts of control tissue from animals not treated with doxorubicin were obtained as well. Emission spectra were recorded digitally (0.5 nm step size) and imported into Excel spreadsheets. The spectra of the extracts from control organs (not treated with either free doxorubicin or liposomes) were digitally subtracted from the doxorubicin spectrum from the same organ in order to correct for interference from the autofluorescence of the various tissues. Interference from autofluorescence was most significant for kidney and heart (see Fig. 4B). Amounts of doxorubicin were determined by the fluorescence intensity at 590 nm, and μg of doxorubicin were calculated by comparison with the fluorescence intensities of known quantities of doxorubicin carried through the same extraction procedure.
Fig. 4.
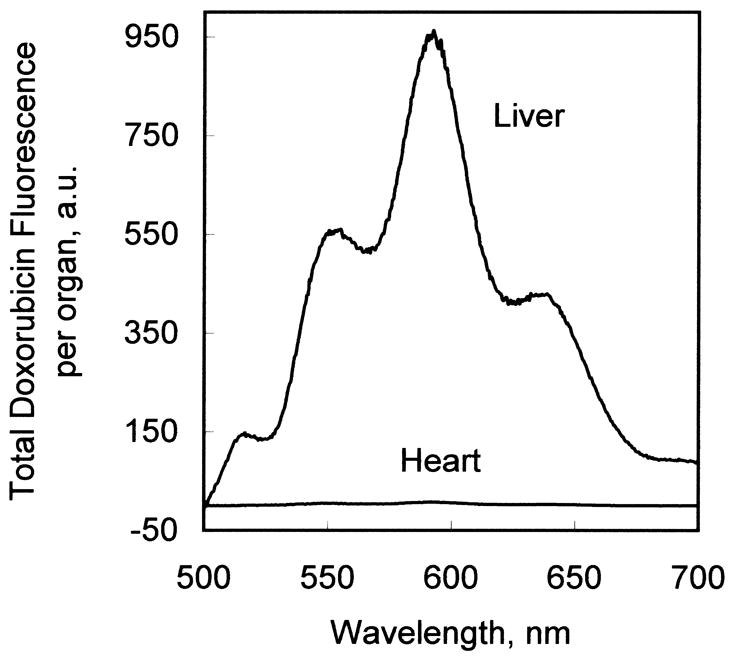
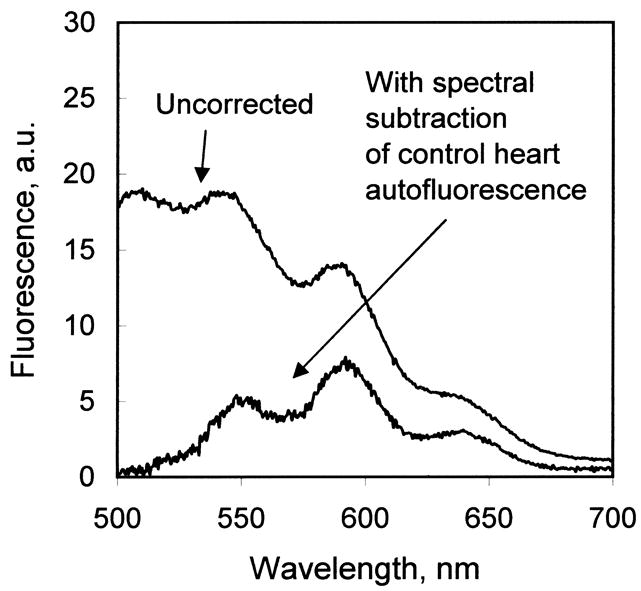
(A) Comparison of fluorescence emission spectrum of doxorubicin extracted from liver tissue and heart tissue from an animal treated with doxorubicin-loaded, liver-targeting liposomes. (B) Correction of the fluorescence emission scan of tissue-extracted doxorubicin for autofluorescence. In this example, the fluorescence emission scan of the chloroform extract of heart tissue not treated with doxorubicin (not shown) was subtracted from the fluorescence emission scan of heart tissue from an animal treated with liver-targeting liposomes (“uncorrected”). The corrected spectrum exhibits zero baseline at 500 and 700 nm, and a characteristic doxorubicin fluorescence emission spectrum.
2.9. Immunocytochemistry
Mice were used for light microscopic studies of the distribution of doxorubicin labeled nuclei and for immunocytochemical identification of cell types (Baratta et al., 2009). The BALB/c mice received intravenous injections of either liver-targeting liposomes containing doxorubicin, or free doxorubicin, as described above. Following varied post-injection survival times, these mice were deeply anesthetized with sodium pentobarbital (100 mg/kg; IP) and euthanized by perfusion through the heart with saline followed by 25 ml 4% paraformaldehyde, using a perfusion pump set at a rate of 5 ml/min. Organs, including liver, heart, spleen, kidney, and lung, were collected and post-fixed in 4% paraformaldehyde before being transferred to a 30% sucrose solution overnight at 4°C for cryo-protection.
In two cases, mice were anesthetized with sodium pentobarbital (40 mg/kg; IP) and injected intravenously with the doxorubicin-loaded, liver-targeting liposomes. After 5 min, the livers were removed and frozen immediately by placing them into −20°C 2-methylbutane. Frozen samples were quickly sectioned using the cryostat and sections inspected immediately under the fluorescence microscope to test for doxorubicin labeled nuclei.
Immunocytochemical techniques used cell-specific antibodies to identify the cells with doxorubicin labeled nuclei in fixed liver slices (Baratta et al., 2009). Antibodies included 1) a fluorescein labeled antibody against albumin (Bethyl Labs, Montgomery, TX; raised in rat; dilution 1:500) used to label hepatocytes, 2) a rat monoclonal antibody F4-80 (Serotec, Oxford UK; dilution 1:1000) used to label Kupffer cells, and 3) a glial fibrillary acidic protein (GFAP) antibody (Dako Labs, Carpinteria CA; raised in rat; dilution 1:3000) used to label Ito stellate cells. Tissue blocks from aldehyde-fixed liver were cut on a Reichert-Jung cryostat at a section thickness of 10–12 μm and sections were mounted directly onto subbed slides. Sections were rinsed in Tris buffer (0.1 M, pH 7.4) for 5 min and then processed for nonspecific blocking in 3% normal goat serum for 1 h. Primary antibodies were diluted in Tris buffer, at dilutions presented above, and incubated overnight at room temperature. The following day, slides were rinsed 3x in Tris buffer. The tissue processed for the albumin antibody required no further processing. Tissues processed with the F4-80 and GFAP antibodies were then incubated in a secondary antibody for 2 h at room temperature in darkness. Secondary antibodies were goat anti-mouse or goat anti-rat, both labeled with Alexa 488. After incubation in the secondary antibody, slides were rinsed 3 times for 10 min each in Tris buffer, and then coverslipped with Vectashield. Selected sections were counterstained with 4′, 6-diamidino-2- phenylindole (DAPI), a fluorescent nuclear stain useful for studying nuclear morphology and tissue architecture, and then coverslipped.
2.10. Image Analysis
Tissue sections were inspected using a Nikon fluorescence microscope equipped with rhodamine, fluorescein, and ultraviolet filter sets. Images were captured using a Nikon DS 5M digital camera. Exposure parameters were adjusted manually to ensure that photographic parameters remained consistent. This allowed for accurate comparison of doxorubicin labeling intensity between sections, and at different survival times after systemic injections.
Images in PhotoShop (Adobe Photoshop 7.0; Adobe Systems, Mountain View, CA) files were analyzed for the intensity of doxorubicin fluorescence labeling in cell nuclei at different times following intravenous injections. Labeled nuclei were sorted visually into two groups: nuclei characterized by large round shapes versus those characterized by oval or indented shapes. The intensity of red spectrum doxorubicin fluorescence was determined for 20 cells in each group, from animals euthanized at 5 min, 15 min, 1 h, 4 h, 6 h, and 12 h after intravenous injection. Red fluorescence intensities were measured for three regions within each nucleus and averaged. Background fluorescence, defined as the average fluorescence intensity over cell cytoplasm, was subtracted from the measurements for each case. Average nuclear fluorescence intensities were calculated for each group of nuclei at each time point, and a ratio of round/oblong (presumed hepatocyte/non-parenchymal cell) (Baratta et al., 2009) was calculated.
To further confirm nuclear localization of the doxorubicin, selected cells were imaged using a Zeiss (Oberkochen, Germany) Axioscope equipped with an Axiocam CCD camera and AxioVision 3.1 software, all courtesy of Drs. C.M. Gall and C. Rex (Rex et al., 2007). Images were collected using 20X or 40X planapochromatic lenses. Gray scale series of Z-plane digital images were collected at 2 μm steps, and collapsed into single images using Microsuite FIVE (Soft Imaging Systems, Lakewood, CO), and then images were pseudocolored to mimic the original green fluorescein or orange/red doxorubicin label.
3. Results
3.1. Formulation
Di22:1-PC, di22:1-PE-PEG2000, and lipid-peptide bioconjugate were combined in a molar ratio of 91:7:2. The resulting liver-targeting liposomes were extruded through a double-stack of 100 nm Nuclepore filters, followed by filter sterilization through a 0.22 μm filter. By dynamic light scattering analysis, the liposome preparation exhibited a narrow size range with a Z-average diameter of 120.8 ± 0.3 nm (s.e.m., n=3) and a polydispersity index of 0.051 ± 0.007 (s.e.m., n=3).
3.2. Loading of liposomes with doxorubicin, measurement of zeta potentials, and stability in serum
Doxorubicin was loaded into the liposomes using the ammonium sulfate gradient method (Abraham et al., 2005). Shown in Fig. 1 is the efficiency of loading at various doxorubicin/lipid ratios, as measured by the residual unencapsulated doxorubicin remaining in solution after a 24 h incubation at 37°C. Doxorubicin can be effectively loaded into the liposomes, with negligible free doxorubicin, up to a ratio of 0.35 mg doxorubicin per μmol liposomal lipid. Doxorubicin loading increased the liposome diameter by only a few nanometers. After loading, the Z-average diameter was measured as 123.6 ± 0.5 nm (s.e.m., n=3) with a polydispersity index of 0.057 ± 0.005 (s.e.m., n=3).
Zeta potentials for the liver-targeting formulation, which contained both PE-PEG (7 mol%) and lipid-peptide bioconjugate (2 mol%), are listed in Table 1. Also shown are the zeta potentials for a formulation with PE-PEG but without lipid-peptide bioconjugate (control), and for a formulation without PE-PEG but with lipid-peptide bioconjugate. The liver-targeting formulation without PE-PEG displayed zeta potentials of approximately +9 millivolts, both before and after loading of doxorubicin, due to the net positive charge of +5 on the peptide. Addition of PE-PEG effectively shielded these basic amino acids from the hydrodynamic interface of the liposome, as the liver-targeting formulation with PE-PEG exhibited a zeta potential of 0.0 millivolts prior to loading with doxorubicin. Control liposomes exhibited a zeta potential of −1.2 millivolts prior to doxorubicin loading. Loading the liposomes with doxorubicin increased the zeta potentials by approximately +2 millivolts for both control and liver-targeting formulations that contained PE-PEG. We interpret this result to mean that a small amount of doxorubicin (which is positively-charged) remained associated with the surface of the liposome after loading.
Table 1.
Zeta potentials of control and liver-targeting liposome formulations
| Liposome formulation | zeta potential (millivolts) |
|---|---|
| Before loading with doxorubicin | |
| Control, with PE-PEG | −1.2 ± 0.8 |
| Liver-targeting, with PE-PEG | 0.0 ± 0.2 |
| Liver targeting, without PE-PEG | 8.7 ± 0.2 |
| After loading with doxorubicin | |
| Control, with PE-PEG | 0.6 ± 0.6 |
| Liver-targeting, with PE-PEG | 2.1 ± 0.6 |
| Liver targeting, without PE-PEG | 8.8 ± 1.2 |
All values are mean ± s. d. of three samples, with 3 measurements per sample. Formulations are described in Materials and Methods. Formulations with PEG contained 7% (mole fraction) di22:1-phosphatidylethanolamine-PEG2000. Formulations with liver-targeting peptide contained 2% (mole fraction) di22:1-aminopropane-C6-succinyl-peptide bioconjugate. Formulations with doxorubicin contained 0.25 mg doxorubicin per μmol total liposomal lipid. Zeta potentials were measured in a solution of 5% glucose and 50 mM NaCl.
Doxorubicin leakage from liposomes in the presence of serum was undetectable. Shown in Fig. 2 is the free doxorubicin (as a percent of total) measured in the liposome stock solution prior to the experiment (“no serum”), and in the presence of 80% calf serum incubated 0, 1, and 4 h at 37°C (4:1 ratio of calf serum to liposome solution). No statistically-significant differences in the amounts of free doxorubicin were found (ANOVA, p=0.10).
Fig. 2.
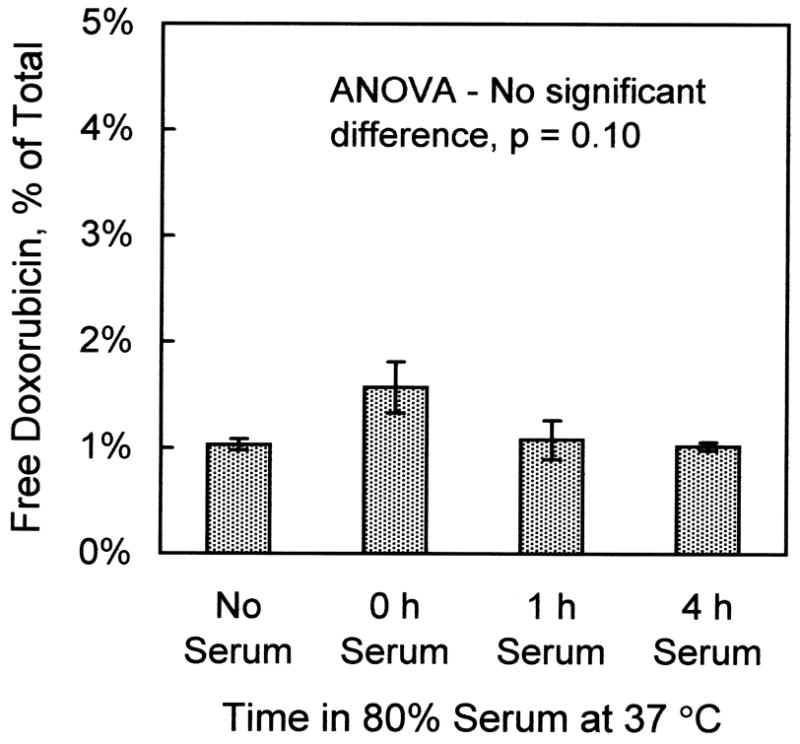
Absence of leakage of doxorubicin from liver-targeting liposomes in the presence of 80% calf serum. Liposomes (0.5 μmol) containing 0.25 mg doxorubicin per μmol liposomal lipid were incubated with calf serum in a 2:8 ratio at 37°C for the indicated times. Afterwards, free and encapsulated doxorubicin were determined by the G-75 Sephadex column chromatography procedure. Values are mean ± s.e.m., n=3.
3.3. Clearance of liposomes from blood
Figure 3 illustrates the results of the blood clearance measurements for both liver-targeting liposomes and control liposomes. (Control liposomes were the same formulation but without the liver-targeting peptide.) For the control liposomes, 400 nmol liposomal lipid was administered by tail-vein injection. The concentrations of control liposomes in the plasma were determined to be 387 ± 34 nmol per mL plasma (s.e.m, n=4) after 10 min, and 359 ± 27 nmol per mL plasma after 1 h. These values were not significantly different (unpaired t test; p = 0.55). Given the weight range of the mice between 20 and 25 g, an estimated blood volume of 8% of body weight, and an estimated hematocrit of 40%, the approximate plasma volume was calculated to be 1.1 mL per animal. The results and the estimate of plasma volume are consistent with an interpretation of essentially no clearance from blood of the control liposomes during the 1 h time course of the experiment.
Fig. 3.

Clearance of liver-targeting liposomes from plasma. Each BALB/c mouse was injected via the tail vein with a solution containing either 400 nmol liver-targeting liposomes, or 400 nmol control liposomes in which the liver-targeting peptide was omitted from the formulation. Blood samples were collected at 10 min and 1 h, and the quantity of liposomal lipid in the plasma determined by measurement of Bodipy-FL fluorescence, as described in the Materials and Methods. Values are nmol of liposomal lipid per mL plasma. Error bars are s.e.m, n=4.
Liver-targeting liposomes were > 80% cleared from the blood within 1 h, as also illustrated in Figure 3. The plasma levels of liver-targeting liposomes at both 10 min and 1 h were significantly less than the control values (unpaired t test; p < 6 × 10⁻⁵). The value at 1 h was significantly less than the value at 10 min (unpaired t test; p < 0.013).
3.4. Fluorescence measurement of doxorubicin biodistribution
Figure 4A shows a typical doxorubicin fluorescence spectrum of a chloroform/methanol extract of liver tissue and of heart tissue from an animal injected with liver-targeting liposomes containing doxorubicin. Doxorubicin fluorescence intensity maxima are observed at 552, 590, and 635 nm. (The peak at 515 nm is due to a small quantity of lipid-Bodipy-FL added to the liposomes for quantitative analysis during liposome preparation.) With the organic solvent doxorubicin extraction procedures used in this investigation, the doxorubicin partitioned into the organic (chloroform/methanol) phase. Most, but not all, of the autofluorescent materials from tissue remained in the aqueous phase. However, with some tissues, notably heart and kidney, some autofluorescence was found in the organic phase. This autofluorescence was digitally removed by spectral subtraction of the experimental samples with a fluorescence spectrum of control tissue extract from an untreated animal, as shown in Fig. 4B.
3.5. Biodistribution of liver-targeting doxorubicin administered intravenously
Liver-targeting liposomes were loaded with 0.25 mg doxorubicin per μmol lipid. Liposomes (0.4 μmol) containing 100 μg doxorubicin were administered intravenously to BALB/c mice. In separate experiments, 100 μg free doxorubicin was administered intravenously to mice. The doxorubicin organ biodistribution was determined 1 h after administration by fluorescence spectroscopy as described in the Materials and Methods.
As shown in Fig. 5A, free doxorubicin administered intravenously was distributed widely across all tissues studied; the micrograms of doxorubicin per gram of tissue did not differ by more than a factor of five among the organs analyzed. In contrast, Fig. 5B illustrates that when the administered doxorubicin was encapsulated into liver-targeting liposomes, the doxorubicin was detected mostly in liver. Small amounts were detected in spleen and kidney, while virtually no doxorubicin was found in lung or heart. Quantitative details of liposomal delivery of doxorubicin vs. free doxorubicin are presented in Table 2. Of particular note is the liposomal delivery of doxorubicin away from the heart, as cardiotoxicity is a principal limitation of the use of doxorubicin in cancer chemotherapy. With intravenous administration of free doxorubicin, measurements of quantities of doxorubicin per gram of tissue indicate the ratio of doxorubicin in liver vs. heart was approximately 2:1. With administration of the liposomal doxorubicin, the ratio in liver vs. heart exceeded 100:1.
Fig. 5.
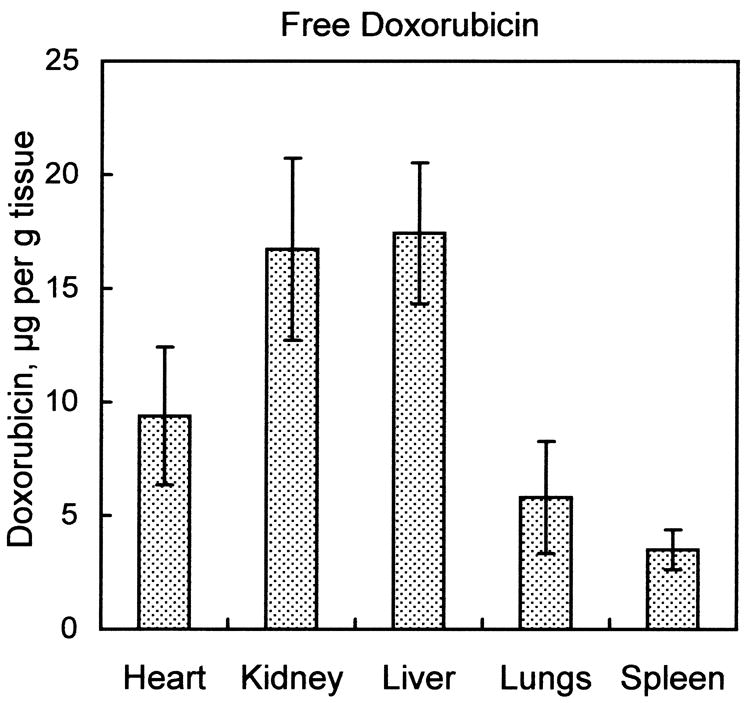
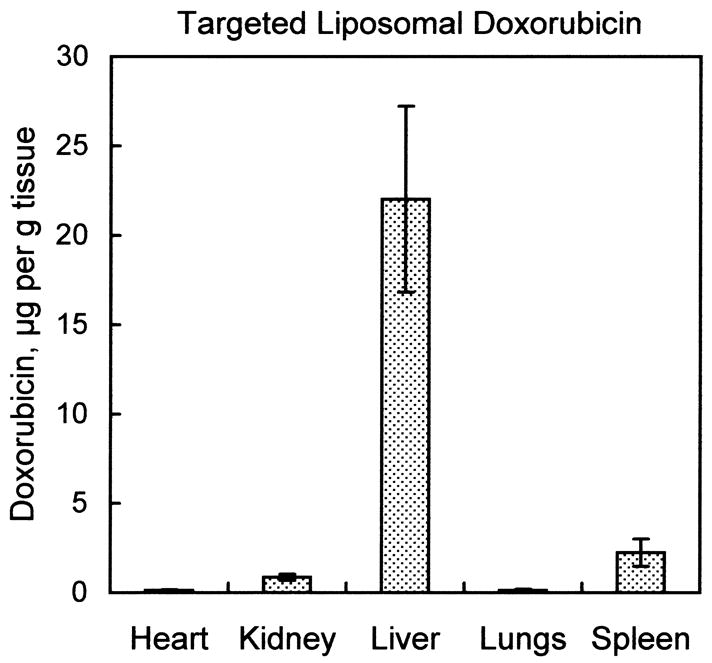
Organ biodistribution of doxorubicin in animals treated with free doxorubicin vs. animals treated with doxorubicin encapsulated into liver-targeting liposomes. Mice received a tail-vein injection of either 100 μg free doxorubicin, or 0.4 μmol liver-targeting liposomes with 100 μg encapsulated doxorubicin. Tissues were harvested after 1 h and doxorubicin extracted into organic solvent as described in Materials and Methods. Fluorescence emission spectra were measured and corrected for autofluorescence as shown in Fig. 4B. Micrograms doxorubicin were determined by comparing the fluorescence intensity at 590 nm to fluorescence intensities of known quantities of doxorubicin carried through an identical extraction procedure. (A) Biodistribution of free doxorubicin 1 h after injection. (B) Biodistribution of doxorubicin encapsulated into liver-targeting liposomes after 1 h. Values are mean ± s.e.m., n=4.
Table 2.
Relative organ distribution of doxorubicin delivered as free doxorubicin vs. targeted liposomal doxorubicin
| % of total in the 5 organs |
|
||||
|---|---|---|---|---|---|
| Organ | free doxorubicin | liposomal doxorubicin | free doxorubicin | liposomal doxorubicin | |
| Heart | 4.2 ± 0.7 % | 0.07 ± 0.03 % | 1.9 ± 0.7 | 171 ± 64 | |
| Kidney | 18.9 ± 1.1 % | 0.98 ± 0.27 % | 1.0 ± 0.3 | 26 ± 8.1 | |
| Liver | 71.5 ± 2.5 % | 97.6 ± 0.6 % | 1 | 1 | |
| Lungs | 4.0 ± 0.7 % | 0.07 ± 0.03 % | 3.0 ± 1.4 | 163 ± 85 | |
| Spleen | 1.5 ± 0.2 % | 1.2 ± 0.3 % | 5.0 ± 1.5 | 10 ± 4.1 | |
Values are calculated from the data presented in Fig. 5., and are mean ± s.e.m, n=4.
3.6. Histological studies of doxorubicin labeling of cell nuclei
Fig. 6 presents examples of fluorescent doxorubicin labeling of tissues of an adult BALB/c mouse euthanized 1 h following intravenous injection of doxorubicin contained within liver-targeting liposomes. The photomicrograph in Fig. 6A was taken with rhodamine epifluorescence optics and demonstrates that the doxorubicin label stands out clearly against a relatively dim background. The photomicrograph in Fig. 6B is of the same tissue section as Fig. 6A, but was taken with ultraviolet optics to show DAPI labeled cell nuclei. A comparison of Fig. 6A with Fig. 6B demonstrated that virtually all cell nuclei (as detected by DAPI staining) are also labeled by doxorubicin.
Fig. 6.

Fluorescence photomicrographs of tissue from an adult BALB/c mouse injected with doxorubicin, contained within liver-targeting liposomes, 1h prior to euthanasia. For each organ, the same tissue section is shown under rhodamine epifluorescence for doxorubicin (left column) and ultraviolet epifluorescence for DAPI nuclear labeling (right column). (A and B) Liver. (C and D) Heart. (E and F) Kidney. (G and H) Spleen. Note distinct red fluorescent doxorubicin labeling of cell nuclei in liver, but not heart or kidney. Doxorubicin labeling of cells in the marginal zone of spleen also is detected. cv: central vein; mz: marginal zone; wp: white pulp. Calibration bar in H = 100 μm and is the same for all photomicrographs.
In contrast, neither the heart (Fig. 6C and Fig. 6D) nor the kidney (Fig. 6E and Fig 6F) displayed any doxorubicin labeling of cell nuclei. Close examination revealed only dim background fluorescence, which was not associated with nuclei, although the DAPI stain clearly demonstrated that cell nuclei were present. The spleen (Fig. 6G and Fig. 6H) did display red fluorescence labeling in the marginal zone between the white pulp nodules and the red pulp. Doxorubicin labeled cells in this region also stained positively with antibodies to F4-80, identifying them as macrophages (data not shown).
The histology data presented in Fig. 6 confirmed the biodistribution data, indicating that the liposomes incorporating the peptide derived from Plasmodium, when loaded with doxorubicin, show a remarkably specific targeting to liver tissue. To ensure that our techniques were sufficiently sensitive to detect doxorubicin in other tissues, if it was present, mice were injected with free doxorubicin, and the tissue processed by methods identical to those described for processing mice injected with liver-targeting liposomes. Fig. 7 presents examples of the results. Photomicrographs from the liver are presented in Fig. 7A and 7B. The pattern of doxorubicin labeling in liver following injections of free doxorubicin appears very similar to the pattern of labeling following intravenous injection of doxorubicin contained within liposomes, as presented in Fig. 6. That is, virtually all the liver cell nuclei, as labeled by DAPI in Fig. 7B, appear also labeled by doxorubicin. Tissue sections of heart also showed prominent doxorubicin labeling of cell nuclei, as seen in Fig. 7C and Fig. 7D; this pattern of labeling is quite different from the absence of labeling illustrated in Fig 6C. Similarly, cells in kidney (Fig. 7E, F) displayed clearly labeled nuclei, with nuclei of convoluted tubules appearing more intensely stained than nuclei in glomeruli. Interestingly, the pattern of doxorubicin labeling in the marginal zone of the spleen (Fig. 7G,H) appeared very similar to the pattern shown in Fig. 6G.
Fig. 7.

Fluorescence photomicrographs of tissue from an adult BALB/c mouse injected with free doxorubicin 1h prior to euthanasia. For each organ, the same tissue section is shown under rhodamine epifluorescence for doxorubicin (left column) and ultraviolet epifluorescence for DAPI nuclear labeling (right column). (A and B) Liver. (C and D) Heart. (E and F) Kidney. (G and H) Spleen. Note distinct red fluorescent doxorubicin labeling of cell nuclei in all tissues. cv: central vein; gl: glomerulus; mz: marginal zone; rp: red pulp; wp: white pulp. Calibration bar in H = 100 μm and is the same for all photomicrographs.
3.7. Identification of liver cells labeled with doxorubicin
Examination of the photomicrograph in Fig. 6A revealed that varied shapes of liver cell nuclei appear labeled with doxorubicin. Some labeled nuclei were large and round and brightly stained, while other nuclei were oblong, oval, or in some cases indented. Several different cell types constitute the liver (Baratta et al., 2009), and it was deemed important to determine whether doxorubicin preferentially labeled one or more of the cell types. First, Fig. 8 presents a comparison of the red doxorubicin nuclear labeling (Fig. 8A) with blue DAPI nuclear staining (Fig. 8B). Fig. 8C presents a merged image of Fig. 8A with Fig. 8B, with the sites of overlap appearing as purple-colored nuclei. Note that virtually all the cell nuclei, irrespective of shape, that were stained by DAPI were also labeled by doxorubicin. In some nuclei with especially bright DAPI stain, the blue DAPI can apparently overwhelm a modest red doxorubicin labeling, but overall the co-labeling by the two methods is impressive. These results suggested that nuclei of all cell types within the liver contained doxorubicin.
Fig. 8.

Fluorescence photomicrographs showing relationships of doxorubicin labeling and other cell labeling techniques in liver sections. (A) Rhodamine optics reveal doxorubicin labeled nuclei. Note varied shapes of labeled nuclei. (B) UV fluorescence optics reveal DAPI labeled cell nuclei in same section as shown in ‘A’. Note virtually all nuclei are labeled both by doxorubicin and by DAPI. (C) Merged images A and B; double labeled cell nuclei appear as purple. (D) Merged image showing doxorubicin labeled cell nuclei (orange) and F4-80 immunocytochemically labeled Kupffer cells in green (arrows). (E) Merged image showing doxorubicin labeled cell nuclei (orange) and hepatocytes immunocytochemically labeled for albumin (green). (F) Merged image showing doxorubicin labeled nuclei (orange) and GFAP labeled Ito stellate cells (arrows) in green. (G) Pseudocolored image from deconvolution software showing a doxorubicin labeled red nucleus within a F4-80 green labeled cell. cv: central vein; hn: hepatocyte nucleus. Calibration bar in F = 50 μm and is the same for panels A through F. Calibration bar in G = 4μm.
Immunocytochemical procedures were used to more clearly identify the cell types with doxorubicin stained nuclei. In the case presented in Fig. 8D, the liver slice was processed for the F4-80 antibody, which labels Kupffer cells (Austyn and Gordon, 1981; Baratta et al., 2009). As indicated by the arrows, F4-80 labeled Kupffer cells are seen each containing a doxorubicin labeled nucleus. In Fig. 8E, an albumin antibody, which labels hepatocytes (Yokota and Fahimi, 1981; Baratta et al., 2009), demonstrated that the albumin-positive hepatocytes also were positive for doxorubicin-labeled nuclei. Similarly, Fig. 8F demonstrated that GFAP positive Ito stellate cells (Gard et al., 1985; Baratta et al., 2009) also have doxorubicin labeled nuclei. Finally, in Fig. 8G, laser confocal microscopy and deconvolution software demonstrated, at higher resolution, a close relationship between a doxorubicin labeled nucleus and, in this case, an F4-80 labeled Kupffer cell.
Counts of immunocytochemically identified cells revealed that virtually all labeled cells contained doxorubicin labeled nuclei. That is, 92% (105 of 114) of albumin positive hepatocytes, 97% (33 of 34) F4-80 positive Kupffer cells, and 100% (21 of 21) GFAP positive Ito stellate cells contained doxorubicin labeled nuclei.
3.8. Time course of doxorubicin labeling
An important issue for doxorubicin delivery concerns how rapidly the doxorubicin reaches cell nuclei, and the length of time it can be detected in cell nuclei, following intravenous injection. Fig. 9 presents photomicrographs showing doxorubicin labeling in sections of liver tissue from animals euthanized at varied times following intravenous injection of liver-targeting liposomes containing doxorubicin. Fig. 9A demonstrates that as soon as 5 min following intravenous injection, liver cell nuclei were already clearly labeled. After 1 h, as shown in Fig. 9B, cell nuclei were clearly and intensely labeled. Intensity of doxorubicin labeling appeared to decline between 4 h (Fig. 9C) and 6 h (Fig. 9D). In addition, the round nuclei of hepatocytes displayed a much more rapid apparent loss of fluorescence compared to the cell types with oval or elongated nuclei. By 12 h (Fig. 9E) the round nuclei appeared quite faintly labeled, while other nuclei remained relatively strongly labeled. The nuclei that remained strongly-labeled after 12 h appeared to be those of Kupffer cells because, as shown in Fig. 9F, tissue processed for the F4-80 antibody demonstrated that these cells contained doxorubicin labeled nuclei. Cells immunocytochemically labeled for albumin or with the GFAP antibody displayed only very faint doxorubicin labeled nuclei after 12 h.
Fig. 9.

Fluorescence photomicrographs of doxorubicin labeling of liver cell nuclei at varied times after intravenous injections of liver-targeting liposomes. (A) 5 min. (B) 1 h. (C) 4 h. (D) 6 h. (E) 12 h. (F) Double labeled tissue after 22 h, showing an example of a red doxorubicin labeled nucleus within a green F4-80 labeled Kupffer cell.
As a control, it was deemed important to determine whether the release of doxorubicin possibly occurred not in vivo, but rather during the histological processing of the liver tissue. In a separate experiment, liver-targeting liposomes were administered intravenously, and 5 min later liver tissue was removed quickly without perfusion and immediately frozen at −20°C. Frozen sections were prepared without further processing and immediately examined under the fluorescence microscope. Doxorubicin fluorescence was observed (data not shown) in cell nuclei and in the same pattern as presented in figure 9A.
The intensities of red doxorubicin fluorescence label in round (presumed hepatocyte) and oval (presumed non-parenchymal) cells (Baratta et al., 2009) were measured in liver sections from animals euthanized at varied times after intravenous injection of liver-targeting liposomes. Fig. 10 presents a histogram of the ratio of intensity of labeling of round nuclei labeling relative to intensity of oval nuclei labeling, as a function of time after intravenous injection. This quantitative assessment corroborates the qualitative impression from the images in Fig. 9, and further demonstrated that doxorubicin labeling of hepatocyte nuclei appeared three times as intense as labeling in nuclei of other cell types at 5 min after intravenous injection, and also that doxorubicin appears to be cleared from hepatocyte nuclei much more rapidly than from Kupffer cell nuclei.
Fig. 10.

Histogram showing the ratio of intensity of doxorubicin labeled round nuclei (of presumed hepatocytes) relative to the intensity of doxorubicin labeled oval nuclei (of non-parenchymal cells), from animals euthanized at varied times after intravenous injections of doxorubicin containing within liver-targeting liposomes. Bars show mean ratios, with standard deviations.
4. Discussion
4.1. Summary of results
The present investigation demonstrated that doxorubicin could be actively loaded into the liposomes using the ammonium sulfate gradient method (Fig. 1) (Abraham et al., 2005), indicating that the liver-targeting formulations were capable of forming a transbilayer proton gradient. Once loaded, the liposomes showed no evidence of doxorubicin leakage in the presence of serum when tested in vitro at 37°C (Fig. 2). When administered in vivo, the liposome-encapsulated doxorubicin was cleared rapidly from the blood (Fig. 3) and delivered almost exclusively to liver, and away from sensitive organs such as heart (Fig. 5B). With free doxorubicin, the ratio of doxorubicin in liver vs. heart (per g tissue weight) was approximately 2:1. When delivered within liver-targeting liposomes, the ratio of liver vs. heart was >100:1 (Table 2). Within the liver, histologic analysis indicated doxorubicin present in the nuclei of all identifiable cell types (Fig. 8). The release of doxorubicin from the liposomes was apparently quite rapid, as nuclei were labeled with doxorubicin fluorescence within 5 min after systemic administration (Fig. 9). Quantitative measurement of doxorubicin fluorescence intensity indicated an approximate 3-fold greater accumulation of doxorubicin in hepatocyte nuclei, per cell, compared to Kupffer cells, at early time points (5–15 min) after systemic administration (Fig. 10). Subsequent clearance of doxorubicin from hepatocyte nuclei appeared significantly faster than from Kupffer cells (Fig. 10).
4.2. Properties of the formulation
The characteristic feature of the liposome formulation is that all components contain the very-long-chain monoenoic fatty acid erucic acid, C22:1 cis-13. Formulations containing this fatty acid show no evidence of monomer transfer of lipid components in the presence of serum (Longmuir et al., 2006), and the liposomes are non-leaky in the presence of serum when the monoenoic fatty acid chain length is C20:1 or longer (Haynes et al., 2008). When the liver-targeting peptide is included, the liposomes do not aggregate in the presence of serum provided the molar ratio of lipid-PEG conjugate to lipid-peptide conjugate is >2.5:1 (Haynes et al., 2008), and the targeting remains effective when the PEG is included in the formulation (Longmuir et al., 2006; Haynes et al., 2008; Robertson et al., 2008). Most importantly, the targeting and in vivo biodistribution is unchanged upon repeat administration, and histologic analysis of liver tissue after repeat administration shows no evidence of toxicity or inflammation (Haynes et al., 2008).
4.3. Nanoparticle targeting strategy
Microorganism “nanoparticles” achieve highly-successful targeting as an essential step in host invasion, usually in a tissue-specific or cell-specific fashion. Most often, the targeting is directed towards glycosaminoglycans present on cell surfaces and in extracellular matrix (reviewed in Rostand and Esko, 1997). Thus far, only very limited work has been done to engineer glycosaminoglycan targeting strategies into synthetic nanoparticle delivery systems. However, as shown in the results here, this mechanism of glycosaminoglycan targeting can effectively deliver nanoparticle contents, in the case of liver, beyond reticuloendothelial barriers and into the parenchymal cells. Of particular note is the ability to combine the targeting peptide, as a lipid-peptide bioconjugate, into the liposome in the presence of a 3.5-fold excess of PE-PEG bioconjugate, and still achieve effective targeting. In the present formulation, the targeting peptide is attached to the liposome close to the surface of the bilayer, as the spacer arm of the EMCS cross-linker used in this investigation is only 9–10 angstroms in length. Hence the targeting peptide is surrounded by the dense layer of PEG2000. This positioning of the targeting peptide underneath the dense layer of polyethyleneglycol was verified experimentally by the measurement of a zeta potential of zero millivolts for the liver-targeting formulation that contained PE-PEG. It is our hypothesis that the targeting remains effective because the linear polysaccharide chains of the heparan sulfate proteoglycans can penetrate the polyethyleneglycol layer of the liposome and interact effectively with the peptide ligand. In contrast, we suggest it would be difficult for an antibody, protein opson, or proteolytic enzyme to penetrate the PEG layer and interact with the targeting peptide. This may explain our previously reported result that the liposome targeting is unchanged with repeat administration in vivo (Haynes et al., 2008).
Our previous electron microscopic studies of liposomal localization using phosphatidylethanolamine-gold particle labeling (Longmuir et al., 2006) demonstrated that while non-parenchymal cells were also labeled, the majority of the gold-labeled lipid was localized to hepatocytes. Similarly in the current study, the relative fluorescence intensity indicates that the nuclei of hepatocytes contain a three-fold greater quantity of doxorubicin than do nuclei of non-parenchymal cells, shortly after systemic administration. The preferential hepatocyte distribution of doxorubicin within the liver is likely to be related to the distribution of heparan sulfate proteoglycans. As we have demonstrated previously (Robertson et al., 2008) heparan sulfate immunoreactivity is found along the borders of the sinusoidal capillaries, and recent electron microscopic studies (Robertson and Longmuir, unpublished observations) indicate that heparan sulfate immunoreactivity is found along the basolateral borders of hepatocytes along the space of Disse. Because the targeting peptides of the liposomes appear to bind heparan sulfate proteoglycans (Robertson et al., 2008), the rich microvillous border of basolateral side of the hepatocytes in the space of Disse (Baratta et al., 2009) appears to offer an abundance of binding sites for the liver targeting liposomes beyond the endothelial cells.
Control liposomes without liver-targeting peptide remained virtually entirely in blood plasma, as they were well-coated with polyethyleneglycol (10% mol fraction of liposomal lipid). This result is consistent with our previously reported studies, which found virtually no uptake of systemically-administered control liposomes by liver after 1 h (Longmuir et al., 2006; Haynes et al., 2008). In addition, control liposomes show no binding to liver tissue in tissue slice experiments (Longmuir et al., 2006; Robertson et al., 2008). In contrast, liver-targeting liposomes were >80% cleared from the plasma within 1 h (Fig. 3).
4.4. Apparent triggered release
Of particular interest is the apparent release of the doxorubicin contents from the liver-targeting liposomes upon arrival at the target organ. The release of doxorubicin and its appearance within cell nuclei was remarkably rapid (within 5 min), and did not require an externally applied stimulus such as ultrasound. In contrast, the liposomes showed no release of contents when incubated with serum for several hours. At present, the mechanism of this apparent triggered release is not known. One hypothesis, which remains to be tested, is that the interaction of the liposome with the liver heparan sulfate proteoglycan is sufficiently strong that the liposome bilayer is destabilized, resulting in release of entrapped contents.
4.5. Comparison with other hepatocyte targeting strategies
A considerable body of literature has reported the development of both passive and active targeting strategies to preferentially target the parenchymal (hepatocyte) cells of the liver. Passive targeting to liver with a modest preference for hepatocytes has been reported for some liposome formulations (Scherphof and Kamps, 2001) and is dependent upon size and lipid composition, particularly the presence of phosphatidylserine (Daemen et al, 1997). These formulations have the disadvantage of interacting with serum components and are subject to clearance by opsonization (Yan et al., 2005). Active targeting strategies to deliver nanoparticles to the hepatocytes have focused primarily upon the asialoglycoprotein receptor (ASGP) (Rensen et al., 2001; Murao et al., 2002; Scherphof et al., 2002; Seymour et al., 2002; Wu et al, 2002; Managit et al., 2003; Fumoto et al., 2005; Nishikawa, 2005; Yan et al., 2005; Rozema et al., 2007), and the results have been variable (Yan et al., 2005). Targeting the ASGP appears effective for bioconjugates (Seymour et al., 2002) and for small nanoparticles (Rozema et al., 2007). However, Rensen et al. (2001) demonstrated that liposomes that display ASGP-targeting ligands cannot be recognized by the ASGP receptor if the liposome diameter is >70 nm. Nanoparticles that display ASGP-targeting ligands also appear to interact with blood components (Fumoto et al., 2005) and may be susceptible to opsonization.
Active targeting to the liver heparan sulfate proteoglycans appears to be an effective mechanism to deliver nanoparticles and nanoparticle contents beyond the liver sinusoidal region and into hepatocytes, as we found at early time points evidence for considerably more doxorubicin associated with hepatocyte nuclei compared to Kupffer cell nuclei. Doxorubicin proved to be an excellent compound for the demonstration of targeted liposome contents delivery. It can be conveniently loaded into liposomes at high concentration. The fluorescence properties of doxorubicin allow for quantitative measurement of biodistribution, both by extraction into organic solvent followed by fluorescence spectroscopy, as well as by fluorescence microscopy of fixed tissue sections. The purpose of this investigation was to test whether contents delivery of doxorubicin could be targeted to normal liver. The next step in this program will be to explore the targeted delivery characteristics of this formulation with liver tumor animal models.
The system reported here has several features that make it an attractive candidate for targeted doxorubicin delivery to liver tumor regions. 1) Delivery to the heart is exceptionally low, an issue of potential clinical importance because cardiotoxicity is the principal limiting factor in doxorubicin cancer therapy. 2) The nanoparticles cross endothelial barriers and deliver contents to parenchymal regions. 3) The nanoparticles release the contents upon arrival at the target organ. 4) The targeting is effective with large diameter (>100 nm) nanoparticles. 5) The nanoparticles can be stabilized with polyethyleneglycol and the delivery characteristics are the same with repeat administration (Haynes et al., 2008).
Acknowledgments
This work was supported by the National Institutes of Health EB-003075.
Footnotes
Publisher's Disclaimer: This is a PDF file of an unedited manuscript that has been accepted for publication. As a service to our customers we are providing this early version of the manuscript. The manuscript will undergo copyediting, typesetting, and review of the resulting proof before it is published in its final citable form. Please note that during the production process errors may be discovered which could affect the content, and all legal disclaimers that apply to the journal pertain.
References
- Abraham SA, Waterhouse DN, Mayer LD, Cullis PR, Madden TD, Bally MD. The liposomal formulation of doxorubicin. Methods Enzymol. 2005;391:71–97. doi: 10.1016/S0076-6879(05)91004-5. [DOI] [PubMed] [Google Scholar]
- Austyn JM, Gordon S. F4/80, a monoclonal antibody directed specifically against the mouse macrophage. Eur J Immunol. 1981;11:805–815. doi: 10.1002/eji.1830111013. [DOI] [PubMed] [Google Scholar]
- Baratta JL, Ngo A, Lopez B, Longmuir KJ, Robertson RT. Cellular organization of normal mouse liver: a histological, quantitative immunocytochemical, and fine structural analysis. Histochem Cell Biol. 2009;131:713–726. doi: 10.1007/s00418-009-0577-1. [DOI] [PMC free article] [PubMed] [Google Scholar]
- Byrne JD, Betancourt T, Brannon-Peppas L. Active targeting schemes for nanoparticle systems in cancer therapeutics. Adv Drug Deliv Rev. 2008;60:1615–1626. doi: 10.1016/j.addr.2008.08.005. [DOI] [PubMed] [Google Scholar]
- Daemen T, Velinova M, Regts J, de Jager M, Kalicharan R, Donga J, van der Want JJ, Scherphof GL. Different intrahepatic distribution of phosophatidylglycerol and phosphatidylserine liposomes in the rat. Hepatology. 1997;26:416–423. doi: 10.1002/hep.510260223. [DOI] [PubMed] [Google Scholar]
- Fields CG, Lloyd DH, Macdonald RI, Otteson KM, Noble RL. HBTU activation for automated Fmoc solid-phase peptide synthesis. Pept Res. 1991;4:95–101. [PubMed] [Google Scholar]
- Frevert U. Malaria sporozoite - hepatocyte interactions. Exp Parasitol. 1994;79:206–210. doi: 10.1006/expr.1994.1082. [DOI] [PubMed] [Google Scholar]
- Fumoto S, Kawakami S, Shigeta K, Higuchi Y, Yamashita F, Hashida M. Interaction with blood components plays a crucial role in asialoglycoprotein receptor-mediated in vivo gene transfer by galactosylated lipoplex. J Pharmacol Exp Ther. 2005;315:484–493. doi: 10.1124/jpet.105.089516. [DOI] [PubMed] [Google Scholar]
- Gard AL, White FP, Dutton G. Extra-neural glial fibrillary acidic protein (GFAP) immunoreactivity in perisinusoidal stellate cells of rat liver. J Neuroimmunol. 1985;8:359–375. doi: 10.1016/s0165-5728(85)80073-4. [DOI] [PubMed] [Google Scholar]
- Guy CA, Fields GB. Trifluoroacetic acid cleavage and deprotection of resin-bound peptides following synthesis by Fmoc chemistry. Methods Enzymol. 1997;289:67–83. doi: 10.1016/s0076-6879(97)89044-1. [DOI] [PubMed] [Google Scholar]
- Haley B, Frenkel E. Nanoparticles for drug delivery in cancer treatment. Urol Oncol. 2008;26:57–64. doi: 10.1016/j.urolonc.2007.03.015. [DOI] [PubMed] [Google Scholar]
- Haynes SM, Longmuir KJ, Robertson RT, Baratta JL, Waring AJ. Liposomal polyethyleneglycol and polyethyleneglycol-peptide combinations for active targeting to liver in vivo. Drug Deliv. 2008;15:207–217. doi: 10.1080/10717540802006211. [DOI] [PubMed] [Google Scholar]
- Kamps JAA, Scherphof GL. Biodistribution and uptake of liposomes in vivo. Methods Enzymol. 2004;387:257–266. doi: 10.1016/S0076-6879(04)87016-2. [DOI] [PubMed] [Google Scholar]
- Kim KY. Nanotechnology platforms and physiological challenges for cancer therapeutics. Nanomedicine. 2007;3:103–110. doi: 10.1016/j.nano.2006.12.002. [DOI] [PubMed] [Google Scholar]
- Longmuir KJ, Robertson RT, Haynes SM, Baratta JL, Waring AJ. Effective targeting of liposomes to liver and hepatocytes in vivo by incorporation of a Plasmodium amino acid sequence. Pharm Res. 2006;23:759–769. doi: 10.1007/s11095-006-9609-x. [DOI] [PubMed] [Google Scholar]
- Managit C, Kawakami S, Nishikawa M, Yamashita F, Hashida M. Targeted and sustained drug delivery using PEGylated galactosylated liposomes. Int J Pharm. 2003;266:77–84. doi: 10.1016/s0378-5173(03)00383-1. [DOI] [PubMed] [Google Scholar]
- Ménard R. The journey of the malaria sporozoite through its hosts: two parasite proteins lead the way. Microbes Infect. 2000;2:633–642. doi: 10.1016/s1286-4579(00)00362-2. [DOI] [PubMed] [Google Scholar]
- Mota MM, Rodriguez A. Invasion of mammalian host cells by Plasmodium sporozoites. Bioessays. 2002;24:149–156. doi: 10.1002/bies.10050. [DOI] [PubMed] [Google Scholar]
- Murao A, Nishikawa M, Managit C, Wong J, Kawakami S, Yamashita F, Hashida M. Targeting efficiency of galactosylated liposomes to hepatocytes in vivo: effect of lipid composition. Pharm Res. 2002;19:1808–1814. doi: 10.1023/a:1021433206081. [DOI] [PubMed] [Google Scholar]
- Nie S, Xing Y, Kim GJ, Simons JW. Nanotechnology applications in cancer. Annu Rev Biomed Eng. 2007;9:257–288. doi: 10.1146/annurev.bioeng.9.060906.152025. [DOI] [PubMed] [Google Scholar]
- Nishikawa M. Development of cell-specific targeting systems for drugs and genes. Biol Pharm Bull. 2005;28:195–2005. doi: 10.1248/bpb.28.195. [DOI] [PubMed] [Google Scholar]
- Pradel G, Garapaty S, Frevert U. Proteoglycans mediate malaria sporozoite targeting to the liver. Mol Microbiol. 2002;45:637–651. doi: 10.1046/j.1365-2958.2002.03057.x. [DOI] [PubMed] [Google Scholar]
- Rensen PC, Sliedregt LA, Ferns M, Kieviet E, van Rossenberg SM, van Leeuwen SH, van Berkel TJ, Biessen EA. Determination of the upper size limit for uptake and processing of ligands by the asialoglycoprotein receptor on hepatocytes in vitro and in vivo. J Biol Chem. 2001;276:37577–37584. doi: 10.1074/jbc.M101786200. [DOI] [PubMed] [Google Scholar]
- Rex CW, Lin CY, Kramar EA, Chen LY, Gall CM, Lynch G. Brain-derived neurotrophic factor promotes long-term potentiation-related cytoskeletal changes in adult hippocampus. J Neurosci. 2007;27:3017–3029. doi: 10.1523/JNEUROSCI.4037-06.2007. [DOI] [PMC free article] [PubMed] [Google Scholar]
- Robertson RT, Baratta JL, Haynes SM, Longmuir KJ. Liposomes incorporating a Plasmodium amino acid sequence target heparan sulfate binding sites in liver. J Pharm Sci. 2008;97:3257–3273. doi: 10.1002/jps.21211. [DOI] [PubMed] [Google Scholar]
- Rostand KS, Esko JD. Microbial adherence to and invasion through proteoglycans. Infect Immun. 1997;65:1–8. doi: 10.1128/iai.65.1.1-8.1997. [DOI] [PMC free article] [PubMed] [Google Scholar]
- Rozema DB, Lewis DL, Wakefield DH, Wong SC, Klein JJ, Roesch PL, Bertin SL, Reppen TW, Chu Q, Blokhin AV, Hagstrom JE, Wolff JA. Dynamic polyconjugates for targeted in vivo delivery of siRNA to hepatocytes. Proc Natl Acad Sci USA. 2007;104:12982–12987. doi: 10.1073/pnas.0703778104. [DOI] [PMC free article] [PubMed] [Google Scholar]
- Sato R, Itabashi Y, Fujishima H, Okuyama H, Kuksis A. Simple synthesis of diastereomerically pure phosphatidylglycerols by phospholipase D-catalyzed transphosphatidylation. Lipids. 2004;39:1025–1030. doi: 10.1007/s11745-004-1326-z. [DOI] [PubMed] [Google Scholar]
- Scherphof GL, Kamps JAAM. The role of hepatocytes in the clearance of liposomes from the blood circulation. Prog Lipid Res. 2001;40:149–166. doi: 10.1016/s0163-7827(00)00020-5. [DOI] [PubMed] [Google Scholar]
- Scherphof GL, Koning G, Bartsch M, Yan X, Kamps J. Targeting liposomes and lipoplexes to cells in the liver. Cell Mol Biol Lett. 2002;7:251–254. [PubMed] [Google Scholar]
- Seymour LW, Ferry DR, Anderson D, Hesslewood S, Julyan PJ, Poyner R, Doran J, Young AM, Burtles S, Kerr DJ, et al. Hepatic drug targeting: phase 1 evaluation of polymer-bound doxorubicin. J Clin Oncol. 2002;20:1668–1676. doi: 10.1200/JCO.2002.20.6.1668. [DOI] [PubMed] [Google Scholar]
- Shin SC, Vanderberg JP, Terzakis JA. Direct infection of hepatocytes by sporozoites of Plasmodium berghei. J Protozool. 1982;29:448–454. doi: 10.1111/j.1550-7408.1982.tb05431.x. [DOI] [PubMed] [Google Scholar]
- Wisse E. An electron microscopic study of the fenestrated endothelial lining of rat liver sinusoids. J Ultrastruct Res. 1970;31:125–150. doi: 10.1016/s0022-5320(70)90150-4. [DOI] [PubMed] [Google Scholar]
- Wisse E. An ultrastructural characterization of the endothelial cell in the rat liver sinusoid under normal and various experimental conditions, as a contribution to the distinction between endothelial and Kupffer cells. J Ultrastruct Res. 1972;38:528–562. doi: 10.1016/0022-5320(72)90089-5. [DOI] [PubMed] [Google Scholar]
- Wisse E, De Zanger RB, Charels K, van der Smissen P, McCuskey RP. The liver sieve: considerations concerning the structure and function of endothelial fenestrae, the sinusoidal wall and the space of Disse. Hepatology. 1985;5:683–692. doi: 10.1002/hep.1840050427. [DOI] [PubMed] [Google Scholar]
- Wu J, Nantz MH, Zern MA. Targeting hepatocytes for drug and gene delivery: emerging novel approaches and applications. Front Biosci. 2002;7:717–725. doi: 10.2741/A806. [DOI] [PubMed] [Google Scholar]
- Yan X, Scherphof GL, Kamps JAAM. Liposome opsonization. J Liposome Res. 2005;15:109–139. doi: 10.1081/lpr-64971. [DOI] [PubMed] [Google Scholar]
- Ying P, Shakibaei M, Patankar MS, Clavijo P, Beavis RC, Clark GF, Frevert U. The malaria circumsporozoite protein: interaction of the conserved regions I and II-plus with heparin-like oligosaccharides in heparan sulfate. Exp Parasitol. 1997;85:168–182. doi: 10.1006/expr.1996.4134. [DOI] [PubMed] [Google Scholar]
- Yokota S, Fahimi HD. Immunocytochemical localization of albumin in the secretory apparatus of rat liver parenchymal cells. Proc Nat’l Acad Sci USA. 1981;78:4970–4974. doi: 10.1073/pnas.78.8.4970. [DOI] [PMC free article] [PubMed] [Google Scholar]