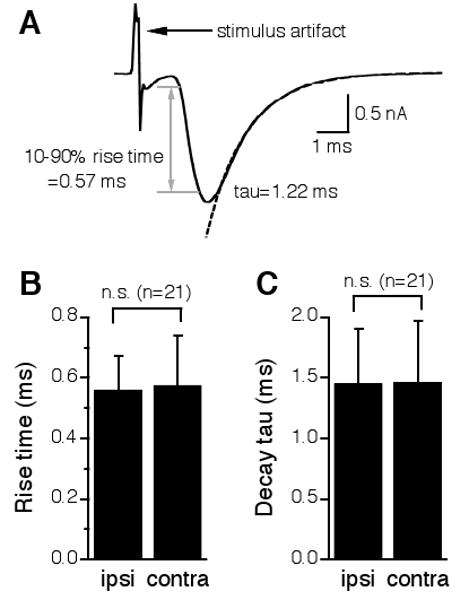
Figure 3.

The ipsilateral and the contralateral EPSCs in the same NL neurons have nearly identical kinetics. A: One representative EPSC showing the measurements of the 10-90% rise time and the decay time constant (tau). The time period that takes for the EPSC to change from 10% to 90% of its peak value is defined as the 10-90% rise time (indicated by the gray lines and the double-head arrow). The decay tau was measured by fitting a single exponential curve (dashed line) to the portion from the peak of the EPSC to the baseline. B and C: A paired t-test revealed no statistical differences between the ipsilateral and the contralateral EPSCs in either 10-90% rise time or decay tau.
