

Abstract
Background
Spirometry is an indispensable tool for diagnosis and monitoring of chronic airways disease in primary care.
Aim
To establish the quality of routine spirometry tests in general practice, and explore associations between test quality and patient characteristics.
Design of study
Analysis of routine spirometry test records.
Setting
Fifteen general practices which had a working agreement with a local hospital pulmonary function laboratory for spirometry assessment regarding test quality and interpretation.
Method
Spirometry tests were judged by a pulmonary function technician and a chest physician. Proportions of test adequacy were analysed using markers for manoeuvre acceptability and test reproducibility derived from the 1994 American Thoracic Society spirometry guideline. Associations between quality markers and age, sex, and severity of obstruction were examined using logistic regression.
Results
Practices performed a mean of four (standard deviation = 2) spirometry tests per week; 1271 tests from 1091 adult patients were analysed; 96.4% (95% confidence interval [CI] = 95.6 to 97.2) of all tests consisted of ≥3 blows. With 60.6% of tests, forced expiratory time was the marker with the lowest acceptability rate. An overall 38.8% (95% CI = 36.0 to 41.6) of the tests met the acceptability as well as reproducibility criteria. Age, sex, and severity of obstruction were associated with test quality markers.
Conclusion
The quality of routine spirometry tests was better than in previous reports from primary care research settings, but there is still substantial room for improvement. Sufficient duration of forced expiratory time is the quality marker with the highest rate of inadequacy. Primary care professionals should be aware of patient characteristics that may diminish the quality of their spirometry tests. Further research is needed to establish to what extent spirometry tests that are inadequate, according to stringent international expert criteria, result in incorrect clinical interpretations in general practice.
Keywords: diagnosis; family practice; lung diseases, obstructive; quality of health care; spirometry
INTRODUCTION
Spirometry is currently being promoted as an indispensable tool for primary care doctors and nurses to diagnose and monitor chronic airways disease.1,2 Several previous studies indicate that primary care spirometry increases rates of diagnosis for chronic respiratory disease and may also lead to improvements in its treatment.3–5 However, good-quality spirometry requires comprehensive training of staff, reliable equipment, and well-standardised measurement procedures.6 This may be difficult to achieve in primary care practice, especially when tests are rather infrequently administered, which appears to be the case in most practices.7
In a previous study by the current authors it was observed that the most relevant spirometric indices, as measured by trained general practice staff, were comparable to those measured in pulmonary function laboratories.8 In an earlier study, investigators from New Zealand demonstrated a significant effect of spirometry workshops on test quality, but concluded that the spirometry performed in primary care practices did not generally satisfy the full criteria for acceptability and reproducibility.9 One feature that these two studies have in common is that they were both conducted as research exercises. Because of this, the findings may not provide a reflection of the actual quality of spirometry as performed in usual primary care practice.
In an attempt to arrange good-quality primary care spirometry, 15 general practices in the region surrounding the Elkerliek general hospital in the city of Helmond, the Netherlands have established a working agreement with the hospital regarding the support of spirometry training, interpretation, and performance. Practices can request on-site technical support and supervision by a technician from the hospital's pulmonary laboratory service. The current study aimed to establish the quality of routine general practice spirometry tests within this ‘real-life’ setting. In addition, it explored whether in this particular setting the quality of spirometry tests is associated with patients' sex and age, and the presence of obstruction.
METHOD
Setting and spirometry tests
Using a central database, analysis was carried out of all routine care spirometry tests (either a prebronchodilator test alone or a full reversibility test consisting of a prebronchodilator and a postbronchodilator test) that had been submitted by GPs from March 2003 to August 2005. Each of the 15 general practices involved owns a PC-based spirometer and software (SpiroPerfect™, Welch Allyn, Delft, the Netherlands). The hospital's pulmonary laboratory service has direct access to the tests submitted by GPs. Spirometry training and support has been offered to GPs (with a focus on test interpretation), practice nurses, and practice assistants (with a focus on performing tests) once or twice a year since the late 1990s.
How this fits in
Spirometry is an indispensable tool for primary care doctors and nurses to diagnose and monitor chronic airways disease. Good-quality spirometry requires comprehensive training of staff, reliable equipment, and well-standardised measurement procedures, which may be difficult to achieve in a general practice. In this study, the quality of routine spirometry tests was better than in previous reports from primary care research settings, but there is still substantial room for improvement. Sufficient duration of forced expiratory time is the quality marker with the highest rate of inadequacy. Primary care professionals should be aware of patient characteristics that may diminish the quality of their spirometry tests.
After online submission of results to the central database, the quality of spirometry tests is first judged by a pulmonary function technician. Based on the 1994 American Thoracic Society spirometry guideline,6 several spirometry quality markers were derived for every test submitted by the general practices. (It was decided not to use the more recent 2005 guideline10 because it had not yet been published at the time when the spirometry tests were performed.) Box 1 shows the test quality markers as extracted from the 1994 American Thoracic Society spirometry guideline, and for each marker whether or not it could be included in the study analysis of general practice spirometry test quality. Figure 1 shows examples of unacceptable blows for markers that can be judged from the flow–volume curve. After the pulmonary function technician's quality assessment, each test is diagnostically assessed by one of the hospital's chest physicians, who records the presence and/or severity of airflow obstruction, reversibility after bronchodilation, and a possible restrictive pattern. The combined results of the quality assessment and the diagnostic assessment of each test are reported back to the general practice.
Box 1. Markers of spirometry test quality as derived from the 1994 American Thoracic Society spirometry guideline.6
| Criteria to differentiate test quality | Included in current study | |
|---|---|---|
| ▸Markers for acceptability of separate blows | ||
| Flow–volume curve shows steep initial incline | Acceptable versus unacceptable | Yes |
| Flow–volume curve shows sharp peak | Acceptable versus unacceptable | Yes |
| Flow–volume curve shows uninterrupted forced expiration | Acceptable versus unacceptable | Yes |
| Forced expiration of reasonable durationa | Acceptable versus unacceptable | Yes |
| Forced expiratory time | <6 seconds versus ≥6 seconds | Yes |
| Back-extrapolated volume | <5% of FVC or 0.15 litre, whichever is greater | No |
| Volume–time curve shows an obvious plateaub | Acceptable versus unacceptable | No |
| ▸Markers for reproducibility of test | ||
| Number of acceptable forced manoeuvres | ≥3 manoeuvres versus <3 manoeuvres | Yes |
| Reproducibilityc of FEV1 | <0.2 litre versus ≥0.2 litre | Yes |
| Reproducibilityc of FVC | <0.2 litre versus ≥0.2 litre | Yes |
FVC = forced vital capacity. FEV1 = forced expiratory volume in 1 second.
For patients with airways obstruction or older patients, exhalation times longer than 6 seconds are frequently needed to reach a plateau.
No change in volume for at least 1 second after an exhalation time of at least 6 seconds.
Difference between highest and second highest values of the two manoeuvres with the highest sum of FEV1 and FVC.
Figure 1.
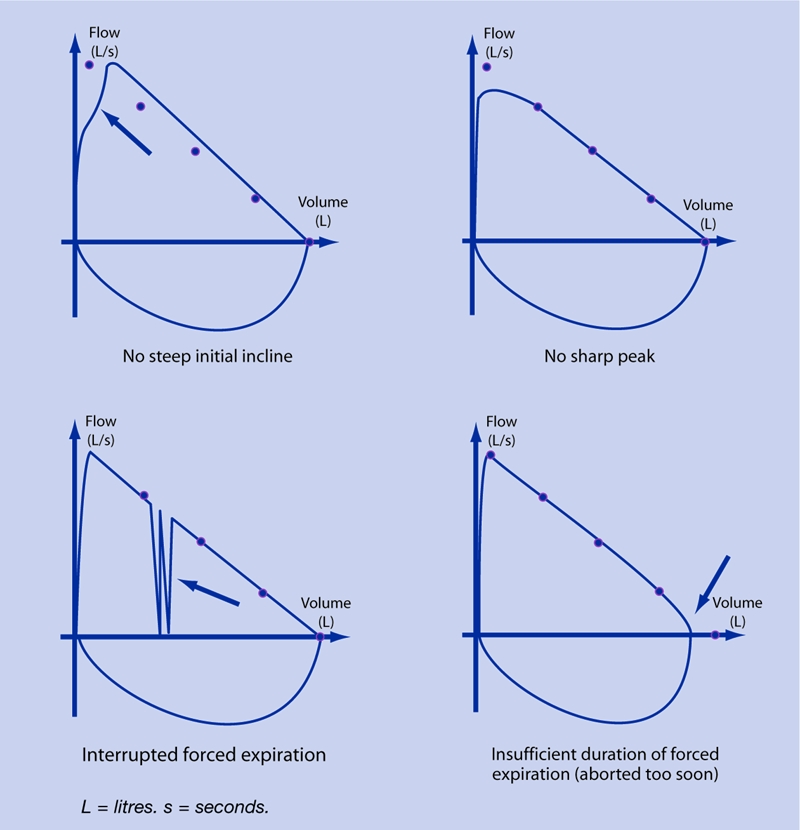
Examples of unacceptable spirometry test quality markers as read from the flow–volume curve.
Statistical analysis
For repeated measurements, the same patient could contribute multiple spirometry tests. For the analysis of spirometry test quality, only the prebronchodilator tests of patients aged ≥12 years were used. After analysis of the test quality markers for the total study population, 675 patients (62%) could be stratified according to the severity of their airflow obstruction as judged by a chest physician. When the chest physician had judged that obstruction was present but had not indicated the severity (12% of all patients with obstruction), the cut-off values from the Global Initiative for Chronic Obstructive Lung Disease guideline11 were used to categorise severity: forced expiratory volume in 1 second (FEV1) % predicted >80% for mild; 50–80% for moderate; and <50% for severe and very severe obstruction. European Coal and Steel Community reference equations were used to calculate FEV1 predicted values.12 Patient characteristics were compared between severity subgroups using χ2 tests and analysis of variance. Multivariable logistic regression analysis was used to explore associations between spirometry test quality markers and sex, age, and severity of obstruction. The odds ratio (OR) estimates from the logistic regression models express the (adjusted) risk for an inadequate test quality marker to be present. Statistical tests were two-sided, and P<0.05 was considered statistically significant.
RESULTS
General practices
Spirometry tests had been submitted by all 15 general practices comprising 49 GPs (mean number of GPs per practice = 3.3, range = 1–5). Two practices (13%) had implemented spirometry <1 year ago, three practices for 1–2 years ago, and the remaining practices ≥2 years ago. A mean of four spirometry tests (standard deviation [SD] = 2) were performed per week. Spirometry was administered by a practice assistant in 12 practices, by a practice nurse in six practices, and by a GP in two practices (in some practices, more than one type of healthcare professional administered spirometry).
Patients
Mean age of the study population (n = 1091) was 53.4 (SD 16.9) years (Table 1), and mean FEV1 % predicted was 82.5% (SD 21.0%); 143 patients (13.1%) contributed two spirometry tests to the database on two different dates, 18 patients (1.7%) contributed three or more tests. Bronchodilator reversibility testing was performed in 92.5% of all the patients involved.
Table 1.
Characteristics of the study population (n = 1091) and the subgroup identified with airflow obstruction as judged by a chest physician (n = 675).a
| Presence of obstruction according to chest physician (n = 675) | ||||||
|---|---|---|---|---|---|---|
| Total | No | Mild | Moderate | Severec | P-valueb | |
| n | 1091 | 357 | 136 | 112 | 70 | |
| Sex, % male | 49.0 | 42.3 | 49.3 | 60.7 | 71.4 | <0.001 |
| Age, years | 53.4 | 47.5 | 50.2 | 60.9 | 65.8 | <0.001 |
| (16.9) | (16.2) | (16.4) | (13.8) | (11.0) | ||
| FEV1,d litres | 2.52 | 3.07 | 2.60 | 1.96 | 1.33 | <0.001 |
| (0.93) | (0.74) | (0.79) | (0.61) | (0.52) | ||
| FEV1 % | 82.5 | 98.1 | 83.1 | 66.9 | 48.1 | <0.001 |
| predictedd | (21.0) | (14.3) | (13.0) | (11.5) | (17.4) | |
| FVC,d litres | 3.35 | 3.74 | 3.68 | 3.12 | 2.59 | <0.001 |
| (1.10) | (0.93) | (1.15) | (0.93) | (0.92) | ||
| FEV1/FVC,d % | 75.2 | 82.5 | 71.2 | 63.6 | 52.1 | <0.001 |
| (12.6) | (6.8) | (8.9) | (8.8) | (11.8) | ||
Figures are means (SD) unless stated otherwise.
Test for differences between subgroups based on severity of airflow obstruction.
Including very severe obstruction.
Based on first postbronchodilator measurement available in the database for each patient. FEV1 = forced expiratory volume in 1 second; FVC = forced vital capacity.
Indications for spirometry as reported by the GPs were: (re)assessment of previous diagnosis of chronic airways disease, including tests to assess possible exacerbations (42%); diagnostic assessment without prior diagnosis of chronic airways disease (35%); periodic monitoring of lung function (13%); evaluation of diagnostic prednisolone test (6%); and screening of smokers (4%).
Acceptability and reproducibility of spirometry tests
A total of 1271 prebronchodilator tests comprising 3968 forced expiratory manoeuvres (blows) were available for analysis. Mean number of blows per test was 3.1 (range = 1–9) and 97.8% (95% confidence interval [CI] = 97.0 to 98.6) of all tests consisted of three or more blows; 38.8% (95% CI = 36.0 to 41.6) of the tests met the acceptability as well as the reproducibility criteria (Table 2). The proportion of tests that met all five assessed acceptability markers was 43.3% (95% CI = 40.2 to 45.8; Table 3).
Table 2.
Quality assurance data from 1271 prebronchodilator spirometry tests from the 15 general practices involved in the study.
| Number of tests | % (95% CI) | |
|---|---|---|
| Number of patient testsa | 1271a | 100 |
| ≥3 blows | 1243 | 97.8 (97.0 to 98.6) |
| ≥3 acceptable blows | 550 | 43.3 (40.2 to 45.8) |
| ≥2 acceptable and reproducible blows | 493 | 38.8 (36.0 to 41.6) |
Comprising 3968 blows.
Table 3.
Results of overall assessment of acceptability markers for 1271 general practice spirometry tests comprising 3968 forced expiratory manoeuvres.
| % adequate | 95% CI | |
|---|---|---|
| Flow–volume curve shows steep initial inclinea | 92.7 | 91.3 to 94.1 |
| Flow–volume curve shows sharp peaka | 88.1 | 86.3 to 89.9 |
| Flow–volume curve shows uninterrupted expirationa | 84.3 | 82.3 to 86.3 |
| Forced expiration of reasonable durationa | 80.5 | 78.3 to 82.7 |
| Forced expiratory time | 60.6 | 58.6 to 62.6 |
| Adequate for all acceptability markers | 43.3 | 40.2 to 45.8 |
According to judgement of pulmonary function technician.
In 37.6% of all tests, one marker was judged by the pulmonary function technician to be unacceptable, two markers in 11.4%, three markers in 5.2%, and four or five markers in 2.5%. With 60.6%, forced expiratory time was the marker with the lowest rate of acceptability. The average forced expiratory time was 7.6 seconds (SD 3.9 seconds). Adequacy of the other acceptability markers ranged from 80.5% for duration of the forced expiration to 92.7% for steep initial incline of the flow–volume curve (Table 3).
Associations between acceptability markers and patient characteristics
Age, sex, and severity of obstruction were associated with one or more of the acceptability markers (Table 4). Compared with males, females had a higher ‘risk’ of unacceptable blows for two markers, that is, duration of forced expiration (OR = 1.57, 95% CI = 1.15 to 2.14) and initial incline to peak flow (OR = 3.00, 95% CI = 1.50 to 6.00). In one or more of the older age groups, the risk of an unacceptable marker increased for initial incline to peak flow, sharpness of peak, and course of forced expiration. The presence of obstruction showed an inverse relationship with the initial incline to peak flow, sharpness of peak, course of forced expiration, and duration of the forced expiration (Table 4). When the fully acceptable tests were offset against the tests with one or more markers that indicated unacceptability, females showed a higher risk of test unacceptability (OR = 1.67, 95% CI = 1.23 to 2.35; not shown in Table 4).
Table 4.
Results of multivariable logistic regression analyses for associations between markers of forced expiratory manoeuvre acceptability and sex, age, and degree of airflow obstruction as established by a chest
| Acceptability marker | OR (95% CI) | P-value |
|---|---|---|
| Initial steep incline of flow–volume curve | ||
| Femalesa | 3.00 (1.50 to 6.00) | 0.002 |
| 50–60 yearsb | 2.41 (0.92 to 6.30) | 0.073 |
| 60–70 yearsb | 7.03 (2.94 to 16.81) | <0.001 |
| >70 yearsb | 5.87 (2.11 to 16.32) | 0.001 |
| Mild obstructionc | 0.28 (0.10 to 0.77) | 0.013 |
| Moderate obstructionc | 0.47 (0.20 to 1.10) | 0.080 |
| (Very) severe obstructionc | 0.09 (0.12 to 0.69) | 0.021 |
| Sharp peak of flow–volume curve | ||
| Femalesa | 1.46 (0.89 to 2.40) | 0.133 |
| 50–60 yearsb | 1.10 (0.58 to 2.11) | 0.764 |
| 60–70 yearsb | 2.76 (1.51 to 5.04) | 0.001 |
| >70 yearsb | 1.12 (0.46 to 2.75) | 0.799 |
| Mild obstructionc | 0.20 (0.09 to 0.46) | <0.001 |
| Moderate obstructionc | 0.29 (0.14 to 0.63) | 0.002 |
| (Very) severe obstructionc | 0.05 (0.01 to 0.38) | 0.004 |
| Uninterrupted course of expiratory part of flow–volume curve | ||
| Femalesa | 1.06 (0.68 to 1.64) | 0.789 |
| 50–60 yearsb | 1.04 (0.58 to 1.85) | 0.894 |
| 60–70 yearsb | 2.31 (1.33 to 4.03) | 0.003 |
| >70 yearsb | 1.30 (0.62 to 2.83) | 0.485 |
| Mild obstructionc | 0.17 (0.08 to 0.37) | <0.001 |
| Moderate obstructionc | 0.20 (0.10 to 0.43) | <0.001 |
| (Very) severe obstructionc | 0.25 (0.11 to 0.60) | 0.002 |
| Duration of forced expiration ≥6 seconds | ||
| Femalesa | 1.57 (1.15 to 2.14) | 0.005 |
| 50–60 yearsb | 0.68 (0.45 to 1.03) | 0.069 |
| 60–70 yearsb | 1.14 (0.75 to 1.74) | 0.540 |
| >70 yearsb | 0.72 (0.44 to 1.19) | 0.197 |
| Mild obstructionc | 0.60 (0.40 to 0.88) | 0.010 |
| Moderate obstructionc | 0.31 (0.19 to 0.49) | <0.001 |
| (Very) severe obstructionc | 0.50 (0.29 to 0.86) | 0.013 |
| Reasonable duration of forced expiration | ||
| Femalesa | 0.97 (0.63 to 1.48) | 0.876 |
| 50–60 yearsb | 1.16 (0.66 to 2.03) | 0.609 |
| 60–70 yearsb | 1.32 (0.74 to 2.35) | 0.353 |
| >70 yearsb | 1.31 (0.69 to 2.49) | 0.401 |
| Mild obstructionc | 0.90 (0.50 to 1.61) | 0.719 |
| Moderate obstructionc | 1.16 (0.65 to 2.06) | 0.617 |
| (Very) severe obstructionc | 2.09 (1.12 to 3.89) | 0.020 |
Odds ratio (OR) expresses the risk of an inadequate test quality marker compared to the reference category. Statistically significant associations (P<0.05) are printed bold.
Males as reference category.
Age <50 years as reference category.
No obstruction as reference category.
DISCUSSION
Summary of main findings
This study aimed to establish the quality of general practice spirometry tests outside a typical research setting, and explored whether spirometry test quality was associated with patients' sex and age, and the presence of obstruction in patients tested in general practice. It was found that 39% of all tests performed in the general practices met the combined set of acceptability and reproducibility markers as derived from the 1994 American Thoracic Society spirometry guideline. Too short forced expiratory time was the marker with the lowest rate of acceptability (60.6%). Several associations were observed between test acceptability markers and sex, age, and presence or severity of airflow obstruction.
Strengths and limitations of the study
Particular strengths of this study are that all the tests in the spirometry database were obtained from ‘regular’ (that is, non-academic) general practices, and that they were performed as a part of routine testing in daily patient care. Compared to Dutch national figures, the general practices in the present study were mostly group practices with three or more GPs (56% versus 13% nationally), had slightly less experience with spirometry (6 versus 7 years), and performed a similar number of spirometry tests per month (16 versus 17 tests/month).13,14 A weakness of the study may be that all practices involved in the evaluation participated in the working agreement with the local hospital, which may limit the external validity of the findings; it is not possible to tell from this study how practices that have no expert support for their spirometry would perform.
Despite these shortcomings, the present findings contribute to the current knowledge regarding spirometry test quality in primary care, and identify points of impact for quality improvement.
Comparison with existing literature
Too short forced expiratory times and early termination of expiratory manoeuvres have previously been recognised as one of the main deficiencies of spirometry in general,15,16 and of primary care spirometry in particular.9,17 In this study, associations were observed between several spirometry acceptability markers and both presence of airflow obstruction and older age. An association between older age and worse spirometry test performance has been reported previously, and is likely to be explained by cognitive impairment in older people.9,18–20 Contrary to previous reports in which male sex was associated with poorer reproducibility of FEV1,19 the present study showed an association of female sex with test inadequacy for two acceptability markers: forced expiratory time and initial incline to peak flow. The explanation may be that females feel more embarrassed than males while performing forced expiratory manoeuvres because of the possibility of leaking urine.13
Differences between previous studies and the present observations may be caused by several factors. Different levels of spirometry training among the primary care professionals who administer the tests is certainly one of these factors.7 The achievements of the general practices in the current study contrast with those previously reported from a New Zealand study, which showed far more dramatic results: 3–13% percent of all tests were acceptable and reproducible, with almost the same set of criteria as used in the present study.9
A comparison with the studies reported from pulmonary function laboratories shows that in research as well as in routine care the proportion of reproducible tests is generally at least 90% (Appendix 1). It is doubtful whether primary care professionals will ever be able to approach this performance level. Apart from limited training and quality assurance activities, lack of experience and routine are likely to be important factors in the high rate of low-quality spirometry tests observed in general practice.7,21 On the other hand, it is currently unclear what the actual impact of inadequate spirometry tests on diagnosis and patient management is. The current authors have previously demonstrated that, compared with measurements from pulmonary function laboratories in the same patients, FEV1 and forced vital capacity as measured by trained general practice staff do not necessarily result in differences that are relevant in general practice.22 This suggests that an important proportion of spirometry tests that are technically ‘imperfect’ according to the stringent international test criteria6,10 may still provide the GP with useful results on which to base diagnosis and patient management. In the authors' view, obtaining sufficiently reliable and clinically meaningful spirometry tests — not necessarily perfect tests — is what primary care should be striving for.
If spirometry is to be widely available in primary care, the logistics of training and maintaining standards among large numbers of primary care physicians and nurses requires condensed and pragmatic training programmes. However, training alone will not guarantee sufficient test quality in the longer term.9,19 A recent report from the UK concluded that the quality of primary care spirometry was unsatisfactory, and its authors suggested that remote reporting of tests may be a means of establishing adequate spirometry.23 Studies conducted in specialised,16,18,19,24,25 as well as in primary care settings9,26 suggest that quality-assurance initiatives are able to improve spirometry test quality.
Implications for clinical practice
In this real-life study it was found that quality aspects of spirometry tests in Dutch general practice were better than those previously reported from primary care research settings, but test quality does not approach the levels observed in pulmonary function laboratories. Duration of forced expiration is the quality marker with the highest rate of inadequacy. Primary care professionals who administer spirometry to their patients should be aware of the patient characteristics that may diminish the quality of their spirometry tests. Implementation of contemporary and efficient modes of training and quality assurance feedback may raise and maintain the standards of primary care spirometry.
Acknowledgments
The authors wish to express their gratitude to the GPs, practice nurses, practice assistants, chest physicians, pulmonary function technicians, and patients who contributed to the spirometry database. We specifically want to thank Dr Ivo Smeele, who initiated the Quartz central spirometry service in the late 1990s, and Mr. Casper de Jonge, who kindly extracted the necessary data from the Elkerliek Hospital spirometry database.
Appendix 1. Proportions of adequate spirometry tests with regard to forced expiratory volume in 1 second (FEV1) and forced vital capacity (FVC) reproducibility criteria in published primary care studies.
| Reproducibility (% adequate) | ||||||
|---|---|---|---|---|---|---|
| Author, publication year | Country | Setting | Study population | Number of patients | FEV1, % | FVC, % |
| Primary care practice | ||||||
| Schermer et al,I 2009 (current paper) | The Netherlands | Routine care | Adults and children ≥12 years from 15 primary care practices | 1091 | 43 | 40 |
| Tuomisto et al, 200827 | Finland | Routine care | Patients from primary care health centres | 489 | 78 to 80a,b | |
| Walters et al, 200828 | Australia | Research | Adults from eight primary care practices | 618 | 44 to 76a,c | |
| Eaton et al,II 19999 | New-Zealand | Research | Adults and children from 30 primary care practices | 1012 | 3 to 14a,c | |
| Schermer et al,I 200322 | The Netherlands | Research | Patients with COPD recruited from 61 primary care practices | 399 | 82d | – |
| Zanconato et al,III 200529 | Italy | Research | Children from 10 primary care paediatric practices | 109 | 94a | |
| Pulmonary function laboratory | ||||||
| Enright et al,IV 200430 | US | Routine care | Adult patients from one outpatient pulmonary function laboratory | 18 000 | >95 | >90 |
| Enright et al,V 200015 | US | Routine care | Public schools students aged 9–18 years from middle-income communities | 4000 | 93 | 97 |
| Bellia et al,VI 200019 | Italy | Research | Patients ≥65 years attending one of the 24 involved pulmonary or geriatric institutions | 1622 | >94 | >87 |
| Stoller et al,II 199731 | US | Research | Patients with severe α1 antitrypsin deficiency, from 37 hospitals | 1090 | >95 | >91 |
| Enright et al,VII 199116 | US | Research | Cigarette smokers 35 to 60 years of age included in a clinical trial | 5887 | >99 | – |
Studies conducted in pulmonary function laboratories are included as points of reference. Studies have used different definitions for reproducibility, which limits direct comparison of results.32
Definitions used in the respective studies are:
Two highest FEV1 values <5% and <200 ml;
Largest FEV1 values and largest FVC values ≤200 ml;
Two highest FEV1 values and FVC values ≤5%;
Difference between highest and second-highest FEV1 <150 mL;
FVC and FEV1 values at least 95% of the largest values;
Difference between highest and second-highest value <200ml for FEV1 and FVC;
Difference between highest and second-highest FVC <200ml.
Reproducibility results not reported for FEV1 and FVC separately.
For pre- and postbronchodilator tests respectively.
For usual and trained practices respectively.
Reproducibility calculated without prior selection of acceptable blows according to 1994 American Thoracic Society spirometry guidelines.6
COPD = chronic obstructive pulmonary disease.
Funding body
None
Ethics committee
The medical ethics review board of the Elkerliek Hospital approved the study. Because only routine lung function data were used for this retrospective database analysis and the investigators had no access to the patients' medical records or information on patients' identity, no written informed consent was obtained
Competing interests
The authors have stated that there are none
Discuss this article
Contribute and read comments about this article on the Discussion Forum: http://www.rcgp.org.uk/bjgp-discuss
Footnotes
[Editor: when creating the AB version, note that these references 27-32 are included only in Appendix 1]
REFERENCES
- 1.Levy ML, Fletcher M, Price DB, et al. International Primary Care Respiratory Group (IPCRG) guidelines: diagnosis of respiratory diseases in primary care. Prim Care Respir J. 2006;15(1):20–34. doi: 10.1016/j.pcrj.2005.10.004. [DOI] [PMC free article] [PubMed] [Google Scholar]
- 2.Bellamy D, Bouchard J, Henrichsen S, et al. International Primary Care Respiratory Group (IPCRG) guidelines: management of chronic obstructive pulmonary disease (COPD) Prim Care Respir J. 2006;15(1):48–57. doi: 10.1016/j.pcrj.2005.11.003. [DOI] [PMC free article] [PubMed] [Google Scholar]
- 3.Spann SJ. Impact of spirometry on the management of chronic obstructive airway disease. J Fam Pract. 1983;16(2):271–275. [PubMed] [Google Scholar]
- 4.Walker PP, Mitchell P, Diamantea F, et al. Effect of primary care spirometry on the diagnosis and management of COPD. Eur Respir J. 2006;28(5):945–952. doi: 10.1183/09031936.06.00019306. [DOI] [PubMed] [Google Scholar]
- 5.Lusuardi M, De Benedetto F, Paggiaro P, et al. A randomized controlled trial on office spirometry in asthma and COPD in standard general practice: data from spirometry in asthma and COPD: a comparative evaluation Italian study. Chest. 2006;129(4):844–852. doi: 10.1378/chest.129.4.844. [DOI] [PubMed] [Google Scholar]
- 6.American Thoracic Society. Standardization of spirometry: 1994 update. Am J Respir Crit Care Med. 1995;152(3):1107–1136. doi: 10.1164/ajrccm.152.3.7663792. [DOI] [PubMed] [Google Scholar]
- 7.Johns DP, Burton D, Walters JA, et al. National survey of spirometer ownership and usage in general practice in Australia. Respirology. 2006;11(3):292–298. doi: 10.1111/j.1440-1843.2006.00851.x. [DOI] [PubMed] [Google Scholar]
- 8.Schermer TR, Jacobs JE, Chavannes NH, et al. Validity of spirometric testing in a general practice population of patients with chronic obstructive pulmonary disease (COPD) Thorax. 2003;58(10):861–866. doi: 10.1136/thorax.58.10.861. [DOI] [PMC free article] [PubMed] [Google Scholar]
- 9.Eaton T, Withy S, Garrett JE, et al. Spirometry in primary care practice: the importance of quality assurance and the impact of spirometry workshops. Chest. 1999;116(2):416–423. doi: 10.1378/chest.116.2.416. [DOI] [PubMed] [Google Scholar]
- 10.Miller MR, Hankinson J, Brusasco V, et al. Standardisation of spirometry. Eur Respir J. 2005;26(2):319–338. doi: 10.1183/09031936.05.00034805. [DOI] [PubMed] [Google Scholar]
- 11.Global Initiative for Chronic Obstructive Lung Disease (GOLD) Guidelines: global strategy for diagnosis, management, and prevention of COPD. GOLD, 2009. http://www.goldcopd.org/Guidelineitem.aspl1=2&l2=1&intId=2003 (accessed 15 Oct 2009)
- 12.Quanjer PH, Tammeling GJ, Cotes J, et al. Lung volumes and forced ventilatory flows. Report Working Party Standardization of Lung Function Tests, European Community for Steel and Coal. Official Statement of the European Respiratory Society. Eur Respir J Suppl. 1993;16:5–40. [PubMed] [Google Scholar]
- 13.Orr A, McVean RJ, Webb AK, Dodd ME. Questionnaire survey of urinary incontinence in women with cystic fibrosis. BMJ. 2001;322(7301):1521. doi: 10.1136/bmj.322.7301.1521. [DOI] [PMC free article] [PubMed] [Google Scholar]
- 14.Schellekens D, Poels P, Pellegrino A, et al. [Spirometry in Dutch general practice. Results from a national survey.] Huisarts Wet. 2008;51(9):434–439. [In Dutch.] [Google Scholar]
- 15.Enright PL, Linn WS, Avol EL, et al. Quality of spirometry test performance in children and adolescents: experience in a large field study. Chest. 2000;118(3):665–671. doi: 10.1378/chest.118.3.665. [DOI] [PubMed] [Google Scholar]
- 16.Enright PL, Johnson LR, Connett JE, et al. Spirometry in the Lung Health Study. 1. Methods and quality control. Am Rev Respir Dis. 1991;143(6):1215–1223. doi: 10.1164/ajrccm/143.6.1215. [DOI] [PubMed] [Google Scholar]
- 17.Den Otter JJ, Knitel M, Akkermans RP, et al. Spirometry in general practice: the performance of practice assistants scored by lung function technicians. Br J Gen Pract. 1997;47(414):41–42. [PMC free article] [PubMed] [Google Scholar]
- 18.Lehmann S, Vollset SE, Nygaard HA, et al. Factors determining performance of bronchodilator reversibility tests in middle-aged and elderly. Respir Med. 2004;98(11):1071–1079. doi: 10.1016/j.rmed.2004.03.019. [DOI] [PubMed] [Google Scholar]
- 19.Bellia V, Pistelli R, Catalano F, et al. Quality control of spirometry in the elderly. The S.A.R.A study. SAlute Respiration nell'Anziano = Respiratory Health in the Elderly. Am J Respir Crit Care Med. 2000;161(4 Part 1):1094–1100. doi: 10.1164/ajrccm.161.4.9810093. [DOI] [PubMed] [Google Scholar]
- 20.Sherman CB, Kern D, Richardson ER, et al. Cognitive function and spirometry performance in the elderly. Am Rev Respir Dis. 1993;148(1):123–126. doi: 10.1164/ajrccm/148.1.123. [DOI] [PubMed] [Google Scholar]
- 21.Poels PJ, Schermer TR, Jacobs A, et al. Variation in spirometry utilisation between trained general practitioners in practices equipped with a spirometer. Scand J Prim Health Care. 2006;24(2):81–87. doi: 10.1080/02813430500504362. [DOI] [PubMed] [Google Scholar]
- 22.Schermer TR, Jacobs JE, Chavannes NH, et al. Validity of spirometric testing in a general practice population of patients with chronic obstructive pulmonary disease (COPD) Thorax. 2003;58(10):861–866. doi: 10.1136/thorax.58.10.861. [DOI] [PMC free article] [PubMed] [Google Scholar]
- 23.White P, Wong W, Fleming T, Gray B. Primary care spirometry: test quality and the feasibility and usefulness of specialist reporting. Br J Gen Pract. 2007;57(542):701–705. [PMC free article] [PubMed] [Google Scholar]
- 24.Pellegrino R, Decramer M, van Schayck CP, et al. Quality control of spirometry: a lesson from the BRONCUS trial. Eur Respir J. 2005;26(6):1104–1109. doi: 10.1183/09031936.05.00026705. [DOI] [PubMed] [Google Scholar]
- 25.Upton MN, Ferrell C, Bidwell C, et al. Improving the quality of spirometry in an epidemiological study: the Renfrew-Paisley (Midspan) family study. Public Health. 2000;114(5):353–360. [PubMed] [Google Scholar]
- 26.Burton MA, Burton DL, Simpson MD, et al. Respiratory function testing: the impact of respiratory scientists on the training and support of primary health care providers. Respirology. 2004;9(2):260–264. doi: 10.1111/j.1440-1843.2004.00563.x. [DOI] [PubMed] [Google Scholar]
- 27.Tuomisto LE, Jarvinen V, Laitinen J, et al. Asthma programme in Finland: the quality of primary care spirometry is good. Prim Care Respir J. 2008;17(4):226–231. doi: 10.3132/pcrj.2008.00053. [DOI] [PMC free article] [PubMed] [Google Scholar]
- 28.Walters JA, Hansen EC, Johns DP, et al. A mixed methods study to compare models of spirometry delivery in primary care for patients at risk of chronic obstructive pulmonary disease. Thorax. 2008;63(5):408–414. doi: 10.1136/thx.2007.082859. [DOI] [PubMed] [Google Scholar]
- 29.Zanconato S, Meneghelli G, Braga R, et al. Office spirometry in primary care pediatrics: a pilot study. Pediatrics. 2005;116(6):e792–e797. doi: 10.1542/peds.2005-0487. [DOI] [PubMed] [Google Scholar]
- 30.Enright PL, Beck KC, Sherrill DL. Repeatability of spirometry in 18,000 adult patients. Am J Respir Crit Care Med. 2004;169(2):235–238. doi: 10.1164/rccm.200204-347OC. [DOI] [PubMed] [Google Scholar]
- 31.Stoller JK, Buist AS, Burrows B, et al. Quality control of spirometry testing in the registry for patients with severe alpha(1)-antitrypsin deficiency. Chest. 1997;111(4):899–909. doi: 10.1378/chest.111.4.899. [DOI] [PubMed] [Google Scholar]
- 32.Koyama H, Nishimura K, et al. A comparison of different methods of spirometric measurement selection. Respir Med. 1998;92(3):498–504. doi: 10.1016/s0954-6111(98)90298-0. [DOI] [PubMed] [Google Scholar]