

Abstract
A relatively unknown protein structure motif forms stable isolated single α-helices, termed ER/K α-helices, in a wide variety of proteins and has been shown to be essential for the function of some molecular motors. The flexibility of the ER/K α-helix determines whether it behaves as a force transducer, rigid spacer, or flexible linker in proteins. In this study, we quantify this flexibility in terms of persistence length, namely the length scale over which it is rigid. We use single-molecule optical trapping and small-angle x-ray scattering, combined with Monte Carlo simulations to demonstrate that the Kelch ER/K α-helix behaves as a wormlike chain with a persistence length of ∼15 nm or ∼28 turns of α-helix. The ER/K α-helix length in proteins varies from 3 to 60 nm, with a median length of ∼5 nm. Knowledge of its persistence length enables us to define its function as a rigid spacer in a translation initiation factor, as a force transducer in the mechanoenzyme myosin VI, and as a flexible spacer in the Kelch-motif-containing protein.
Introduction
The ER/K motif consists of repeating sequences of four negatively charged residues (glutamic acid “E”) followed by four positively charged residues (combination of arginines “R” and lysines “K”). This ER/K motif, present in a wide variety of proteins (1,2), has been shown to form isolated stable α-helices in the proteins caldesmon (3), myosin X (4), myosin VI (5), GPC60 (2) and MEKKK (2). Molecular dynamics simulations revealed a dynamic pattern of side-chain charge-charge interactions, which was used to estimate an LP (persistence length, that is, the length scale over which the structure is rigid) of 30 ± 10 nm for the ER/K α-helix (1). This large predicted LP is consistent with single-molecule optical trapping studies wherein the ER/K α-helix in the tail domain of myosin VI can contribute substantially to the stroke size of myosin VI (1). The actual LP of the ER/K α-helix is important to determine, because its value reflects on whether this structural element acts like a flexible linker or like a force transducer that links protein subdomains. Thus, quantifying the LP of the ER/K α-helix is essential to understanding its function in mechanoenzymes such as the myosins, at the same time informing us of its role in other proteins. Furthermore, the ER/K α-helix spans long distances with relatively few amino acid residues, has known salt and temperature sensitivity (6), and is easily expressed in Escherichia coli (1), making it an important tool in engineering proteins, provided its mechanical properties are clearly established.
Methods
Protein expression and purification
For small-angle x-ray scattering and circular dichroism
ER/K α-helix sequences from the myosin VI tail (Sus scrofa), the Kelch motif family protein (Trichomonas vaginalis G3) (XP_001315745), and translation initiation factor (IF-2, from Homo sapiens) (see Figs. 1 a and 2 a, and Fig. S4 a in the Supporting Material, respectively, for exact sequences), were cloned into pET28a vector with N-terminal 6×His-tag for protein purification and a maltose binding domain (MBP) for enhanced solubility. A tobacco etch virus (TEV) protease site was introduced for cleaving off the MBP and the His-tag, and an N-terminal capping sequence, “EEEE”, was then introduced. To facilitate protein concentration measurement, a C-terminal sequence, “KKKWK”, was introduced. Both vectors were expressed independently in E. coli Rosetta (DE3) cells. Cells were lysed by sonication in the presence of 1–1.5 mg/ml lysozyme. Lysates were clarified by centrifugation at 100,000 × g for 30 min. The supernatant was bound to Ni-NTA resin (Qiagen Inc., Valencia, CA). The eluted proteins were dialyzed in the presence of TEV protease (1–100 w/w) overnight to cleave the [His]6 and MBP portions from the ER/K α-helix domains. ER/K α-helix domains were further purified by running the cleavage reaction over a Ni-NTA column to remove [His]6-containing fragments, and then over a superdex 200 column (GE Healthcare, Piscataway NJ) using either CD buffer (10 mM phosphate, pH 7.4, and 25 mM NaCl) or scattering buffer (20 mM phosphate, pH 7.4, and 50 mM NaCl). Final protein samples were quick-frozen in liquid N2 and stored at −80°C until use. Fresh samples and freeze-thaw samples give identical results on protein SDS-PAGE gels and using circular dichroism, suggesting that a single freeze-thaw cycle does not affect the ER/K α-helix.
Figure 1.
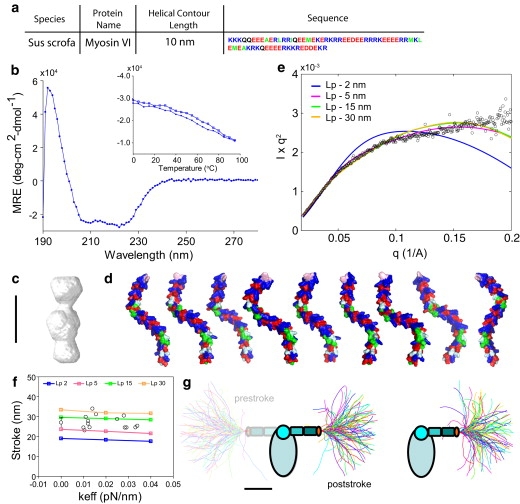
Medial tail ER/K α-helix, Lp ≥ 5 nm. (a) The MT ER/K α-helix sequence derived from porcine myosin VI, with a helical contour length of 10 nm. (b) Circular dichroism spectrum of the MT ER/K α-helix showing characteristic minima at 208 and 222 nm. The inset describes thermal melt (open circles) and refolding (solid points) of the MT ER/K α-helix. (c) SAXS reconstruction of the MT ER/K α-helix. (d) Sample conformations of the MT ER/K α-helix derived from MC simulations of the ER/K α-helix as an ideal WLC with Lp = 15 nm. (e) Comparison of Kratky plot (Iq2 versus q) of MT ER/K α-helix derived from SAXS (open circles) and simulation of ER/K α-helix as a WLC of varying Lp (solid lines). (f) Stroke sizes of myosin VI with MT ER/K α-helix without load in an in vitro motility assay and increasing load (keff = 0.01–0.04 pN/nm) in a dual-beam optical trap assay (open circles). Also shown are the stroke sizes from the MC simulations of the MT ER/K α-helix as a WLC of varying Lp (solid lines). (g) Equilibrium conformations of the MT ER/K α-helix, derived from MC simulations, in the absence of load (prestroke state; left), and under moderate (0.02 pN/nm, poststroke state; middle) and high load (0.04 pN/nm, poststroke state; right). Scale bar (c, d, and g), 5 nm.
Figure 2.
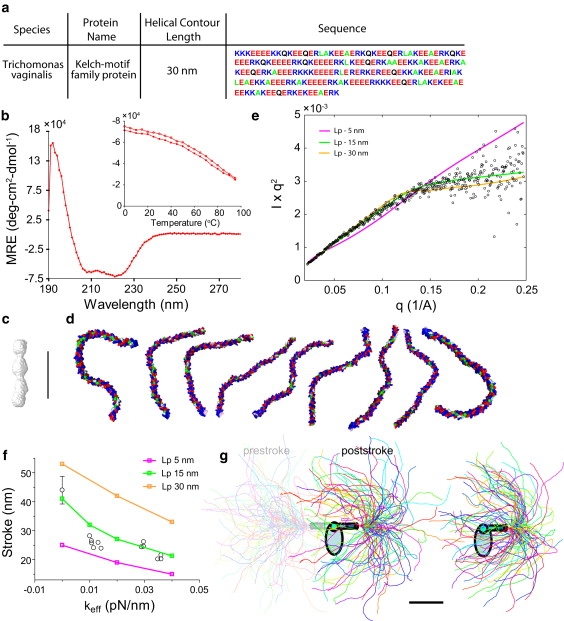
Kelch ER/K α-helix, Lp = 15 nm. (a) The Kelch ER/K α-helix sequence derived from T. vaginalis Kelch-motif-containing protein with a helical-contour length of 30 nm. (b) Circular dichroism spectrum of Kelch ER/K α-helix showing characteristic minima at 208 and 222 nm. The inset describes thermal melt (open circles) and refolding (solid points) of Kelch ER/K α-helix. (c) SAXS reconstruction of the Kelch ER/K α-helix. (d) Sample conformations of the Kelch ER/K α-helix derived from MC simulations of the ER/K α-helix as an ideal WLC with Lp = 15 nm. (e) Comparison of Kratky plot (Iq2 versus q) of Kelch ER/K α-helix derived from SAXS (open circles) and simulation of ER/K α-helix as a WLC of varying Lp. (f) Stroke size of myosin VI with Kelch ER/K α-helix, without load (in vitro motility assay), and with increasing load (0.01–0.04 pN/nm) in a dual-beam optical trap (open circles). Also shown are the stroke sizes from the MC simulations of the Kelch ER/K α-helix as a WLC of varying Lp. (g) Equilibrium conformations of the Kelch ER/K α-helix, derived from MC simulations, in the absence of load (prestroke state; left), and under moderate (0.02 pN/nm, poststroke state; middle) and high load (0.04 pN/nm, poststroke state; right). Scale bar (c, d, and g), 10 nm.
For in vitro motility and optical trapping assays
Porcine myosin VI cDNA [1-Gln915], then the ER/K α-helix sequence shown in Figs. 1 a or 2 a, then (GSG)4 and eYFP, with an N-terminal FLAG tag (DYKDDDDK), were cloned into pBiex-1 (Novagen, Madison, WI) and expressed by transfection of plasmid DNA into Sf-9 insect cells, after which the proteins were purified as previously described (7). A control construct for compliance correction in the optical trap was identical, except that it had no ER/K α-helical domain.
Measurement of protein concentration
Protein concentrations for small-angle x-ray scattering (SAXS) and circular dichroism (CD) were estimated using absorbance at 280 nm. Protein samples were independently subjected to quantitative amino acid analysis at the Molecular Structure Facility (University of California, Davis). The ER/K α-helices are rich in glutamic acid (E), arginine (R), and lysine (K), in addition to varying concentrations of alanine (A). The relative concentrations of the different amino acids quantified using this approach are very similar to the relative frequencies with which they occur in the corresponding proteins. The protein concentration was estimated based on the average concentrations obtained from E, R, K, and A. Table S1 lists the protein concentrations obtained using these approaches.
Circular dichroism
CD spectra were acquired using an Aviv 62DS instrument (Aviv Biomedical, Lakewood, NJ) with a 1-mm path length cell in CD buffer. Spectra were taken at 0°C, with data collected every 1 nm with a 10-s averaging time, and are the average of two repeat scans. Concentrations ranged from 1 to 17 μM. Melt data were collected every 5°C, with a 30-s averaging time and a 2-min equilibration. In all cases, the reverse melt showed at least 90% reversibility. Mean protein concentration from amino acid analysis and 280 nm absorbance was used to estimate the mean residue ellipticity (MRE). The MRE for the medial tail (MT) ER/K α-helix is close to that previously reported by us for a MT ER/K α-helix with modified end sequences (1). A surprising finding was that the MRE for the Kelch ER/K α-helix is <−44,000 deg cm2 dmol−1, which is considered the theoretical minimum in estimating the helix content of peptides (9,10). The reason for this large negative MRE for the Kelch ER/K α-helix is unclear; we suspect that the large value results from the helical arrangement of side-chain interactions (1) that also contribute to the CD signal.
Small-angle x-ray scattering
Measurements
SAXS measurements were carried out at beam line 12-ID-C of the Advanced Photon Source (Argonne, IL), employing a sample-detector distance of 2 m and CCD detector read out (MAR USA, Evanston, IL). The data were collected using a custom-made sample cell (11) at an x-ray energy of 12 keV. Details of the beam line are as described previously (11–13).
Samples were clarified by centrifugation at 10,000 × g for 10 min before measurement and five 0.5-s exposures were obtained. Data were image-corrected, normalized by incident flux, and circularly averaged. The five profiles for each condition were averaged to improve signal quality. Buffer profiles were collected using identical procedures and subtracted for background correction. The data showed no signs of radiation damage, based on comparison of consecutive scattering profiles from the same sample (data not shown).
Data analysis
Scattering intensities as a function of the momentum transfer were obtained at different protein concentrations. The SAXS profiles for both of the ER/K α-helices were superimposable after scaling by forward scattering intensity, suggesting that there are no detectable aggregation or interparticle interference effects (Fig. S1, a and b). Radii of gyration (Rg) were determined from Guinier analysis of the low-angle scattering data (14) (Table S1). The Rg values obtained from Guinier analysis agree within experimental error with the values from the real-space distribution function P(r) computed using the regularized transform method implemented in the program GNOM (15).
The program DAMMIN (16) was used to reconstruct 3-D bead models that fit the scattering data (Fig. S1, c and d). DAMMIN employs a simulated annealing procedure and a compactness criterion. Ten independent DAMMIN runs were performed for each scattering profile using default parameters, the “slow” mode for DAMMIN, no symmetry assumptions (P1 symmetry), and the full recorded scattering profiles. The models resulting from independent runs were superimposed and compared using the program SUPCOMB (17), based on the normalized spatial discrepancy (NSD) criterion. Models with NSD values <1 are considered similar. For all data presented in the main text, the 10 independent repeat runs yielded models with pairwise NSD values <1, indicating that the algorithms converged reproducibly to similar structures. The 10 independent structures for each scattering profile were subsequently averaged, and “filtered” consensus models were computed using the program DAMAVER with default settings (18). For visualization, the reconstructed bead models were converted to electron density maps with the program Situs (19) (Figs. 1 c and 2 c).
In vitro motility assays
In vitro motility (actin gliding) assays were performed as described in Bryant et al. (1). Only differences from previous assay conditions are noted here. F-actin was labeled only with TMR-phalloidin. Motility speeds were obtained by performing a dilution series of myosin VI constructs with the two different ER/K α-helices. Low surface concentrations of the motor result in Brownian motion of the ends of the F-actin filament, which is reflected in apparently slow speeds of F-actin movement. Very high surface concentrations of the motor result in significant shredding of the F-actin filaments and interference between motor heads, leading to slow speeds of F-actin movement. Intermediate concentrations provide directed movement of the entire F-actin filament, without interference between heads, resulting in larger speeds of F-actin filaments. The maximum speed in the motility assay is used to estimate the zero-load stroke size of the myosin VI constructs, based on a mean dwell time of 0.2 s (saturating ATP concentration of 2 mM used in this assay) for each myosin VI head on the F-actin filament. The standard deviation of the mean for stroke size at zero load is estimated from the variation in speed across F-actin filaments in the assay (n > 50).
Optical trapping
Data acquisition
Optical trapping was performed using the custom dual-beam optical trap (1,20,21). All trapping was done without feedback. Dumbbells of F-actin and beads were formed using a streptavidin-biotin link between streptavidin-coated beads and 100% biotinylated F-actin. Phalloidin was added to a final concentration of 10 μM to stabilize the actin filaments. The actin dumbbell was stretched taut, with the stiffness of each trap varying from 0.005 to 0.02 pN/nm. Individual myosin motors were attached to nitrocellulose coverslips with monoclonal anti-GFP antibody (MAB3580, Chemicon, Temecula, CA). Motor dilutions were chosen such that <10% of tested platforms showed myosin VI binding to actin, to minimize binding of more than one myosin head to the F-actin filament. Binding events were determined from data traces, by eye, using both drop-in bead position variance and bead-to-bead correlation.
Compliance correction
Fig. S2 shows the compliant elements in a dual-beam optical trap assay represented as isotropic springs. Stiffness of the optical traps (kt1 and kt2) are determined from Brownian motion of beads, before a dumbbell is formed between trapped beads (22). The series combination of stiffness of the F-actin to bead connections (kc1 and kc2) is determined, after the dumbbell is stretched taut, from the Brownian motion of the trapped beads and the known trap stiffnesses. The serial combination of myosin VI stiffness, khead (including myosin head, two light-chain binding regions, and the proximal tail), and the (GSG)4 linker, klinker, is determined using a myosin VI construct that lacks an ER/K α-helix but is identical in all other aspects. Compliance correction, to correct for the displacement of the F-actin-to-bead connections, the (GSG)4 linker, and the flexibility within the myosin head, two light chains, and the proximal tail, is performed by combining the springs, as depicted in the inset of Fig. S2.
Monte Carlo simulations
No external load
The ER/K α-helix is modeled with the Kratky-Porod model (23), better known as the wormlike chain model (WLC), though the latter name may cause confusion: No chain occurs in this polymer model, though it can be defined mathematically as the limit of a series of chain models with increasingly shorter links. The WLC is an unstretchable, but flexible, fiber of infinitesimal diameter. It is fully characterized by its length and its storage modulus (EI), or, at a given temperature, its persistence length,
| (1) |
where kB is Boltzmann's constant and T is the absolute temperature, in our experiment 295 K. To computer-simulate this flexible fiber, we approximate it by a chain of N + 1 segments numbered 0 to N, each of length δs, with bending energy at each of the N joints of this chain. Here Δθi is the angle at which segments i and i − 1 join each other at joint i − 1. Thus, the total bending energy of the chain is
| (2) |
The orientation of the zeroth segment is kept fixed during the simulation as we sweep through the length of the beam and randomly perturb the orientation of successive beam segments in 3D space. The Metropolis algorithm is used to generate an ensemble of consecutive chain configurations, which, by virtue of this algorithm, are Boltzmann-distributed.
We choose a Cartesian coordinate system with the z axis parallel to the zeroth, fixed chain segment. The direction of this segment is the direction of the tangent vector to the WLC at its end, the end clamped down with fixed direction of its tangent vector. Let θ(s) denote the polar angle (the angle with the z axis) of the WLS's tangent vector at a distance s from its clamped end, with s measuring distance along the contour of the WLC. Then, the correlation between the tangent vector at the clamped end and the tangent vector at s is 〈cos θ(s)〉. In the absence of external load, this correlation function is known analytically and is
| (3) |
In the presence of load, there is no similar analytical result. For this reason, and also to model thermal fluctuations of the WLC under load, we computer-simulate it in the discretized version of N + 1 segments. This gives rise to a discretization error, which we can determine in the case of no load, since an exact result exists that is similar to, but different from, Eq. 3. It turns out that the persistence length of the discretized WLC is smaller compared to the correct WLC at the same temperature and bending energy per unit length.
| (4) |
This discretization error is ∼5% for 15–20 segments per persistence length. Selecting a larger number of segments per persistence length decreases this error, but reduces the rate at which conformation space is sampled to an extent that sufficient sampling requires too much computer time. To ensure that sufficient sampling statistics has been achieved, two separate criteria are used. First, the ensemble tangent-tangent correlation from the simulation is compared with its discretized theoretical value given by Eq. 4 (Fig. S3, a and b). Second, the “blocking” method described in Flyvbjerg et al. (24) is used both to estimate the statistical error on the simulated tangent-tangent correlation and to assess convergence of the simulation (Fig. S3, c and d). For converged simulations, the variance in tangent-tangent correlation first increases with number of block transformations and then gradually converges to a distinct plateau (Fig. S3, c and d) (24).
Finite external load
In neither the SAXS experiment nor the prestroke state, when the myosin VI head binds to the F-actin filament, is the ER/K α-helix subject to an external load. Upon binding to the F-actin filament, the myosin VI molecule strokes against a force equal to that exerted by a linear Hookean spring, with effective spring constant (keff) (Fig. S2, inset). The energy stored in this Hookean spring is given by
| (5) |
where “Stroke” is the sum of the conventional myosin VI lever-arm stroke (∼15 nm without ER/K α-helix) and the stroke contribution from the ER/K α-helix. The stroke contribution from the ER/K α-helix, in turn, is the sum of its prestroke length, given by , and the poststroke length, which depends on the projected end-to-end distance in the direction of the stroke (Fig. S3 e). As the ER/K α-helix bends backward due to the force from the optical trap, the optical trap force decreases, but the restoring force exerted by the bent helix increases, and vice versa. Correspondingly, as the ER/K α-helix bends backward toward the prestroke state, the energy stored in the trap will decrease, but that stored in the helix will increase, and vice versa. The conformations sampled by the ER/K α-helix therefore will depend on the bending modulus (or persistence length) of the helix relative to the strength of the trap (keff). The total energy in the system is the sum of the energy stored in the ER/K α-helix (Eq. 2) and that stored in the optical trap (Eq. 5). To account for the effect of the optical trap, the Metropolis criterion is applied to this total energy to equilibrium-sample conformations in the presence of trapping force. Fig. S3, f and g, shows the convergence of the simulations, as assessed by the blocking method, for the MT ER/K α-helix and the Kelch ER/K α-helix in the presence of an external load (keff = 0.04 pN/nm).
Forward SAXS scattering profile from MC simulations
MC simulations, described earlier, model the ER/K α-helical backbone as a discrete wormlike chain. We use the equilibrium conformations derived from the MC simulations to obtain a series of high-resolution structures that together represent the ensemble of conformations adopted by the ER/K α-helix in our SAXS measurement. For this, we use SYBYL (Tripos, St. Louis, MO) to build an ideal protein α-helix, including all atoms, based on the MT and Kelch sequences (see Circular dichroism, above). A custom MATLAB program (The MathWorks, Natick, MA) is used to rotate the Cα-C bonds at the end of each turn of the α-helix (alternately three and four residues apart) so that the shape of the α-helical backbone conforms to that derived from the MC simulations. One thousand conformations, evenly spaced in MC time, are thus used to derive representative high-resolution structures of the ER/K α-helix in solution. CRYSOL (24) was used to obtain SAXS scattering profiles for each of the 1000 conformations, which were then averaged to obtain an ensemble scattering profile for a given persistence length of the WLC model (Figs. 1 e and 2 e).
Statistical analysis
The reduced χ2 statistic was used to assess the goodness of fit in comparing the results of MC simulations to SAXS measurements or optical trapping data. The reduced χ2 statistic for different LP values used in the MC simulations is shown in Table S2 and is defined as
| (6) |
where N is the number of data points; n is the number of degrees of freedom in the fit (n = 1, as LP is the only degree of freedom in the simulation); y refers to the variable being measured—Iq2 in SAXS measurements and Stroke size in optical trap measurements; and σ represents the error/noise in the measurement. To estimate σ, we assume that SAXS measurements (Figs. 1 e and 2 e) and optical trap measurements (Figs. 1 f and 2 f), in the absence of measurement error or noise, can be represented by a smooth and continuous curve. We use a polynomial curve fit to estimate the underlying smooth continuous curve. The order of the polynomial is selected to provide a good fit (r2 > 0.95) while not overfitting the noise (assessed visually). A polynomial of fourth order was used for SAXS measurements and one of first order for all optical trap measurements. The error/noise in the measurement, σ, is then the variance between the underlying smooth continuous curve and the measurements. This σ is used to determine the reduced χ2 statistic (χ2/ν) for the different conditions as shown in Table S2.
Results and Discussion
Fig. 1 shows the measurement of the LP of the ER/K α-helix in the tail domain of myosin VI (sequence shown in Fig. 1 a), termed the medial tail, using single-molecule analysis. The helical contour length, that is, the length along the α-helical backbone (LH), for the MT ER/K α-helix is 10 nm. CD spectra confirmed the helicity of the MT (Fig. 1 b). SAXS measurements were used to reconstruct an ensemble envelope shape of the MT ER/K α-helix (Fig. 1 c), which revealed an elongated structure consistent with previous reports (2,20).
We generated a simplified model of the ER/K α-helix as an ideal WLC (see Methods) and used MC simulations with a single parameter (LP) to equilibrium-sample conformations of the helical backbone (Fig. 1 d, LP = 15 nm). Theoretical SAXS scattering profiles were calculated from the individual MC-derived conformations (19) (see Methods). These profiles were then averaged over the ensemble generated for each LP to yield an ensemble SAXS scattering profile, which was compared with experimental results (Fig. 1 e). This quantitative comparison showed that whereas a persistence length (Lp) of 2 nm does not match the SAXS experimental profile, Lp ≥ 5 nm matches reasonably well with experiment (Fig. 1 e) (for a description of the reduced χ2 statistic, see Table S2 and Methods, Statistical analysis).
Single-molecule optical trapping was used to directly measure the contribution of the ER/K α-helix to the stroke of a single myosin VI molecule in an optical trap. Myosin VI swings its lever arm through 180°, resulting in a stroke size of 15 nm (not including the ER/K α-helix) (1,8). The presence of the ER/K α-helix increases the stroke size, with the magnitude of this increase dependent on LP, LH, and the stiffness of the optical trap (see Methods). Hence, we used the myosin VI lever-arm stroke to subject the ER/K α-helix to a mechanical force (see Fig. S3 e) and varied the force by changing the trap stiffness (Fig. 1 f). We found that the effective strength of the trap (keff) (see Fig. S2) did not alter the stroke size of myosin VI and that the MT ER/K α-helix (with LH = 10 nm) contributes an additional ∼15 nm to the stroke size (Fig. 1 f).
We used MC simulations of the MT ER/K α-helix, modeled as a WLC and subjected to the mechanical force from the optical trap (Fig. S3 e), to quantify the effect of LP on myosin VI stroke size under load. Fig. 1 g shows sample conformations from the MC simulations in the absence of load (prestroke, left) and in the presence of moderate (poststroke, middle) and high (poststroke, right) loads. Our simulations assume that the ER/K α-helix emerges at a shallow angle (<30° relative to the conventional myosin VI lever arm) from the proximal tail of myosin VI. A shallow angle is consistent with the finding that the ER/K α-helix contributes most of its length to the myosin VI stroke (Fig. 1 f and Fig. S4 b). We find that a WLC with an LP between 5 and 30 nm matches well with the experimental measurement (Fig. 1 f), with 15 nm giving the best fit (reduced χ2 statistic; Table S2 and Methods). Taken together, our experiments suggest that the MT is a relatively rigid structure in which LP ≅ LH.
To quantify the LP of the ER/K α-helix more accurately, it was necessary that LH > LP, whereby the conformational heterogeneity of the ER/K α-helix affects its ensemble SAXS envelope and also influences its contribution to the myosin VI stroke size under load. We therefore expressed and purified the Kelch ER/K α-helix with LH = 30 nm (Fig. 2 a). CD measurements confirmed the helicity of the Kelch ER/K motif (Fig. 2 b). SAXS measurements yielded an ensemble shape that is elongated, consistent with the MT ER/K α-helix (Fig. 2 c). MC simulations of the Kelch ER/K α-helix modeled as an ideal WLC provided equilibrium conformations for a given LP (Fig. 2 d, LP = 15 nm). The MC conformations were used to derive individual scattering profiles, which were averaged to obtain an ensemble scattering profile as a function of LP (Fig. 2 e). For the Kelch ER/K α-helix we found that an LP of 15 nm reproduced the SAXS scattering profile, whereas an LP of 5 or 30 nm did not provide a good fit (reduced χ2 statistic; Table S2 and Methods).
Single-molecule optical trapping of myosin VI, with the Kelch ER/K α-helix replacing the MT ER/K α-helix, was used to study the effect of load on the Kelch ER/K α-helix (Fig. 2 f). We found that increasing the load on the ER/K α-helix by varying the effective trap strength (keff; Fig. S2) progressively decreased the stroke size, consistent with bending of the Kelch ER/K α-helix under load (Fig. 2 f).
We used an MC simulation of the Kelch ER/K α-helix, modeled as a WLC subject to the mechanical force from the optical trap (Fig. S3 e) to quantify the effect of LP on myosin VI stroke under load. Fig. 2 g shows sample conformations from the MC simulations in the absence of load (prestroke; left) and in the presence of moderate (poststroke; middle) and high (poststroke; right) loads. We found that a WLC with LP = 15 nm matches well with the experimental measurement (Fig. 2 f), whereas LP = 5 nm and 30 nm systematically underestimated and overestimated, respectively, the experimental stroke contribution of the Kelch ER/K α-helix (reduced χ2 statistic; Table S2 and Methods). These results show that increasing the length of the ER/K α-helix helped resolve the LP of the ER/K α-helix to∼15 nm (∼28 complete turns of the α-helix).
In summary, we use a combination of optical trapping and SAXS measurements combined with a simple MC simulation to calculate the persistence length of the ER/K α-helix. The MC simulation involves only a single parameter, namely, the persistence length. This single-parameter model reproduces both optical trapping and SAXS measurements for three different ER/K α-helices of different length. The persistence length of 15 nm is clearly resolved for the Kelch ER/K α-helix with a contour length (LH) of 30 nm. Combining experiments with simulations enables us to quantitatively test the hypothesis that the ER/K α-helix behaves as a smooth WLC with an Lp of ∼15 nm. Measuring the persistence length of the ER/K α-helix is of broad interest to understanding the mechanical behavior of protein structures in general.
The median length of the ER/K α-helix, revealed by a search of the database of known and hypothetical proteins, is ∼30 amino acids with an LH of ∼5 nm (1). This study shows that an ER/K α-helix with LH = 5 nm and LP = 15 nm behaves as a relatively rigid spacer between protein domains. This is consistent with the ER/K α-helix from protein IF-2, with LH = 5 nm, contributing almost all of its length to the lever-arm stroke of myosin VI, regardless of the load applied in the optical trap (Fig. S4). The MT ER/K α-helix with LH = 10 nm acts as a significant extension to the lever arm of myosin VI, and its flexibility influences force transduction between the myosin head and the cargo binding domain (9). In addition to extending the lever arm, the stroke contribution of myosin VI with the MT ER/K α-helix is not affected by the force applied in the optical trap (Fig. 1 f), whereas the Kelch ER/K α-helix is significantly force-dependent (Fig. 1 f). This load-insenstive feature of the MT ER/K α-helix suggests that backward load on the myosin VI molecule resulting from intramolecular and intermolecular interactions does not compromise the function of this molecular motor. ER/K α-helices with LH > LP, such as the Kelch ER/K α-helix used in this study, behave as a flexible spacer between the protein domains they span. Taken together, knowledge of the LP for the ER/K α-helix derived from this study enables us to predict its function and paves the way for its use as a well characterized structural element in the design of synthetic proteins.
Supporting Material
Four figures and two tables are available at http://www.biophysj.org/biophysj/supplemental/S0006-3495(09)01453-2.
Supporting Material
Acknowledgments
We thank Patricia Johnson (University of California, Los Angeles) for the gift of T. vaginalis cDNA.
Use of the Advanced Photon Source was supported by the U.S. Department of Energy, Office of Science, Office of Basic Energy Sciences (contract No. DE-AC02-06CH11357). S.S. is supported by an American Cancer Society postdoctoral fellowship, M.A. by a Stanford University graduate fellowship, and S.D. and J.A.S. by grants PO1 GM066275 and GM33289, both from the National Institutes of Health.
References
- 1.Sivaramakrishnan S., Spink B.J., Sim A.Y., Doniach S., Spudich J.A. Dynamic charge interactions create surprising rigidity in the ER/K α-helical protein motif. Proc. Natl. Acad. Sci. USA. 2008;105:13356–13361. doi: 10.1073/pnas.0806256105. [DOI] [PMC free article] [PubMed] [Google Scholar]
- 2.Suveges D., Gaspari Z., Toth G., Nyitray L. Charged single α-helix: a versatile protein structural motif. Proteins. 2009;74:905–916. doi: 10.1002/prot.22183. [DOI] [PubMed] [Google Scholar]
- 3.Wang C.L., Chalovich J.M., Graceffa P., Lu R.C., Mabuchi K. A long helix from the central region of smooth muscle caldesmon. J. Biol. Chem. 1991;266:13958–13963. [PMC free article] [PubMed] [Google Scholar]
- 4.Knight P.J., Thirumurugan K., Xu Y., Wang F., Kalverda A.P. The predicted coiled-coil domain of myosin 10 forms a novel elongated domain that lengthens the head. J. Biol. Chem. 2005;280:34702–34708. doi: 10.1074/jbc.M504887200. [DOI] [PubMed] [Google Scholar]
- 5.Spink B.J., Sivaramakrishnan S., Lipfert J., Doniach S., Spudich J.A. Long single α-helical tail domains bridge the gap between structure and function of myosin VI. Nat. Struct. Mol. Biol. 2008;15:591–597. doi: 10.1038/nsmb.1429. [DOI] [PMC free article] [PubMed] [Google Scholar]
- 6.Lyu P.C., Gans P.J., Kallenbach N.R. Energetic contribution of solvent-exposed ion pairs to α-helix structure. J. Mol. Biol. 1992;223:343–350. doi: 10.1016/0022-2836(92)90735-3. [DOI] [PubMed] [Google Scholar]
- 7.Svergun D., Barberato C., Koch M. CRYSOL: a program to evaluate x-ray solution scattering of biological macromolecules from atomic coordinates. J. Appl. Crystallogr. 1995;28:768–773. [Google Scholar]
- 8.Bryant Z., Altman D., Spudich J.A. The power stroke of myosin VI and the basis of reverse directionality. Proc. Natl. Acad. Sci. USA. 2007;104:772–777. doi: 10.1073/pnas.0610144104. [DOI] [PMC free article] [PubMed] [Google Scholar]
- 9.Altman D., Sweeney H.L., Spudich J.A. The mechanism of myosin VI translocation and its load-induced anchoring. Cell. 2004;116:737–749. doi: 10.1016/s0092-8674(04)00211-9. [DOI] [PubMed] [Google Scholar]
- 10.Luo P., Baldwin R.L. Mechanism of helix induction by trifluoroethanol: a framework for extrapolating the helix-forming properties of peptides from trifluoroethanol/water mixtures back to water. Biochemistry. 1997;36:8413–8421. doi: 10.1021/bi9707133. [DOI] [PubMed] [Google Scholar]
- 11.Rohl C.A., Baldwin R.L. Comparison of NH exchange and circular dichroism as techniques for measuring the parameters of the helix-coil transition in peptides. Biochemistry. 1997;36:8435–8442. doi: 10.1021/bi9706677. [DOI] [PubMed] [Google Scholar]
- 12.Lipfert J., Millett I.S., Seifert S., Doniach S. A sample holder for small-angle x-ray scattering static and flow cell measurements. Rev. Sci. Instrum. 2006;77:461081–461084. [Google Scholar]
- 13.Beno M.A., Jennings G., Engbretson M., Knapp G.S., Kurtz C. Basic Energy Sciences Synchrotron Radiation Center undulator sector at the Advanced Photon Source. Nucl. Instrum. Methods Phys. Res. A. 2001:467–468. 690–693. [Google Scholar]
- 14.Seifert S., Winans R.E., Tiede D.M., Thiyagarajan P. Design and performance of a ASAXS instrument at the Advanced Photon Source. J. Appl. Cryst. 2000;33:782–784. [Google Scholar]
- 15.Guinier A. The diffraction of x-rays at small angles. Ann. Phys. (Paris) 1939;12:161–237. [Google Scholar]
- 16.Svergun D. Determination of the regularization parameter in indirect-transform methods using perceptual criteria. J. Appl. Cryst. 1992;25:495–503. [Google Scholar]
- 17.Svergun D.I. Restoring low resolution structure of biological macromolecules from solution scattering using simulated annealing. Biophys. J. 1999;76:2879–2886. doi: 10.1016/S0006-3495(99)77443-6. [DOI] [PMC free article] [PubMed] [Google Scholar]
- 18.Kozin M.B., Svergun D.I. Automated matching of high- and low-resolution structural models. J. Appl. Cryst. 2001;34:33–41. [Google Scholar]
- 19.Volkov V.V., Svergun D.I. Uniqueness of ab initio shape determination in small-angle scattering. J. Appl. Cryst. 2003;36:860–864. doi: 10.1107/S0021889809000338. [DOI] [PMC free article] [PubMed] [Google Scholar]
- 20.Wriggers W., Chacon P. Using Situs for the registration of protein structures with low-resolution bead models from x-ray solution scattering. J. Appl. Cryst. 2001;34:773–776. [Google Scholar]
- 21.Rice S.E., Purcell T.J., Spudich J.A. Building and using optical traps to study properties of molecular motors. Methods Enzymol. 2003;361:112–133. doi: 10.1016/s0076-6879(03)61008-6. [DOI] [PubMed] [Google Scholar]
- 22.Mehta A.D., Finer J.T., Spudich J.A. Detection of single-molecule interactions using correlated thermal diffusion. Proc. Natl. Acad. Sci. USA. 1997;94:7927–7931. doi: 10.1073/pnas.94.15.7927. [DOI] [PMC free article] [PubMed] [Google Scholar]
- 23.Kratky O., Porod G. X-ray analysis of molecular chains in solution. Rec. Trav. Pays-Bas. 1949;68:1106–1123. [Google Scholar]
- 24.Flyvbjerg H., Petersen H. Error estimate on averages of correlated data. J. Chem. Phys. 1989;91:461–466. [Google Scholar]
Associated Data
This section collects any data citations, data availability statements, or supplementary materials included in this article.