

Abstract
Heterochromatin protein 1 (HP1) is a central factor in establishing and maintaining the repressive heterochromatin state. To elucidate its mobility and interactions, we conducted a comprehensive analysis on different time and length scales by fluorescence fluctuation microscopy in mouse cell lines. The local mobility of HP1α and HP1β was investigated in densely packed pericentric heterochromatin foci and compared with other bona fide euchromatin regions of the nucleus by fluorescence bleaching and correlation methods. A quantitative description of HP1α/β in terms of its concentration, diffusion coefficient, kinetic binding, and dissociation rate constants was derived. Three distinct classes of chromatin-binding sites with average residence times tres ≤ 0.2 s (class I, dominant in euchromatin), 7 s (class II, dominant in heterochromatin), and ∼2 min (class III, only in heterochromatin) were identified. HP1 was present at low micromolar concentrations at heterochromatin foci, and required histone H3 lysine 9 methylases Suv39h1/2 for two- to fourfold enrichment at these sites. These findings impose a number of constraints for the mechanism by which HP1 is able to maintain a heterochromatin state.
Introduction
The organization of the DNA genome in the nucleus by histones and other chromosomal proteins is controlled by epigenetic regulatory networks that modulate the accessibility of the DNA for transcription, DNA repair, and replication machineries. At the resolution of the light microscope, two different compaction states of chromatin can be distinguished: the denser and transcriptionally repressed heterochromatin, and the more open and biologically active euchromatin (1,2). These functional states are established via the highly dynamic recruitment of histones and other chromosomal proteins, as well as covalent modifications of histones and DNA. Heterochromatin is characterized by its high content of repetitive DNA elements and repressive epigenetic marks such as DNA methylation and di- or trimethylation of the histone H3 lysine residues 9 and 27 (H3K9me2/3 and H3K27me2/3) and the histone H4 lysine residue 20 (H4K20me2/3), as well as hypoacetylation of histones. Large regions of heterochromatin are located at and around the centromeres and at the telomeres. In mouse cells, clusters of pericentric heterochromatin can be easily identified on microscopic images due to their intense staining by 4′,6-diaminidino-2-phenylindole (DAPI). The corresponding loci are also referred to as chromocenters and comprise A/T-rich repetitive sequences around the centromere (3).
Heterochromatin formation is mediated by multiple pathways that trigger de novo DNA methylation, modification of histone tails, and alteration of nucleosome positions or integrity. A central factor in establishing and maintaining the heterochromatic state is heterochromatin protein 1 (HP1). HP1 is evolutionary highly conserved, and homologs have been found from yeast (Schizosaccharomyces pombe) to humans (4–6). The ability of HP1 to induce large-scale chromatin compaction has been demonstrated in a mammalian cell line (7). Three HP1 isoforms in mouse and humans are known: HP1α, HP1β, and HP1γ. These isoforms are similar in terms of amino acid sequence and structural organization, but differ in their nuclear localization. The two dominant species, HP1α and HP1β, are primarily (but not exclusively) associated with heterochromatin and colocalize in mouse cells, whereas HP1γ localizes to a larger extent to euchromatin as well (5,8,9). In euchromatin, the HP1-associated silencing occurs via the formation of small repressive chromatin domains, partly independently of the histone methyltransferase Suv39h1 but in association with the JmjC domain-containing histone H3K36 demethylase dKDM4A (4,10,11). HP1 contains an N-terminal chromo-domain (CD) and a C-terminal chromoshadow-domain (CSD) connected by a flexible linker region. The CD interacts specifically with H3 histone tails that carry the K9me2/3 modification (12,13). Numerous interaction partners of HP1 have been reported in the literature, including Suv39h1, the linker histone variant H1.4, the DNA methyltransferases Dnmt1 and Dnmt3, and noncoding RNAs (2,6). In addition, HP1 is also able to form homo- or heteromultimers of its different isoforms (14,15). In a current model, heterochromatin assembly is nucleated by the targeting of HP1 via its CD to H3K9me2/3, and at the same time it interacts with Suv39h1/2 via the CSD. This feedback loop of HP1 binding-mediated H3K9 methylation promotes HP1 binding to adjacent nucleosomes and would provide a mechanism for the maintenance of heterochromatin as well as heterochromatin spreading (1,2,16).
Noninvasive methods based on optical high-resolution microscopy are ideally suited to probe the mobility and interactions of nuclear proteins in living cells. A frequently used method is fluorescence recovery after photobleaching (FRAP), in which the fluorescence in a part of the cell is bleached and the redistribution back to the equilibrium state is recorded. The resulting recovery data contain information about the diffusion and binding processes of the labeled proteins. The initial FRAP studies of HP1 revealed that the protein is highly mobile in the nucleus and in frequent turnover between its chromatin-bound state and the freely mobile state in the nucleoplasm (17,18). In those experiments, halftimes of the FRAP recovery curves of 0.6–10 s for the freely mobile state and 2.5–50 s for the chromatin-bound state were determined. Further studies conducted with different cell types confirmed the high mobility of HP1 in euchromatin as well as in heterochromatin (8,19,20). Subsequently, more detailed FRAP analyses and kinetic modeling studies of HP1 concluded that the nuclear HP1 pool can be separated into at least three fractions: a highly mobile fraction; a less mobile, transiently binding fraction; and a smaller immobilized fraction (15,21). From FRAP studies of yeast, a model was derived that had differences in the kinetic on and off rates of HP1 binding to the unmethylated and the methylated nucleosome state (21).
Although these studies provided a wealth of information, the classical FRAP approach is limited in its spatial and temporal resolution, and information on local mobility on the subsecond timescale is not easily accessible. Here, we investigated the diffusion and interaction behavior of HP1α and HP1β in living cells with a complementary set of fluorescence fluctuation microscopy approaches that included FRAP, continuous fluorescence photobleaching (CP), fluorescence loss in photobleaching (FLIP), and fluorescence correlation spectroscopy (FCS). Together, these techniques provide a comprehensive description of the spatially resolved mobility of the two proteins (22). From a quantitative analysis of the data according to a reaction-diffusion model, we derived a model for the interaction of HP1α/β with chromatin that dissects differences in its binding to heterochromatin and euchromatin. The increased binding affinity to heterochromatin was dependent on the presence of the Suv39h1/2 methylase. This demonstrates the existence of a direct linkage between an epigenetic modification and the interaction affinity of the corresponding readout protein in living mammalian cells.
Materials and Methods
Experiments were conducted with green fluorescent protein (GFP) constructs of mouse HP1α and HP1β, and a red fluorescent Suv39h1 fusion protein (TagRFP-Suv39h1) in the murine NIH 3T3 fibroblast cell line or in immortalized mouse embryonic fibroblasts (iMEF). For HP1α the cell line 3T3-HP1α was used, in which one allele of the HP1α gene was replaced by a GFP-HP1α-coding sequence driven by a mouse PGK promoter. HP1β was introduced via transient transfection. The contribution of the Suv39h1/2 methylases on HP1β mobility was studied in an iMEF double null mutant (iMEF-dn) cell line that had the Suv39h1 and Suv39h2 genes disrupted, and lacked H3K9 di- and trimethylation in pericentric heterochromatin (23).
Profile FRAP
For profile FRAP (pFRAP), the fluorescence intensity profile was determined for each picture of the time series perpendicular to a strip (3 μm wide) that was bleached through the nucleus to follow the broadening of the bleach profile due to diffusion (24). The data were analyzed with a confined diffusion model.
Intensity-based FRAP experiments
The time evolution of the intensity integrated over the bleach spot was recorded (24), and the resulting data sets were analyzed according to the theoretical framework developed by McNally and co-workers (25). The data were fitted to a diffusion model, a binding model, or a reaction-diffusion model that incorporates both diffusion and binding processes.
CP and FLIP
In the CP experiments, the decay of the fluorescence signal to the dynamic equilibrium of photobleaching, diffusion, and chromatin dissociation/association of GFP-HP1α was used to derive the kinetic dissociation rate (24,26). In the FLIP experiments, the fluorescence loss within heterochromatin and euchromatin regions was monitored between repetitive bleach pulses at distant regions from the bleach spot within the same nucleus (27).
FCS
The FCS experiments were conducted as described previously (24). The data were fitted to a one- or two-component anomalous diffusion model, which is characterized by a nonlinear time dependency of the mean-squared particle displacement given by the anomaly parameter α. Alternatively, a two-species model was applied in which the first component followed anomalous diffusion and the second component was assumed to be bound to a slowly and confinedly moving lattice.
A detailed description of all methods used and the data analyses of the FRAP, CP, FLIP, and FCS experiments is given in the Supporting Material.
Results and Discussion
HP1 is a central factor in establishing and maintaining a biologically inactive heterochromatin state (1,2). To describe the spatially resolved mobility and binding interactions of HP1α and HP1β, we applied a set of complementary fluorescence fluctuation microscopy methods (i.e., FRAP, CP, FLIP, and FCS). In the first pioneering FRAP studies of HP1, a fast transition between the free and chromatin-bound states of the protein was observed (17,18). Subsequent studies identified fractions of differently mobile molecules and calculated kinetic rates (8,15,19–21). The highly dynamic nature of the HP1-chromatin interaction raises the question as to how HP1 can mediate the formation of a stable heterochromatin state, and how its mode of interaction differs between euchromatin and heterochromatin. That issue was addressed in this study. Since for HP1 the time to associate with a binding site is fast as compared to the time to diffuse across the bleach spot, both the binding kinetics and the diffusion must be accounted for in the quantitative description of the FRAP recovery curves (28). Accordingly, we took advantage of previous advancements in the analysis of FRAP data (25) to dissect the contribution of diffusion and binding interactions. Furthermore, FCS experiments with high spatial and temporal resolution were conducted to obtain additional data for the extraction of mobility and interaction parameters, as well as valuable information on the spatially resolved protein concentrations.
HP1α and HP1β are localized in heterochromatin foci at a 2–4 fold higher concentration than in euchromatin
GFP-HP1α and the TagRFP/GFP-HP1β fusion protein were enriched in the pericentric heterochromatin foci (Fig. 1, A–C). Immunostaining against H3K9me3 yielded the expected colocalization with the HP1α-enriched chromocenters (Fig. 1 B) and the Suv39h1 histone methyltransferase (Fig. 1 A). When we compared the iMEF wild-type cells (iMEF-wt) with the iMEF-dn mutant for Suv39h1/2 (Fig. 1, C and D), it was apparent that in the double null cells the H3K9me3 modification was absent and that HP1β was distributed homogeneously in the nucleus and no longer targeted to the chromocenters (23). It should be noted that these persisted in the absence of HP1 binding and the H3K9me3 modification, which can be seen in the DAPI stain.
Figure 1.
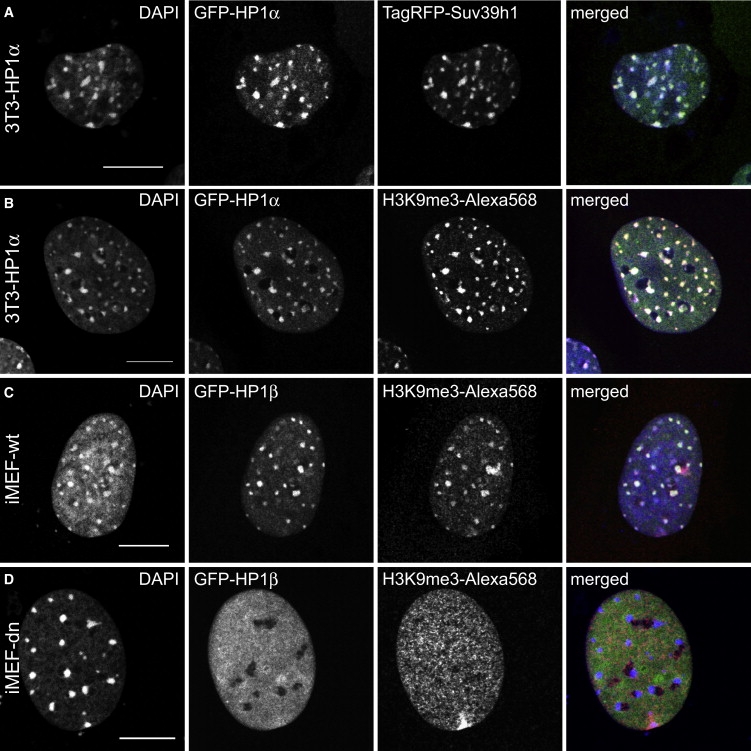
Localization of HP1 in the nucleus of 3T3 cells and iMEFs. HP1α was enriched in pericentric heterochromatin foci that are identified by increased DAPI staining. The scale bar is 10 μm. (A) Transfection of 3T3-HP1α cells with TagRFP-Suv39h1 reveals the colocalization of the two proteins. (B) Anti-H3K9me3 immunostaining shows that HP1α colocalizes with the H3K9me3 modification. (C) In iMEF-wt cells, GFP-HP1β and the histone H3 lysine 9 trimethylation mark colocalize in pericentric heterochromatin, as in the 3T3-HP1α cell line. (D) The iMEF-dn double null mutant lacking the H3K9 histone methyltransferases Suv39h1 and Suv39h2 displays no trimethylation at the chromocenters, and the HP1β distribution is diffuse.
We evaluated the HP1 protein density and the DNA density (via DAPI staining) within euchromatin and heterochromatin regions in 3T3-HP1α cells by calculating the average fluorescence intensity within a defined region of interest. The DAPI staining showed a 2.0 ± 0.3-fold higher intensity in heterochromatin as compared to euchromatin. The enrichment of the GFP-HP1α signal in the heterochromatin foci was 2.0 ± 0.3-fold, and for GFP-HP1β it was 4.4 ± 1.3-fold compared to euchromatin. Thus, only a moderate enrichment of HP1α and β in heterochromatin as compared to euchromatin was apparent in this type of analysis.
Spatial pFRAP analysis demonstrates a significant contribution of diffusion to the recovery curves
We investigated the contributions of diffusion and binding to the recovery kinetics of HP1α by bleaching a strip through the cell nucleus and evaluating the time evolution of the intensity profile (Fig. 2). For a purely binding-dominant recovery, the boundary of the bleached region would remain essentially unchanged and the reequilibration of the fluorescence intensity would proceed via an increase of the amplitude of the bleach profile (24). For HP1α and HP1β, the shape of the initially rectangular bleach profile broadened. Thus, diffusion made a significant contribution to the redistribution process, which was well described by a confined diffusion model according to the equations in the Supporting Material. The resulting diffusion coefficient Dglobal = 1.4 ± 0.3 μm2 s−1 (Fig. 2, B and C, and Table 1) represents the averaged nuclear mobility of HP1α. It includes the contribution of transient binding events that manifest themselves as a reduction of the apparent diffusion coefficient, whereas more long-lived interactions were insignificant during the relatively short data acquisition time of 5.6 s. This is apparent when we compare the value Dglobal = 1.4 ± 0.3 μm2 s−1 with the expected mobility of free HP1 monomer and dimer with and without GFP label as calculated from all-atom model structures (Table S1). Including a correction to the ∼3.5-fold higher effective viscosity within the cell, this yields values of 19.6 μm2 s−1 and 17.5 μm2 s−1 for HP1 dimers carrying one and two GFP tags, respectively, and 22.3 μm2 s−1 for a GFP-HP1 monomer. Thus, for the evaluation of the HP1 FRAP recovery curves, both diffusion and binding make significant contributions and have to be taken into account explicitly, as previously concluded (29).
Figure 2.
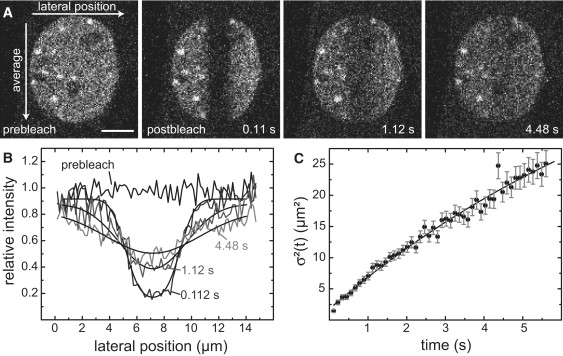
Boundary shape analysis in pFRAP. (A) Time series in which a rectangular region across the nucleus was bleached. Selected images of the time series are shown. Scale bar: 5 μm. For the analysis, the intensity was averaged in parallel to the bleach region and subsequently the corresponding profile perpendicular to it was plotted. (B) Intensity profiles for pre- and postbleach time points and the corresponding fit curves. (C) The profiles of 50 postbleach curves were analyzed with a confined diffusion model.
Table 1.
FRAP analysis of HP1α and HP1β
| 3T3-HP1α |
NIH 3T3 HP1β |
iMEF-wt HP1β |
iMEF-dn HP1β∗ |
||||
|---|---|---|---|---|---|---|---|
| Euchromatin† | Heterochromatin‡ | Euchromatin† | Heterochromatin‡ | Euchromatin† | Heterochromatin‡ | ||
| Dapp†‡ (μm2 s−1) | 0.13 ± 0.03 | 0.9 ± 0.5 | 0.24 ± 0.06 | 1.5 ± 0.7 | 0.4 ± 0.1 | 2.3 ± 0.4 | 0.4 ± 0.1 |
| koff‡ (s−1) | — | 0.15 ± 0.04 | — | 0.4 ± 0.1 | — | 0.6 ± 0.1 | — |
| k∗on‡ (s−1) | — | 0.41 ± 0.12 | — | 2.0 ± 0.6 | — | 1.7 ± 0.1 | — |
| Free‡ (%) | — | 24 ± 3 | — | 18 ± 8 | — | 25 ± 2 | — |
| Bound‡ (%) | — | 65 ± 3 | — | 74 ± 8 | — | 75 ± 2 | — |
| fim†‡ (%) | 1 ± 2 | 11 ± 4 | 2 ± 2 | 8 ± 5 | 2 ± 2 | 7 ± 3 | 1 ± 1 |
| Dglobal§ (μm2s−1) | 1.4 ± 0.3 | 0.9 ± 0.1 | n. d.¶ | n. d.¶ | |||
Measurements were conducted with the stable 3T3-HP1α cell line, with GFP-HP1β transiently transfected into NIH 3T3 cells, the wild-type mouse embryonic fibroblasts (iMEF-wt), or the iMEF-dn cells that are double null for the histone methylases Suv39h1 and Suv39h2. Errors correspond to a 95% confidence interval. See also the Supporting Material.
In these cells, HP1 did not colocalize with the chromocenters, although they were still present as evident from the DAPI staining (Fig. 1D). Measurements were conducted both in chromocenters as identified by a histone H2A-mRFP1 chromatin signal and in adjacent decondensed chromatin regions. The results were indistinguishable with respect to the values determined for Dapp and the immobile fraction, and were well described by a diffusion-only model as applied to euchromatin in the three other cell lines (see below). Accordingly, only the average value of measurements at both dense and open chromatin locations is given for the iMEF-dn cell line.
GFP-HP1 mobility in euchromatin is well described by a diffusion-dominant model that has only Dapp and the immobile fraction fim as fit parameters. The value of the apparent diffusion coefficient Dapp also includes some contribution of transient binding to HP1 mobility.
In heterochromatin, a reaction-diffusion model was applied in the data analysis (see text). The values for the iMEF-wt cells were obtained by fitting the average of 24 FRAP measurements.
Effective diffusion coefficient Dglobal is an average over different chromatin domains and was obtained by pFRAP analysis, in which a strip through the nucleus is bleached.
Not determined.
FRAP experiments identify differences in HP1 binding to euchromatin and heterochromatin that depend on the Suv39h1/2 methylase
To identify differences in the diffusion kinetics and binding of HP1 in euchromatin and heterochromatin, we performed FRAP experiments. Spherical regions of the dimension of heterochromatin foci with an effective diameter of 1.9 μm were bleached in either heterochromatin or euchromatin (Fig. 3 A and Table 1). The redistribution of fluorescently labeled HP1 was recorded in sequential imaging scans and plotted versus time (Fig. 3 B). This intensity-based evaluation of FRAP measurements demonstrated that HP1α in the 3T3-HP1α cell line was highly mobile within the nucleoplasm, especially in euchromatin domains, and somewhat less mobile in the heterochromatin foci. Whereas in euchromatin the recovery of bleached GFP-HP1α/β was complete in 60 s, in heterochromatin a 10% fraction was identified that was immobilized during this time period (Table 1).
Figure 3.
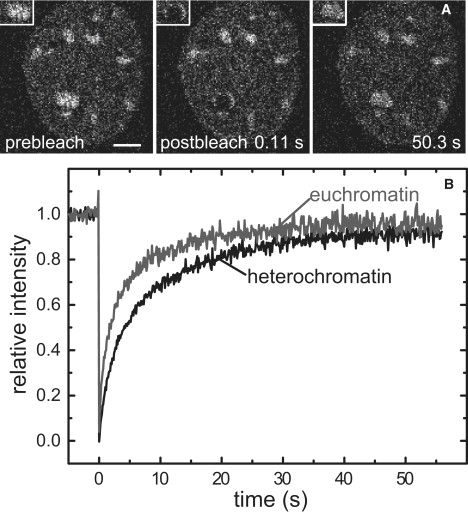
Diffusion and interaction analysis of HP1α in euchromatin and heterochromatin in 3T3-HP1α cells. (A) A circular region of interest with an effective diameter of 1.9 μm was bleached, and selected images of a time series are shown. The measurement was done within a heterochromatin focus and the insets show a zoomed image of the bleached area. The scale bar is 5 μm. (B) A comparison of the quantitative FRAP analysis in euchromatin and heterochromatin reveals a higher mobility in euchromatin. The curves represent average values from at least 10 cells.
To gain additional quantitative information about the distribution of diffusive or transiently binding fractions, we applied three different models to the analysis of the FRAP data: 1), the diffusion-dominant model (Fig. S1, A and D) assuming that proteins are freely mobile; 2), the reaction-dominant model (Fig. S1, B and E), in which diffusion is assumed to be very fast compared to binding on the timescale of the FRAP measurement; and 3), the diffusion-reaction model, which considers contributions from both binding and diffusion on similar timescales (Fig. S1, C and F). The quality of the fit to the three different models was evaluated by a statistical F-test (Supporting Material). In euchromatin (Fig. S1, A–C) the best model was the diffusion-dominant model, and for HP1α in euchromatin Dapp = 0.13 ± 0.03 μm2 s−1 was obtained. The low value of the apparent diffusion coefficient Dapp reflects the contribution of transient binding events. Under the condition that , the binding contribution cannot be dissected from the diffusion term. In this case, the recovery curve can be described by a diffusion-dominant model with a reduced diffusion coefficient . A lower boundary value of koff = 6.2 s−1 was determined by comparing the fit quality of simulated recovery curves for different koff values (Supporting Material).
For the more complex dynamics of GFP-HP1α in heterochromatin, the diffusion-reaction model resulted in a significantly better fit (Fig. S1, D–F). The diffusion coefficient was determined to be Dapp = 0.9 ± 0.5 μm2 s−1 for the fraction of mobile molecules (∼24% ± 3%). The interacting fraction comprised 65% ± 3% and had a dissociation constant of koff = 0.15 ± 0.04 s−1 corresponding to an average residence time of tres = 7 s in the chromatin-bound state (tres = 1/koff; Table 1). For the 11% ± 4% fraction of immobilized HP1α molecules, the tres ∼2 min was estimated from FRAP experiments in which the recovery was monitored over 5 min.
Measurements of HP1β mobility in euchromatin and heterochromatin of iMEF-wt cells yielded results very similar to those obtained with the NIH 3T3 cells (Table 1). In particular, for heterochromatin, a fraction that was immobile on the minute scale was detected and a reaction-diffusion model was required to describe the data with Dapp = 2.3 ± 0.4 μm2 s−1 and koff = 0.6 ± 0.1 s−1 as compared to Dapp = 1.5 ± 0.7 μm2 s−1 and koff = 0.4 ± 0.1 s−1 in NIH 3T3 cells. In contrast, HP1β mobility and chromatin interactions were very different in the iMEF-dn cell line that lacks Suv39h1/2 and H3K9 trimethylation in pericentric heterochromatin, and exhibits a homogeneous distribution of HP1β in the nucleus (Fig. 1 D). Measurements were conducted in both open and dense chromatin regions as identified by a histone H2A-mRFP1 chromatin signal. Within both nuclear subcompartments, HP1β mobility was indistinguishable in the FRAP experiments and almost identical to that observed in the euchromatic regions of NIH 3T3 and iMEF-wt cells. The mobility was well described by a diffusion model with Dapp = 0.4 ± 0.1 μm2 s−1 and a negligible immobile fraction (Table 1). This is likely the result of both the absence of the methylases themselves and the corresponding lack of the H3K9me3 modification in pericentric heterochromatin. It was previously shown that the H3K9me2/3 modification increases the binding affinity of the HP1 chromodomain to a H3 tail peptide with a Kd of 2.5–4 μM (12,13). In addition, since HP1 and Suv39 proteins interact with each other, the binding of the two proteins to chromatin could be cooperative (16,30,31). This is in agreement with previous studies in yeast that reported an increase in the mobility of the HP1 family protein Swi6 in a strain deficient of the Clr4 histone methyltransferase, which has structural and functional similarities to the mammalian Suv39h1/2 proteins (21). Furthermore, it was shown that the ability of Clr4 to bind to the H3K9me3 mark via its chromodomain is important for maintaining heterochromatin, in addition to its catalytic histone methylation activity (32). Thus, it is concluded that the stronger-affinity binding sites for HP1 in heterochromatin are characterized by both the presence of the H3K9me2/3 modification and the enrichment of Suv39h1/2 protein bound at these sites.
CP and FLIP experiments confirm the FRAP results obtained for HP1α binding to heterochromatin
The point CP experiments allow for the analysis of slow binding processes with better spatial resolution as compared to FRAP. From the temporal behavior of the mostly biphasic CP curves, the bound fraction and/or the dissociation rate or residence time at binding sites can be derived. The fraction of immobilized HP1 protein determined from FRAP experiments was included as a fixed parameter to obtain a robust fit value for the dissociation constant koff that was determined from the slower-decaying part of the curve (Fig. S2 A). The dissociation rate koff = 0.12 ± 0.04 s−1 was measured, which confirmed the results of the FRAP experiments with koff = 0.15 ± 0.04 s−1. In euchromatin, HP1α displayed fast interactions with . In this case, the measurement could not be decomposed into the bound and free ligand fractions, and therefore no off-rate could be determined (26). Measurements in the cytoplasm showed only a slow asymptotic decay (data not shown). This supports the conclusion that HP1 is a freely mobile species in this compartment.
The CP analysis was complemented with FLIP studies to observe the dissociation of the more tightly bound HP1α fraction. These experiments clearly revealed the differences between HP1α binding in heterochromatin and euchromatin in the 3T3-HP1α cell line (Fig. S2 B). After 10–20 s the differences in the protein dissociation processes were clearly visible in the bleaching curves. A maximum intensity difference of 8% ± 2% was observed at 70 ± 20 s. At this time point, a significant fraction of the interacting HP1 molecules began to be replaced by bleached molecules. With FRAP, we measured an 11% HP1α fraction immobilized for at least 60 s in heterochromatin, which can be assigned to the stably bound HP1α fraction detected in the FLIP experiments.
FCS measurements of HP1 provide spatially resolved effective diffusion coefficients, anomalous diffusion parameters, and concentrations
To further dissect GFP-HP1 mobility and interactions with better spatial and temporal resolution, we applied an FCS analysis. Expressions for an anomalous diffusion model with one or two components were found to best fit the autocorrelation function (ACF). In the cytoplasm, HP1 mobility was described by an anomalous diffusion model for a single, monodisperse species (Fig. 4, and Fig. S3 A). A mean diffusion time of τdiff = 315 ± 33 μs and an anomaly parameter of α = 0.8 ± 0.1 were determined corresponding to D = 23 ± 2 μm2 s−1 (Table 2). This is similar to a previously reported measurement of D = 26 ± 2 μm2 s−1 (15) and fits very well with the value predicted for a GFP-HP1 monomer of D25°C,cell = 22.3 μm2 s−1 from hydrodynamic calculations when accounting for a 3.5-fold viscosity increase in the cytoplasm as compared to water (22) (Table S1). For a GFP-tagged HP1 dimer, somewhat lower values of 17–19 μm2 s−1 are expected (Table S1). FCS measurements of free GFP as a reference in the cytoplasm yielded D = 24 ± 5 μm2 s−1. Thus, the comparison of the measured and calculated diffusion coefficients of GFP-HP1α and GFP alone indicate that GFP-HP1α is monomeric in the cytoplasm.
Figure 4.
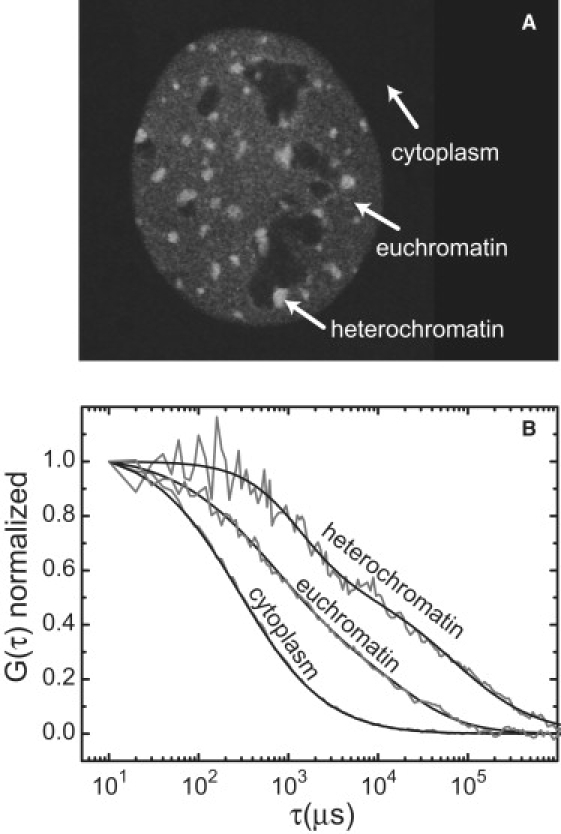
HP1α dynamics measured by FCS. (A) FCS experiments were conducted with 3T3-HP1α cells in the indicated cellular regions. (B) The normalized ACFs were fitted to an anomalous diffusion model (solid line). A one-component fit of data measured in the cytoplasm, and two-component fits of the euchromatin and heterochromatin data are displayed.
Table 2.
FCS measurements of HP1α and HP1β in NIH 3T3 cells
| Cytoplasm∗ |
Euchromatin† |
Heterochromatin† |
||||
|---|---|---|---|---|---|---|
| HP1α | HP1β | HP1α | HP1β | HP1α | HP1β | |
| D1 (μm2 s−1) | 23.4 ± 2.4 | 24.3 ± 5.6 | 7.7 ± 0.8 | 3.2 ± 0.8 | 3.9 ± 0.9 | 3.7 ± 0.6 |
| α1 | 0.83 ± 0.05 | 0.74 ± 0.05 | 0.81 ± 0.04 | 0.79 ± 0.06 | 0.88 ± 0.12 | 0.83 ± 0.08 |
| D2 (μm2 s−1) | — | — | 0.21 ± 0.04 | 0.07 ± 0.02 | 0.05 ± 0.02 | 0.04 ± 0.01 |
| α2 | — | — | >1 | >1 | >1 | >1 |
Data were analyzed with a one- or two-component anomalous diffusion model. As a reference, the diffusion constant of GFP was measured to be D = 23.7 ± 4.5 μm2 s−1 in the cytoplasm (α = 0.97 ± 0.04) and D = 21.5 ± 4.8 μm2 s−1 in the nucleus (α = 1.1 ± 0.1). Euchromatin and heterochromatin regions were not distinguishable in terms of the associated GFP mobility. See also the Supporting Material.
The data for the HP1α and HP1β mobility in the cytoplasm were fit with a one-component anomalous diffusion model (D1, α1). (Error limits correspond to a 95% confidence interval.)
For the nuclear fraction of HP1α and HP1β, a two-component model was required to describe the data. The faster-moving fraction with diffusion constant D1 displayed a subdiffusion behavior (α < 1), as expected for transient binding and/or diffusion in the presence of obstacles. For the second fraction, intensity fluctuations were very slow and displayed a value of α > 1. A more detailed analysis of the associated intensity fluctuations revealed that they originate from chromatin-bound molecules and can be described by a confined diffusion model.
The ACFs obtained in euchromatin and heterochromatin required a two-component anomalous diffusion model, from which the diffusion coefficients of a highly mobile fraction and a second slow mobility fraction were extracted (Fig. 4, and Fig. S3, C and D). In euchromatin, the first component comprised 77% ± 3% with τ1,diff = 973 ± 95 μs, D1 = 7.7 ± 0.8 μm2 s−1 and α1 = 0.81 ± 0.04. The second fraction moved significantly more slowly with a diffusion time of 45 ± 16 ms and α > 1, corresponding to D2 = 0.21 ± 0.04 μm2 s−1. The corresponding analysis in heterochromatin revealed a considerably smaller fast-moving fraction (∼55% ± 4%) with a diffusion time of τ1,diff = 2.1 ± 0.6 ms, D1 = 3.9 ± 0.9 μm2 s−1 and α1 = 0.9 ± 0.1. Again the second species was much slower, with τ2,diff = 223 ± 69 ms (D2 = 0.05 ± 0.02 μm2 s−1) and α > 1. An anomaly parameter between one (free diffusion) and two (ballistic movement) can arise from energy-driven directed motion. For the determination of the anomaly parameter from FCS measurements, a value of α > 1 can also originate from confined diffusion (26). Therefore, a second model was used in which all values for the first diffusive species were fixed to the values obtained from the first fit and the second species was modeled with a spatially confined mobility (Fig. S3, C and D, dashed curves). This approach resulted in a fit of equally good quality and diffusion coefficients of 0.20 ± 0.05 μm2 s−1 (euchromatin) and 0.04 ± 0.01 μm2 s−1 (heterochromatin) for the second species, which can be rationalized as the confined mobility of a chromatin fiber with bound HP1.
The inverse proportionality between the ACF amplitude and the protein concentration in FCS experiments was exploited to measure the concentration of GFP-HP1α in the cytoplasm, euchromatin, and heterochromatin, yielding values of ccyt = 0.16 ± 0.11 μM, ceu = 0.87 ± 0.07 μM, and chet = 2.1 ± 0.3 μM, respectively (Table S2). To compare the amount of fluorescently tagged GFP-HP1α and endogenously produced HP1α, a quantitative Western blotting analysis was performed (Fig. S3 B). The amount of GFP-HP1α was measured to be 4.2 ± 0.5-fold higher than that of the endogenous protein. This corresponds to a concentration of endogenous HP1α monomer in the original untransfected 3T3 cell line of ccyt = 0.08 ± 0.05 μM, ceu = 0.41 ± 0.05 μM, and chet = 1.0 ± 0.2 μM. This is significantly lower than a previous estimate that reported one HP1 molecule per 15 nucleosomes in a third instar larval nucleus in Drosophila, which would correspond to a total HP1 concentration of ∼10 μM (5,33,34). Nevertheless, the micromolar concentration of HP1α could be sufficient to induce the formation of HP1 dimers via its chromoshadow domain, as inferred from in vitro experiments (S. Kaltofen and K. Rippe, unpublished results). In addition, it is conceivable that crowding effects, especially in the high-density heterochromatin areas, as well as binding of HP1 to chromatin could promote dimerization of the protein.
Bleaching and correlation data can be integrated into a multiscale analysis of HP1 mobility and interactions
From the analysis of HP1α and HP1β mobility at different time and length scales, a comprehensive mobility picture of HP1α/β in the nucleus was obtained. In heterochromatin, FRAP experiments revealed a specifically binding HP1 fraction with a dissociation rate koff = 0.15 s−1, a value that was confirmed by CP experiments. This fraction was less abundant in euchromatin, which suggests that it arises from interactions with binding sites enriched in heterochromatin (referred to as class II sites). The diffusion coefficient for the mobile HP1 fraction in heterochromatin of Dapp = 0.9 ± 0.5 μm2 s−1 was in good agreement with the average value determined by pFRAP analysis (Dglobal = 1.4 ± 0.3 μm2 s−1). The Dapp value reflects the free diffusion together with transient binding interactions that are too fast to be resolved (referred to here as class I sites). These are present in both euchromatin and heterochromatin. Using the FRAP data obtained in euchromatin, an upper boundary for the class I residence time of 0.2 s was obtained. From the FCS experiments, an effective diffusion coefficient of Dapp = 3.9 ± 0.9 μm2 s−1 for HP1 mobility that includes binding to the class I sites was determined in heterochromatin. This value is equivalent to the FRAP value if the scale dependence of the diffusion coefficient in the case of anomalous diffusion is taken into consideration (see the Supporting Material). Class II binding cannot be detected by FCS because the corresponding dissociation rate is larger than the typical bleaching rate (HP1 is bound for 1/koff = 7 s, whereas bleaching is complete within 1–2 s).
In euchromatin, FRAP experiments yielded an apparent diffusion coefficient of Dapp = 0.13 ± 0.03 μm2 s−1, which represents the HP1 mobility and interactions with binding sites of class I and class II. Class II binding sites cannot be resolved separately, which suggests that their contribution is less significant than in heterochromatin. When the FRAP data measured in euchromatin were fitted with a diffusion-reaction model using koff = 0.15 s−1 of class II binding as a fixed parameter, a very low local concentration of class II binding sites was obtained, confirming this conclusion. FCS experiments in euchromatin yielded an apparent diffusion coefficient of 7.7 ± 0.8 μm2 s−1, which presumably includes the interaction between HP1 and class I binding sites. It is larger in euchromatin since the chromatin concentration (and thus the concentration of class I binding sites) is smaller than in heterochromatin, resulting in less HP1 binding and higher HP1 mobility. In addition, a 10% fraction of HP1α/β was detected in heterochromatin that had an average residence time of 2 min in the FRAP experiments. The corresponding higher-affinity binding sites are referred to here as class III binding sites.
In heterochromatin, the contribution of class II binding sites can be separated to calculate the pseudo-equilibrium constant K∗eq = k∗on/koff = kon [S]eq/koff, which includes the free binding site concentration [S]eq, to be K∗eq,II = 2.7 (see the Supporting Material). The pseudo-affinity for the class I binding sites can be determined based on the comparison of the free and apparent diffusion coefficients that incorporates transient binding interactions. The free diffusion coefficient was measured by FCS in the cytoplasm and scaled appropriately to yield a value of K∗eq,I = 15, under the assumption that the decrease in the apparent diffusion coefficient is exclusively caused by binding interactions.
In euchromatin, binding to class I and class II cannot be separated, resulting in an apparent diffusion coefficient that contains both contributions. From the pseudo-binding constants determined in heterochromatin, and the effective diffusion coefficient in euchromatin, relative fractions of 66% (class I) and 34% (class II) binding sites in euchromatin are estimated. To convert pseudo-binding constants into true binding affinities, the appropriate values of [S]eq must be known. To a first approximation, one can assume that the most abundant interaction partner of HP1 represented by the class I binding sites is a nucleosome. Accordingly, [S]eq can be related to the average nucleosome concentration of 140 μM (22). This would correspond to an affinity of Keq,I = 1.1 ± 0.2 105 M−1 for class I binding sites.
Conclusions
The data obtained here can be reconciled in the model depicted in Fig. 5. In the cytoplasm, highly mobile monomeric HP1 was present. In the nucleus, three different binding sites can be identified: 1), one binding site that is ubiquitously present in chromatin (class I, tres ≤ 0.2 s); 2), one stronger binding site that is enriched in heterochromatin (class II, tres= 7 s); and 3), the strongest binding site, which is present only in heterochromatin (class III, tres = 2 min). It is also noteworthy that the ratio of class I to class II binding sites is ∼2:1 in euchromatin and 1:2 in heterochromatin. Thus, the 2–4-fold enrichment of HP1α/β in heterochromatin originates from the twofold higher fraction of class II and the additional class III binding sites. As discussed above, these are likely to reflect an increase of the H3K9me2/3 modifications and/or the presence of Suv39h1/2 as an HP1-interacting protein (12,13,16,30,31). The concentration of HP1α/β in heterochromatin is in the low micromolar range and thus represents only a very small fraction of transiently associated protein as compared to the 200–300 μM nucleosome concentration (22). This imposes a number of constraints for the mechanism by which HP1, the Suv39h1/2 methylases, and the H3K9me2/3 modification cooperate to maintain a stable heterochromatin state that can cover several megabasepairs of DNA.
Figure 5.
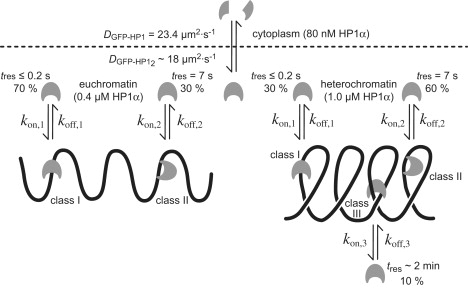
Kinetic model of HP1 mobility and interactions in the cell. A highly diffusive, noninteracting species was found in the cytoplasm. Different fractions of HP1 molecules were detected within the nucleus. A highly mobile fraction diffuses throughout the whole nucleus, showing unspecific binding interactions (class I); some HP1 molecules bind transiently but specifically to euchromatin or heterochromatin (class II); and a third fraction is stably incorporated into chromatin, probably via interaction with various binding partners (class III). Values for diffusion coefficients and residence times are given for HP1α.
Supporting Material
Methods, equations, figures, tables, and references are available at http://www.biophysj.org/biophysj/supplemental/S0006-3495(09)01467-2.
Supporting Material
Acknowledgments
We thank Thomas Höfer, Roland Eils, and Thomas Jenuwein for help and discussions. Parts of the fluorescence microscopy work were conducted at the Nikon Imaging Center at the University of Heidelberg, the Microscopy Core Facility of the German Cancer Research Center, and the Advanced Light Microscopy Facility of the European Molecular Biology Laboratory. We thank Natasha Murzina and Ken Yamamoto for the plasmid vectors, and Nick Kepper for help with calculating diffusion coefficients from model structures.
This project was supported by the German CellNetworks Cluster of Excellence (EXC81) and the SBCancer program within the Helmholtz Alliance on Systems Biology.
Footnotes
Barna D. Fodor's and Mario Richter's present address is Max Planck Institute of Immunobiology, Dept. of Epigenetics, Freiburg, Germany.
References
- 1.Grewal S.I., Jia S. Heterochromatin revisited. Nat. Rev. Genet. 2007;8:35–46. doi: 10.1038/nrg2008. [DOI] [PubMed] [Google Scholar]
- 2.Eissenberg J.C., Reuter G. Cellular mechanism for targeting heterochromatin formation in Drosophila. Int. Rev. Cell. Mol. Biol. 2009;273:1–47. doi: 10.1016/S1937-6448(08)01801-7. [DOI] [PubMed] [Google Scholar]
- 3.Probst A.V., Almouzni G. Pericentric heterochromatin: dynamic organization during early development in mammals. Differentiation. 2008;76:15–23. doi: 10.1111/j.1432-0436.2007.00220.x. [DOI] [PubMed] [Google Scholar]
- 4.Hiragami K., Festenstein R. Heterochromatin protein 1: a pervasive controlling influence. Cell. Mol. Life Sci. 2005;62:2711–2726. doi: 10.1007/s00018-005-5287-9. [DOI] [PMC free article] [PubMed] [Google Scholar]
- 5.Maison C., Almouzni G. HP1 and the dynamics of heterochromatin maintenance. Nat. Rev. Mol. Cell Biol. 2004;5:296–304. doi: 10.1038/nrm1355. [DOI] [PubMed] [Google Scholar]
- 6.Kwon S.H., Workman J.L. The heterochromatin protein 1 (HP1) family: put away a bias toward HP1. Mol. Cells. 2008;26:217–227. [PubMed] [Google Scholar]
- 7.Verschure P.J., van der Kraan I., de Leeuw W., van der Vlag J., Carpenter A.E. In vivo HP1 targeting causes large-scale chromatin condensation and enhanced histone lysine methylation. Mol. Cell. Biol. 2005;25:4552–4564. doi: 10.1128/MCB.25.11.4552-4564.2005. [DOI] [PMC free article] [PubMed] [Google Scholar]
- 8.Dialynas G.K., Terjung S., Brown J.P., Aucott R.L., Baron-Luhr B. Plasticity of HP1 proteins in mammalian cells. J. Cell Sci. 2007;120:3415–3424. doi: 10.1242/jcs.012914. [DOI] [PubMed] [Google Scholar]
- 9.Minc E., Allory Y., Worman H.J., Courvalin J.C., Buendia B. Localization and phosphorylation of HP1 proteins during the cell cycle in mammalian cells. Chromosoma. 1999;108:220–234. doi: 10.1007/s004120050372. [DOI] [PubMed] [Google Scholar]
- 10.Hediger F., Gasser S.M. Heterochromatin protein 1: don't judge the book by its cover! Curr. Opin. Genet. Dev. 2006;16:143–150. doi: 10.1016/j.gde.2006.02.013. [DOI] [PubMed] [Google Scholar]
- 11.Lin C.H., Li B., Swanson S., Zhang Y., Florens L. Heterochromatin protein 1a stimulates histone H3 lysine 36 demethylation by the Drosophila KDM4A demethylase. Mol. Cell. 2008;32:696–706. doi: 10.1016/j.molcel.2008.11.008. [DOI] [PMC free article] [PubMed] [Google Scholar]
- 12.Jacobs S.A., Khorasanizadeh S. Structure of HP1 chromodomain bound to a lysine 9-methylated histone H3 tail. Science. 2002;295:2080–2083. doi: 10.1126/science.1069473. [DOI] [PubMed] [Google Scholar]
- 13.Fischle W., Wang Y., Jacobs S.A., Kim Y., Allis C.D. Molecular basis for the discrimination of repressive methyl-lysine marks in histone H3 by Polycomb and HP1 chromodomains. Genes Dev. 2003;17:1870–1881. doi: 10.1101/gad.1110503. [DOI] [PMC free article] [PubMed] [Google Scholar]
- 14.Nielsen A.L., Oulad-Abdelghani M., Ortiz J.A., Remboutsika E., Chambon P. Heterochromatin formation in mammalian cells: interaction between histones and HP1 proteins. Mol. Cell. 2001;7:729–739. doi: 10.1016/s1097-2765(01)00218-0. [DOI] [PubMed] [Google Scholar]
- 15.Schmiedeberg L., Weisshart K., Diekmann S., Meyer Zu Hoerste G., Hemmerich P. High- and low-mobility populations of HP1 in heterochromatin of mammalian cells. Mol. Biol. Cell. 2004;15:2819–2833. doi: 10.1091/mbc.E03-11-0827. [DOI] [PMC free article] [PubMed] [Google Scholar]
- 16.Schotta G., Ebert A., Krauss V., Fischer A., Hoffmann J. Central role of Drosophila SU(VAR)3–9 in histone H3–K9 methylation and heterochromatic gene silencing. EMBO J. 2002;21:1121–1131. doi: 10.1093/emboj/21.5.1121. [DOI] [PMC free article] [PubMed] [Google Scholar]
- 17.Cheutin T., McNairn A.J., Jenuwein T., Gilbert D.M., Singh P.B. Maintenance of stable heterochromatin domains by dynamic HP1 binding. Science. 2003;299:721–725. doi: 10.1126/science.1078572. [DOI] [PubMed] [Google Scholar]
- 18.Festenstein R., Pagakis S.N., Hiragami K., Lyon D., Verreault A. Modulation of heterochromatin protein 1 dynamics in primary mammalian cells. Science. 2003;299:719–721. doi: 10.1126/science.1078694. [DOI] [PubMed] [Google Scholar]
- 19.Krouwels I.M., Wiesmeijer K., Abraham T.E., Molenaar C., Verwoerd N.P. A glue for heterochromatin maintenance: stable SUV39H1 binding to heterochromatin is reinforced by the SET domain. J. Cell Biol. 2005;170:537–549. doi: 10.1083/jcb.200502154. [DOI] [PMC free article] [PubMed] [Google Scholar]
- 20.Dialynas G.K., Makatsori D., Kourmouli N., Theodoropoulos P.A., McLean K. Methylation-independent binding to histone H3 and cell cycle-dependent incorporation of HP1β into heterochromatin. J. Biol. Chem. 2006;281:14350–14360. doi: 10.1074/jbc.M600558200. [DOI] [PubMed] [Google Scholar]
- 21.Cheutin T., Gorski S.A., May K.M., Singh P.B., Misteli T. In vivo dynamics of Swi6 in yeast: evidence for a stochastic model of heterochromatin. Mol. Cell. Biol. 2004;24:3157–3167. doi: 10.1128/MCB.24.8.3157-3167.2004. [DOI] [PMC free article] [PubMed] [Google Scholar]
- 22.Wachsmuth M., Caudron-Herger M., Rippe K. Genome organization: balancing stability and plasticity. Biochim. Biophys. Acta. 2008;1783:2061–2079. doi: 10.1016/j.bbamcr.2008.07.022. [DOI] [PubMed] [Google Scholar]
- 23.Peters A.H., O'Carroll D., Scherthan H., Mechtler K., Sauer S. Loss of the Suv39h histone methyltransferases impairs mammalian heterochromatin and genome stability. Cell. 2001;107:323–337. doi: 10.1016/s0092-8674(01)00542-6. [DOI] [PubMed] [Google Scholar]
- 24.Wachsmuth M., Weisshardt K. Fluorescence photobleaching and fluorescence correlation spectroscopy: two complementary technologies to study molecular dynamics in living cells. In: Shorte S.L., Frischknecht F., editors. Imaging Cellular and Molecular Biological Functions. Springer Verlag; Berlin/Heidelberg: 2007. pp. 183–234. [Google Scholar]
- 25.Sprague B.L., Pego R.L., Stavreva D.A., McNally J.G. Analysis of binding reactions by fluorescence recovery after photobleaching. Biophys. J. 2004;86:3473–3495. doi: 10.1529/biophysj.103.026765. [DOI] [PMC free article] [PubMed] [Google Scholar]
- 26.Wachsmuth M., Weidemann T., Muller G., Hoffmann-Rohrer U.W., Knoch T.A. Analyzing intracellular binding and diffusion with continuous fluorescence photobleaching. Biophys. J. 2003;84:3353–3363. doi: 10.1016/S0006-3495(03)70059-9. [DOI] [PMC free article] [PubMed] [Google Scholar]
- 27.Rabut G., Ellenberg J. Photobleaching techniques to study mobility and molecular dynamics of proteins in live cells: FRAP, iFRAP, and FLIP. In: Goldman R.D., Spector D.L., editors. Live Cell Imaging—A Laboratory Manual. Cold Spring Harbor Laboratory Press; Cold Spring Harbor, New York: 2005. pp. 101–126. [DOI] [PubMed] [Google Scholar]
- 28.Mueller F., Wach P., McNally J.G. Evidence for a common mode of transcription factor interaction with chromatin as revealed by improved quantitative fluorescence recovery after photobleaching. Biophys. J. 2008;94:3323–3339. doi: 10.1529/biophysj.107.123182. [DOI] [PMC free article] [PubMed] [Google Scholar]
- 29.Beaudouin J., Mora-Bermúdez F., Klee T., Daigle N., Ellenberg J. Dissecting the contribution of diffusion and interactions to the mobility of nuclear proteins. Biophys. J. 2006;90:1878–1894. doi: 10.1529/biophysj.105.071241. [DOI] [PMC free article] [PubMed] [Google Scholar]
- 30.Yamamoto K., Sonoda M. Self-interaction of heterochromatin protein 1 is required for direct binding to histone methyltransferase, SUV39H1. Biochem. Biophys. Res. Commun. 2003;301:287–292. doi: 10.1016/s0006-291x(02)03021-8. [DOI] [PubMed] [Google Scholar]
- 31.Eskeland R., Eberharter A., Imhof A. HP1 binding to chromatin methylated at H3K9 is enhanced by auxiliary factors. Mol. Cell. Biol. 2007;27:453–465. doi: 10.1128/MCB.01576-06. [DOI] [PMC free article] [PubMed] [Google Scholar]
- 32.Zhang K., Mosch K., Fischle W., Grewal S.I. Roles of the Clr4 methyltransferase complex in nucleation, spreading and maintenance of heterochromatin. Nat. Struct. Mol. Biol. 2008;15:381–388. doi: 10.1038/nsmb.1406. [DOI] [PubMed] [Google Scholar]
- 33.Lu B.Y., Emtage P.C., Duyf B.J., Hilliker A.J., Eissenberg J.C. Heterochromatin protein 1 is required for the normal expression of two heterochromatin genes in Drosophila. Genetics. 2000;155:699–708. doi: 10.1093/genetics/155.2.699. [DOI] [PMC free article] [PubMed] [Google Scholar]
- 34.Stehr R., Kepper N., Rippe K., Wedemann G. The effect of internucleosomal interaction on folding of the chromatin fiber. Biophys. J. 2008;95:3677–3691. doi: 10.1529/biophysj.107.120543. [DOI] [PMC free article] [PubMed] [Google Scholar]
Associated Data
This section collects any data citations, data availability statements, or supplementary materials included in this article.