

Abstract
Mycobacterium tuberculosis group I truncated hemoglobin trHbN catalyzes the oxidation of nitric oxide (•NO) to nitrate with a second-order rate constant k ≈ 745 μM−1 s−1 at 23°C (nitric oxide dioxygenase reaction). It was proposed that this high efficiency is associated with the presence of hydrophobic tunnels inside trHbN structure that allow substrate diffusion to the distal heme pocket. In this work, we investigated the mechanisms of •NO diffusion within trHbN tunnels in the context of the nitric oxide dioxygenase reaction using two independent approaches. Molecular dynamics simulations of trHbN were performed in the presence of explicit •NO molecules. Successful •NO diffusion from the bulk solvent to the distal heme pocket was observed in all simulations performed. The simulations revealed that •NO interacts with trHbN at specific surface sites, composed of hydrophobic residues located at tunnel entrances. The entry and the internal diffusion of •NO inside trHbN were performed using the Long, Short, and EH tunnels reported earlier. The Short tunnel was preferentially used by •NO to reach the distal heme pocket. This preference is ascribed to its hydrophobic funnel-shape entrance, covering a large area extending far from the tunnel entrance. This funnel-shape entrance triggers the frequent formation of solvent-excluded cavities capable of hosting up to three •NO molecules, thereby accelerating •NO capture and entry. The importance of hydrophobicity of entrances for •NO capture is highlighted by a comparison with a polar mutant for which residues at entrances were mutated with polar residues. A complete map of •NO diffusion pathways inside trHbN matrix was calculated, and •NO molecules were found to diffuse from Xe cavity to Xe cavity. This scheme was in perfect agreement with the three-dimensional free-energy distribution calculated using implicit ligand sampling. The trajectories showed that •NO significantly alters the dynamics of the key amino acids of Phe62(E15), a residue proposed to act as a gate controlling ligand traffic inside the Long tunnel, and also of Ile119(H11), at the entrance of the Short tunnel. It is noteworthy that •NO diffusion inside trHbN tunnels is much faster than that reported previously for myoglobin. The results presented in this work shed light on the diffusion mechanism of apolar gaseous substrates inside protein matrix.
Introduction
•NO plays an important role in host defense against microbial pathogens by inhibiting or inactivating key enzymes such as the terminal respiratory oxidases (1–5) and the iron/sulfur protein aconitase (6,7). •NO also combines at near-diffusion-limited rate, with superoxide produced by respiring cells to form the highly oxidizing agent peroxynitrite (8,9). •NO-metabolizing reactions are thus required to defend microbial pathogens against •NO poisoning.
The truncated hemoglobin N (trHbN) from Mycobacterium tuberculosis (Mtb) is thought to play pivotal roles in the cellular metabolism of this organism during stress and hypoxia. TrHbN is expressed during the stationary phase of Mycobacterium bovis BCG (10) and Mtb H37Ra (11). In Mtb H37Ra, the activity of the glbN gene encoding trHbN is upregulated by the general nitrosative stress inducer, nitrite, by the •NO releaser sodium nitroprusside and by hypoxia. The activity of the glbN gene is also enhanced during Mtb H37Ra invasion of THP-1 activated macrophages (producing •NO) (11). Recent studies by our laboratory indicated that trHbN has a potent ability to detoxify •NO to nitrate (nitric oxide dioxygenase (NOD) reaction) and to protect aerobic respiration from the inhibition by •NO in stationary phase cells of M. bovis BCG (10). The high rate of •NO oxidation (k′NOD = 745 μM−1 s−1 at 23°C) catalyzed by oxygenated trHbN suggests that dioxygenation of •NO may be one of the vital defense systems in Mtb for coping with the toxic effects of •NO, and may be important for allowing the intracellular survival of the bacterium in macrophages. This hypothesis is also supported by the observation that expression of trHbN in a •NO-sensitive mutant of Salmonella enterica enhances the survival of the mutant under nitrosative stress conditions and during growth within macrophages (12).
The oxygenated trHbN crystal structure (13) presents two tunnels connecting the distal heme pocket to the bulk solvent: the Short tunnel (ST) and the Long tunnel (LT). Molecular dynamics (MD) simulations (14) revealed two additional tunnels: EH (EHT) and BE (BET) (Fig. 1, top). Previous MD simulations suggested that gaseous substrates such as O2, CO, and •NO would access the active site through these apolar tunnels, which are by nature composed of short-lived cavities of various shapes and volumes (14). We also proposed that the character of these tunnels makes them suitable to store ligands accessible to the active site. A similar proposition was invoked to account for the bimodal solvent phase recombination of CO with the truncated Hb from Paramecium caudatum (15). Finally, the configuration of the active site allows the bound O2 to remain optimally oriented and stabilized by Tyr33(B10) and Gln58(E11) for reaction with •NO (10,13,14,16,17). These singular trHbN characteristics are believed to generate the unequalled NOD rate constant, which is 15-fold and 34-fold faster than that of horse-heart Mb and sperm-whale Mb, respectively (10,18).
Figure 1.
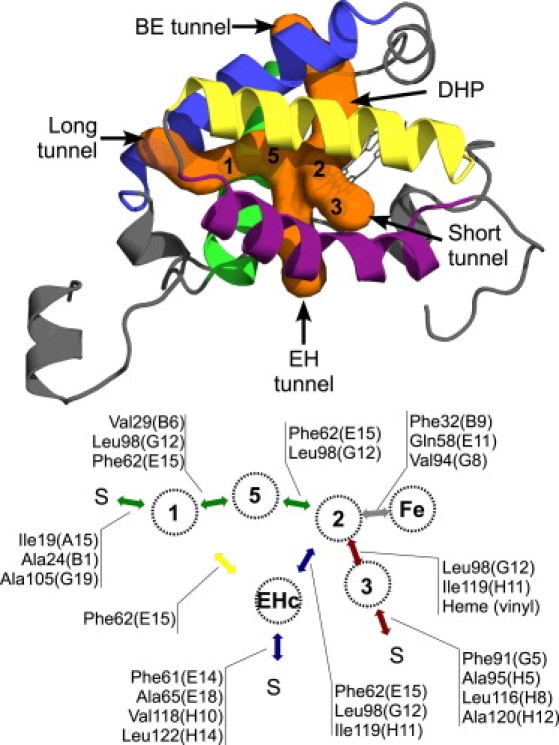
Color online only. (Top) TrHbN structure (PDB entry 1IDR, subunit A). The different tunnels observed in trHbN from MD simulations are represented by the orange surface (14). The B, E, G, and H helices are represented by blue, green, yellow, and purple, respectively. The picture was generated using PyMOL (39). (Bottom) Schema of cavity-to-cavity diffusion routes found in this work. The amino acids separating the different cavities are identified. Diffusion in LT, EHT, and ST are represented by the green, blue, and red arrows, respectively. The yellow arrow indicates diffusion between EHc and Xe1. BET was not used by •NO over 200-ns total MD simulation time. The letter S indicates the solvent. Briefly, a •NO molecule can reach the distal heme pocket using the ST, LT, or EHT. Diffusion occurs by hopping from one cavity to another. Using the ST, •NO leaves the bulk and enters the funnel-shape entrance nearby Xe3. Then, •NO hops to Xe2 from where it can hop to the DHP (gray arrow). In the DHP, •NO is within contact distance of the bound O2. Diffusion in the LT is quite different. First, •NO molecule enters the protein matrix and docks inside Xe1, and constrains the Phe62(E15) residue to stay in the M state. Diffusion toward Xe2 via Xe5 is sterically compromised but not impossible. This is performed by hopping from Xe1 to Xe5 and then to Xe2 (Xe1→Xe5→Xe2). This scenario involves a free energy barrier of 3.2 ± 0.6 kcal/mol. An alternative route with a lower barrier exists: Xe1→EHc→Xe2. The diffusion Xe1→EHc involves a free energy barrier of ∼1.5 ± 0.6 kcal/mol. When •NO occupies EHc, Phe62(E15) is unconstrained and therefore can adopt either the M or the T state. In the T state, there is no free energy barrier between EHc and Xe2 and diffusion between these two sites is allowed. For the EHT, diffusion begins with the •NO passage from the bulk to the EHc. The next diffusion step toward the DHP occurs as described for LT. •NO escape to the bulk is unlikely because of the free energy cost (≈4.5 ± 0.3 kcal/mol). Only two such events were observed through the ST. A •NO molecule can also leave DHP to dock inside farther cavities (Xe2→EHc→Xe1). Diffusion through Xe5 (Xe2→Xe5→Xe1) is sterically compromised by the Phe62(E15) side chain, which is restricted to the T state when •NO reaches Xe5 (the Xe1 cavity is filled by the Phe62(E15) aromatic ring).
Previous work using steered MD simulations aimed at understanding O2 and •NO diffusion in trHbN (19). The results suggested that O2 reaches the active site of deoxy-trHbN through the ST while •NO accesses bound O2 through the LT (referred as the dual-path mechanism). However, due to the limitations of the method (a biasing force drives ligand diffusion along predefined coordinates), important aspects of ligand diffusion before the actual NOD reaction were not addressed in this study. How ligands interact with trHbN surface, how they enter the protein matrix, and how they diffuse to the active site are events that may influence the NOD reaction. In this work, we address these specific issues using unbiased explicit MD simulations where NO molecules were initially placed in the bulk solvent. In addition, we present a detailed description of •NO diffusion processes along the different pathways, as well as the free-energy cost associated with •NO diffusion inside the different trHbN channels. Two major findings arise from this study: the hydrophobic nature of entrances is responsible for •NO capture before diffusion to DHP; and the dual-path mechanism is refuted.
Methods
Molecular dynamics (MD) simulations
MD simulations were performed using CHARMM software (20) with the CHARMM22 all-atom potential energy parameter set (21) and O2-bound heme force-field parameters (14). Simulations were performed as described previously (14). A complete description of the simulation protocol is given as Supporting Material. A total of 260 ns of trajectories were produced: two trajectories of 30 ns each without free •NO molecule and 10 trajectories of 20 ns each including 10 free •NO molecules. An additional 20-ns MD trajectory of a trHbN multiple polar mutant was carried in absence of •NO. Mutations were designed to increase polarity of tunnel entrances without filling cavities (this design is discussed in the Supporting Material). The mutations consisted in the replacement of hydrophobic amino acids located at tunnel entrances by polar residues: Ala95(G9)Ser and Ala120(H12)Asp for ST, and Ala24(B1)Ser for LT, and Val118(H10)Asp for EHT. The trajectory was calculated using NAMD (22). Only the last 15 ns of the trajectory were used for analysis.
Analysis
To study •NO interactions with trHbN surface, the time of contact between •NO molecules and all trHbN atoms was calculated using whole trajectories and a distance cutoff of 3.5 Å. The solvent-excluded accessible volumes at the tunnel entrances were calculated using the VOIDOO software with a probe radius of 1.4 Å (23). The probability density (or probability distribution) of •NO at the surface and inside trHbN was determined using all •NO coordinates along the last 15 ns of the 10 simulations performed, giving a total of 150,000 sets of coordinates. A distance cutoff of 3 Å from the •NO center-of-mass was taken for the calculation of •NO probability density.
Implicit ligand sampling
The ligand potential of mean force (PMF) inside trHbN was determined using the implicit ligand sampling (ILS) method (24) included in the open source VMD 1.8.6 software package (25). The errors on PMF values were estimated as described in Cohen et al. (24). A drawback of the method concerns the overestimation of energy barriers due to the absence of the ligand (24). For each ILS calculation, five sets of 5000 MD frames covering entire equilibrium trajectories of trHbN in absence of free ligand were used. Details about ligand parameters used with this method are given as Supporting Material.
The impacts of free •NO molecule on the residues lining the tunnels were studied. The rotameric distribution of each residue was collected as function of the presence or absence of •NO inside respective internal cavities (Xe1, Xe2, Xe3, Xe5, and EHc). For the residues that displayed a different behavior in response to the presence of a •NO molecule, individual ILS computations were performed using a subset of 5000 representative MD snapshots (e.g., according to different rotamers). To increase sampling, MD snapshots were selected from simulations of oxy-trHbN with and without free •NO molecules. For the snapshots taken from simulations with explicit •NO, only the part of the trajectory before the first •NO entry inside the protein core was considered. If >5000 MD representative snapshots were available, a random selection was performed. The binding affinities (Kb) of the ligands were estimated from the PMF maps obtained from the ILS calculations using the relation (26,27)
| (1) |
where r represents the positions of the grid maps, β = 1/kBT, w the PMF between the ligand and the protein, and r′ is a reference position far away in the bulk. In our calculations, w(r′) was calculated as the average PMF of the ligand in a water box (more details in the Supporting Material). Unless otherwise noted, all affinity numbers given in this study refer to Kd = 1/Kb.
Results and Discussion
NO interacts with specific regions of the trHbN surface
The times of contact between •NO molecules and trHbN surface are represented in Fig. 2. This figure shows that tunnel entryways constitute discrete domains with enhanced affinity for •NO due to the hydrophobic nature of the residues at these positions. •NO capture is promoted by formation of short-lived hydrophobic cavities at the surface of trHbN, creating free solvent volumes, as presented in Fig. 3 for ST entrance. The solvent-excluded volumes arise from the energy cost related to the hydrophobic hydration (28), the excluded volume size being in relation with the enriched content of hydrophobic residues at the tunnel entrances. The favorable interactions between •NO and the hydrophobic cavities are also related to the hydrophobic hydration, leading to the association of apolar entities (28).
Figure 2.
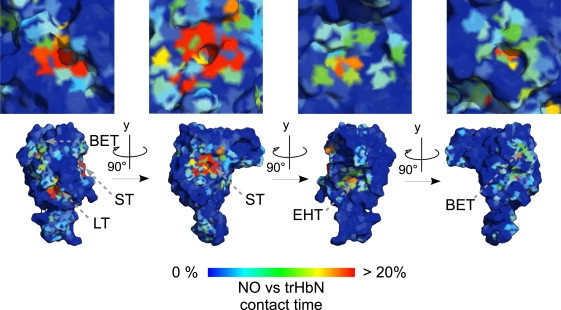
Color online only. Time of contact between •NO molecules and trHbN relative to the MD simulation time. Atom coordinates were taken from the oxygenated trHbN crystal structure (PDB entry No. 1IDR, subunit A). The entryway to the LT, EHT, ST, and BET are indicated. The picture was generated using PyMOL (39).
Figure 3.
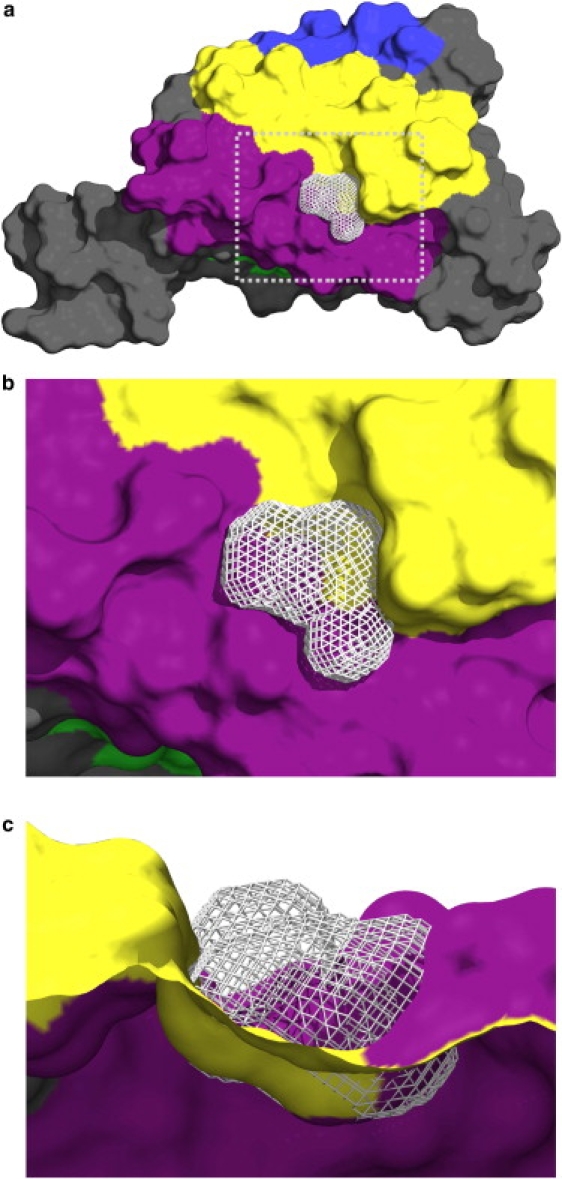
Color online only. Representative solvent-excluded volume (105 Å3) formed over the ST entrance. (a) Overall view, (b) zoomed view, and (c) side view of the solvent excluded over the funnel-shaped ST entrance. The solvent-excluded volume is represented by the gray mesh. The B, E, G, and H helices are colored in blue, green, yellow, and purple, respectively. The picture was generated using PyMOL (39).
The enhanced affinity observed at tunnel entrances is thought to be important for the capture of apolar ligands. Consequently, it is expected that entrances delimited by polar residues may result in lower affinities for apolar ligands. To verify this, a mutant was designed where the polarity near the ST, LT, and EHT entryways was increased with polar residues (see Methods).
The formation frequency and average solvent-excluded volumes are given in Table 1 for each of the entrances, for both the WT and the polar mutant. The biggest solvent-excluded volumes (average volume of 89 Å3) were observed at the ST entrance of WT in 43% of the MD snapshots (Table 1), providing enough room to host up to three •NO molecules. Smaller solvent-excluded volumes were also observed at the entrance of LT, EHT, and BET, although with a lower incidence. Because of the presence of polar residues located at the entrances, solvent-excluded volumes are much lower and less frequent for the ST entrance of the polar mutant. The effect is less significant for LT and EHT entrances due to an increased side-chain dynamics experienced by the mutated residues in the solvent, similar to what was reported in Leroux et al. (29).
Table 1.
Calculated affinities for NO and solvent-excluded volume at tunnel entrances detected for trHbN and multiple polar mutant
| Tunnel | trHbN |
Mutant |
||||
|---|---|---|---|---|---|---|
|
Kd |
Solvent-excluded volume∗ |
Kd |
Solvent-excluded volume∗ |
|||
| (mM) | (%) | (Å3) | (mM) | (%) | (Å3) | |
| Global† | 6.20 ± 0.04 (8.72 ± 0.04)‡ | 7.92 ± 0.24 (10.5 ± 0.5)‡ | ||||
| Surface | 12.3 ± 0.03 | 18.5 ± 0.3 | ||||
| ST entrance | 67.6 ± 1.1 | 43 | 89 ± 60 | 926 ± 33 | 7.8 | 45 ± 26 |
| LT entrance | 103 ± 1 | 32 | 66 ± 40 | 159 ± 10 | 25 | 61 ± 35 |
| EHT entrance | 199 ± 2 | 24 | 56 ± 38 | 196 ± 18 | 20 | 65 ± 41 |
The formation frequency and the average solvent-excluded volume detected.
Affinities are calculated for the tunnels and the surface.
Numbers in parentheses are for the calculated affinity for O2 (surface and tunnels).
The particular funnel shape of the ST entrance (Fig. 3 c), combined with its hydrophobic nature, is responsible for higher free volumes than for other tunnel entrances. To our knowledge, this is the first time that such physical characteristics at the surface of a protein are reported. We hypothesize that this physical property contributes to the high efficiency of the NOD reaction catalyzed by trHbN.
•NO enters the protein matrix using the ST, LT, and EHT
At least one •NO molecule reached the distal heme pocket (DHP) from the bulk solvent in each of the 10 simulations performed. The first •NO entry typically occurred within the first 3 ns. In agreement with the particular character of the ST entrance, the first •NO to reach the DHP came from the ST in six of ten occurrences; the LT and the EHT were used twice each. The time required to diffuse from the protein surface to the DHP ranged from hundreds of picoseconds to several nanoseconds, the shorter times being associated with the ST. The BET was not used although several short-lived contacts between •NO molecules and the BET entryway were observed, likely due to the narrow bottleneck (<1 Å) of this tunnel (14).
The greater propensity of •NO to use ST to reach DHP observed in this work is clearly in disagreement with previous modeling studies, where the authors reached the conclusion that the diffusion of •NO occurs preferentially via LT in oxy-trHbN (19). This disagreement will be addressed in the next section.
Ruscio et al. used a very similar approach to study CO entry and diffusion within Mb (30). In contrast to what was observed in this article, a CO molecule reached the active site in only one-third of the 48 90-ns trajectories. In the other cases, CO entered Mb matrix but could not reach the active site. This comparison highlights the higher efficiency of substrate diffusion from the solvent to the DHP in the trHbN matrix than in Mb. This higher efficiency is in agreement with the 15-fold (horse-heart Mb) and 34-fold (sperm-whale Mb) higher bimolecular rate constant for the NOD reaction (10,18).
Diffusion through tunnels
MD simulations showed that tunnels in trHbN are not open channels but are formed of neighboring hydrophobic cavities that are temporally interconnected due to side-chain flexibility (thermal fluctuations) (14,31). Therefore, it is expected that ligand diffusion through the different tunnels takes place by hopping from one cavity to another.
Occupancy of •NO in the protein matrix was calculated using two approaches: ILS (24), using trajectories without •NO, and the probability distributions from the trajectories with •NO (see Methods). The results are presented in Fig. 4, a and b, for the probability distributions and ILS, respectively. Interestingly, both methods show that the trHbN matrix contains cavities with high occupancy for •NO, and that most of these cavities correspond to the Xe binding sites identified by x-ray crystallography (32). In addition to Xe binding sites, the distal heme pocket and a cavity lying inside the EHT were found favorable to •NO (Fig. 4). The latter cavity is located between the EHT entrance and the side chain of the Phe62(E15) residue. The ILS isosurface maps (Fig. 4 b) confirmed that ST, LT, and EHT are the most favorable routes. Fig. 1 (bottom) shows all diffusion pathways observed from the trajectories calculated using explicit •NO. Every •NO that reached the DHP was found to transit through the Xe2 site, which is located at the intersection of the ST, LT, and EHT.
Figure 4.
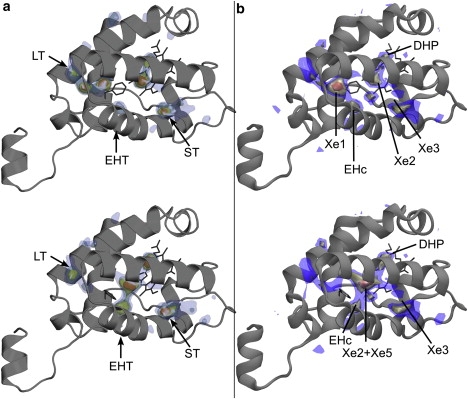
Color online only. (a) Density probability of •NO derived from explicit MD simulations and (b) implicit ligand PMF for •NO inside trHbN, calculated from MD frames having the Phe62(E15) in the (top) M state and (bottom) T state. In panel a, higher •NO probability densities are represented by colored isosurfaces. In panel b, the free energy isosurfaces correspond to regions of measured PMF of −1.5 ± 0.3 kcal/mol (blue), −2.5 ± 0.3 kcal/mol (yellow), and −3.5 ± 0.3 kcal/mol (orange), with 0 kcal/mol corresponding to ligand in vacuum. Tunnel entrances and cavities are indicated in a and b, respectively. Pictures were generated using (a) PyMOL (39) and (b) VMD (25).
The possibility that •NO molecules have local impacts on trHbN, and therefore influence its diffusion through tunnels, was investigated. Because trHbN matrix can hold more than one NO molecule at the same time, and as it is expected that substrate concentrations are relatively low in vivo, this specific study focused on the simpler cases, i.e., when only one •NO was inside trHbN. To determine the effect of local impacts, the side-chain dihedral angles of all the residues lining the tunnels were monitored in presence or absence of •NO near that residue. These residues, as well as the Xe binding sites, are sketched in Fig. 1 (bottom). Only two residues were influenced by the presence of •NO: Ile119(H11), located along the ST, between Xe2 and Xe3 sites and shaping part of the EHT; and Phe62(E15), located along the LT. The rotamers adopted in the different cases are reported in Table 2.
Table 2.
Rotamers observed for two residues upon the absence or presence of •NO molecule in specific cavities
| Residue | Rotamer | Empty | Xe1 | Xe2 | Xe3 | Xe5 | EHc |
|---|---|---|---|---|---|---|---|
| Ile119(H11) | mm | 56 | 18 | 75 | 34 | 60 | 40 |
| mt | 2 | 3 | 9 | 37 | 3 | 17 | |
| pt | 37 | 72 | 14 | 23 | 31 | 37 | |
| pp | 3 | 4 | 1 | 0 | 2 | 1 | |
| Others/outliers | 2 | 3 | 1 | 6 | 4 | 5 | |
| Phe62(E15) | m-30 | 30 | 19 | 22 | 29 | 1 | 40 |
| m-85 | 50 | 79 | 44 | 45 | 8 | 35 | |
| t80 | 15 | 0 | 25 | 13 | 75 | 13 | |
| Outliers | 5 | 2 | 9 | 13 | 16 | 12 |
In the next subsections, the diffusion process through the different tunnels is analyzed separately. The PMF profiles for each tunnel are presented in Fig. 5. Movie S1, Movie S2, and Movie S3, illustrating •NO diffusion in each of the three tunnels, extracted from the trajectories, are provided as Supporting Material.
Figure 5.
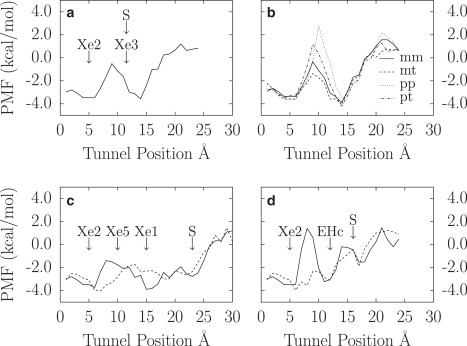
PMF profiles for •NO diffusion in ST (a) regardless of Ile119(H11) rotameres and (b) as function of different Ile119(H11) rotamers. For these ILS profiles, only 2988 and 3263 MD frames were available for the mt and pp rotamers, respectively. Smaller samplings lead to overestimated PMF (24). PMF profiles for the (c) LT and (d) EHT were calculated as functions of Phe62(E15) M state (solid line) and T state (dashed line). The letter S indicates the trHbN surface location.
Short tunnel
Diffusion through the ST begins by docking to the surface (Fig. 5 a, at ∼14 Å with a value of −3.5 ± 0.3 kcal/mol), in the funnel-shape entryway, close to Xe3. Entry is performed by transit from Xe3 to Xe2. For this process, a •NO molecule must cross a bottleneck region (radius of 1.2 Å) defined by the side chain of Ile119(H11), Leu98(G12), and the heme pyrrole B (vinyl group) (14).
MD simulations in absence of free •NO revealed that the Ile119(H11) side chain adopts four rotamers (mm, mt, pp, and pt) with various distributions (Table 2). The pp and pt rotamers are rarely found inside α-helices, whereas the mm and mt rotamers are more typical (33). In the absence of •NO, mm and pt rotamers dominate with 56% and 37% of the conformations, respectively. When a •NO is docked inside Xe2 or Xe3 (ST entrance), the mm and mt rotamers increase significantly (Table 2). Fig. 5 b shows the PMF profiles according to the Ile119(H11) rotamers. The mt and mm rotamers are found to be the most favorable for •NO diffusion inside ST, from Xe3 to Xe2, with energy barriers of 2.7 ± 0.6 kcal/mol and 3.5 ± 0.6 kcal/mol, respectively, centered at 9 Å. This result is in agreement with the trHbN crystallographic structure under high xenon pressure, where a xenon atom occupies Xe3 while Ile119(H11) displays the mt rotamer (PDB ID No. 1S56, B chain) (32). On the other hand, pt and pp rotamers are unfavorable, causing a high free energy barrier of >5 −0.8/+0.6 kcal/mol. These unfavorable free energy profiles agree with the observation of explicit •NO molecules docked for several hundreds of picoseconds while Ile119(H11) adopted pt and pp rotamers. Interestingly, when a •NO molecule docks inside Xe1 (in the LT, Fig. 1, top), the occurrence of mm rotamers decreases, accounting for 18% of the conformations, whereas it increases to 72% for pt rotamer (Table 2). This has the effect of significantly reducing diffusion through ST.
Long tunnel
Entry into the LT is performed by transition from the solvent to the Xe1 binding site. This process is unhampered and fast because of the wide LT entrance. This is in agreement with our earlier report on trHbN tunnels dynamics, where the LT was found to display the widest entrance with an average aperture of ∼1.8 Å radius (14).
To reach Xe2 from Xe1, a •NO molecule must transit by the Xe5 binding site (Fig. 1, bottom). However, the tunnel radius at the Xe5 binding site is quite narrow due to the side chains of Val29(B6), Phe62(E15), and Leu98(G12) residues so that rotation of the Phe62(E15) phenyl ring (fluctuation of the χ2 dihedral angle) is required. Before the arrival of •NO, as observed in a previous work (14), the Phe62(E15) side chain explores two χ1 domains (sweeping motion) while a wide range of values is allowed for χ2. The two χ1 domains were referred as the M and T states. The M state regroups two rotameric species, m-85 and m-30, whereas the T state is mainly characterized by the t80 rotamer. In this rotameric nomenclature, m stands for gauche negative and t for trans (33). The phenyl ring fills Xe1 when in T state, while for the M state, it is located between Xe5, Xe2, and EHc cavities. The radius of the LT (and EHT), and consequently their opening, is determined by χ2 (see Fig. 9 of (14).).
The impact of •NO on the side-chain dynamics of Phe62(E15) is represented in Fig. 6 and the rotamers observed for the different cases are reported in Table 2. When a •NO molecule occupies Xe1, the Phe62(E15) side chain is almost limited to the M state (98% of occupancy) and χ2 is restricted to a narrower range: [−90°:−60°] and [80°:90°] (χ2 ranges from −90° to 90° by convention) (Fig. 6). This range corresponds to the maximum radii for LT (∼1.3 Å), while EHT radius is at a minimum (∼1.0 Å) (14). Therefore, LT would be in the open state with this configuration, in agreement with the observation of the passage of one •NO to Xe5 (more on this in the next paragraph). Similarly, when a •NO occupies Xe5, the Phe62(E15) side chain is almost limited to the T state (86.3% of occupancy, the T state has a broader definition than the t80 rotamer, which has a limited χ2 range), and χ2 is restricted to the range [20°:75°]. This range of conformations corresponds to a radius between 0.9 Å and 1.1 Å, similar to the BET average radius where no diffusion was observed. In fact, no diffusion of •NO from Xe5 to Xe1 was observed via the Phe62(E15) barrier. We conclude that LT was closed in this conformation. Instead, •NO can escape via EHT to Xe1 (more on this in the next subsection).
Figure 6.
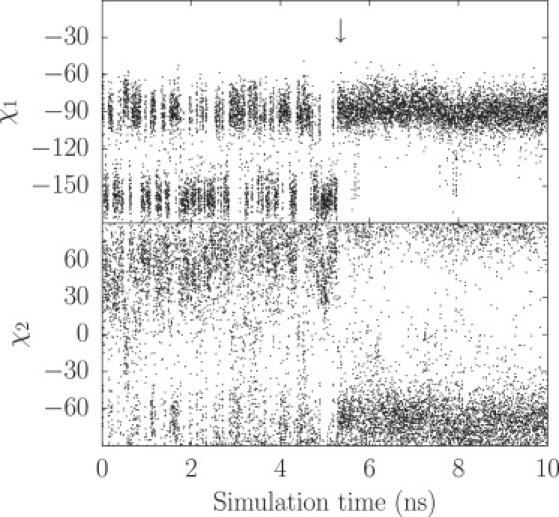
Phe62(E15) χ1 and χ2 dihedral angles as function of the simulation time. The arrow, at t ≈ 5.3 ns, indicates the entry of one •NO molecule in LT. This •NO diffused quickly from the protein surface to the Xe1 binding site, where it stayed for the remaining of the trajectory.
Because •NO has significant effects on Phe62(E15) dynamics, PMF profiles were calculated when Phe62(E15) is either in the M or the T state. The PMF profiles are given in Fig. 5 c. For both M and T states, the entry is found favorable for docking of •NO, as reported in a previous section, with a docking free energy of −2.7 ± 0.3 kcal/mol. For the M state (Fig. 5 c, solid line), the PMF profile revealed that the Xe1 and Xe2 binding sites are favorable to •NO, with docking free energies of −3.7 ± 0.3 kcal/mol and −3.6 ± 0.3 kcal/mol, respectively. This is reflected in the high probability of finding •NO at these positions in explicit simulations (Fig. 4 a). To diffuse from Xe1 to Xe2 in the LT, a •NO molecule must overcome a free energy barrier of 3.2 ± 0.6 kcal/mol, indicating that •NO molecules seldom cross the Phe62(E15) side chain. Only one event was observed over the 200 ns of trajectories. This energy barrier comes from the steric encumbrance of Phe62(E15), which has to change its conformation at the time of the transit between Xe1 and Xe5 to accommodate a •NO at Xe5. Many events were observed where a •NO tried to transit from Xe1 to Xe5 but came back to Xe1. For the T state, the PMF profile is inverted, showing a maximum free energy level in the tunnel of −1.7 ± 0.3 kcal/mol near Xe1 while the most favorable region is found between Xe5 and Xe2, with a potential well of −4.0 ± 0.3 kcal/mol. Even if the free energy barrier is lower by 2.1 ± 0.6 kcal/mol, this path was not used by •NO because Phe62(E15) quickly returns to M state as a •NO enters the LT. Due to the high energy barriers involved for the path Xe1-Xe5-Xe2, the path via EHT (Xe1-EHC-Xe2) was used more frequently. This path is presented in the next subsection.
EH tunnel
As for the LT, two PMF profiles were calculated according to the Phe62(E15) conformation. The PMF profiles are given in Fig. 5 d.
For this tunnel, •NO diffuses from the bulk solvent to an internal cavity (EHc) (Fig. 1, bottom), which does not correspond to any identified Xe binding site. This cavity is located between the EHT entrance and the side chain of the Phe62(E15) residue. To reach EHc from the bulk, a •NO must cross a bottleneck region of 1.3 Å radius at the protein surface.
As for the LT, EHT shows two different PMF profiles according to the Phe62(E15) conformation. For both PMF profiles, the first few Å between the protein surface and the EHc do not differ (Fig. 5 d). The EHc was found favorable to •NO, with a free energy of −3.1 ± 0.3 kcal/mol (≈−4.5 ± 0.3 kcal/mol from the solvent), and no escape of •NO to the solvent was observed. When EHc is filled with a •NO, the Phe62(E15) side chain fluctuates between M and T states, with a prevalence for the M state. When Phe62(E15) is in T state, there is no barrier between EHc and Xe2, and frequent exchanges between these sites were observed from the trajectories (Fig. 1, bottom, blue arrow). In contrast, when Phe62(E15) is in the M state, the PMF profile shows an energy barrier of 4.0 ± 0.6 kcal/mol. In this case, frequent exchanges between Xe1 (located in LT) and EHc are observed (Fig. 1, bottom, yellow arrow), although a small free energy barrier of 1.5 ± 0.6 kcal/mol (relative to EHc) exists between the two sites (data not shown).
DHP
Once a •NO reaches the DHP, it remains at contact distance with the bound O2 and Val94(G8) side chain for up to hundreds of picoseconds before returning to Xe2. Since the energy barrier between these two sites is low (0.8 ± 0.6 kcal/mol), frequent Xe2 ↔ DHP transitions were observed. The presence of •NO in the DHP does not trigger motions or reorganization of nearby side chains.
Ligand binding affinities
The binding affinities for •NO and O2 ligands were estimated from the PMF maps obtained from the ILS calculations (see Methods). The affinities were calculated for the whole protein (global affinities) and for the entrances at the surface of the protein, for both WT and the polar mutant. The results are presented in Table 1. WT global affinities for •NO and O2 were evaluated as 6.20 ± 0.04 mM and 8.72 ± 0.04 mM, respectively. It is noteworthy that the high precision estimated for the ligand affinities arises from the methodology used and does not account for the error due to the imprecision of the force field and the tendency of MD simulations to undersample. Under identical experimental conditions, •NO affinity may always be 25–75% greater than for O2 for the same conditions due to the chemical nature of the ligands, the Van der Waals interactions being more significant for •NO. It is expected that the affinities of free ligands should be similar for deoxy-trHbN. The affinity of the heme-iron for the ligands was not calculated in this work. However, a much larger affinity for O2 arises upon binding to the heme-iron. A change in its chemical character upon binding leads to a stabilization of the Fe-O2 complex by Tyr33(B10) (10). In vivo, ligand concentration in activated macrophages are believed to be low (∼1 μM) (34), suggesting that tunnels may be free of ligand at equilibrium. However, such affinity increases the chances by >73 times to find a •NO molecule bound to trHbN compared to the solvent.
As expected from times of contact (Fig. 2), •NO occupancies and ILS results (Fig. 4), the affinities presented in Table 1 also reveal that the entrances are favorable to •NO (see also Fig. S1 in the Supporting Material). Quantitatively, ST entrance has the highest affinity (Kb), accounting for as much as the affinities of LT and EHT taken together. The gradient of affinity of ST entrance extends far from the tunnel entrance and covers a large area (Fig. S1). This large area may play an important role by trapping •NO molecule and thus increasing the use of ST.
Binding affinities for the WT and the polar mutant are compared in Table 1. The global affinity of the mutant for •NO is only slightly lower than for the WT because the tunnels, unchanged in the mutant, account for ∼50% of the global affinity. The biggest differences are observed for the ST entrance, where the affinity of the mutant is >13 times lower than for the WT (67.6 ± 1.1 mM for the WT, and 926 ± 33 mM for the mutant). Since the affinity of the ST entrance of the mutant is greatly reduced we predict that ST should be almost unused by apolar ligands to reach the DHP.
On the other side, the affinity of LT entrance was modestly lowered while EHT entrance affinity was mostly unchanged. The limited decrease of affinity observed for the LT entrance is because the entrance is defined by backbone residues from AB and GH hinges. As a consequence, substitution of a side chain can only partially affect the character of the entrance. Similarly, the unchanged affinity of the mutant EHT entrance is due to the Asp118(H10) side chain that moved toward the solvent, triggering enlargement of the tunnel entrance. The move toward the solvent of a mutated residue at the entrance of a tunnel, leading to a limited change in protein kinetics, was also observed for a NiFe hydrogenase (29).
Despite a dramatic ST entrance affinity decrease observed for the mutant, we predict only a twofold reduced NOD activity. Effectively, the almost unchanged affinities of the LT and EHT entrances, accounting for as much as the ST entrance of the WT, would continue to supply the active site with apolar ligands. This example illustrates the complexity to plan efficient mutagenesis of a protein containing multiple tunnels, as in Johnson et al. (35).
Comparison of the different paths
The free energy difference between the solvent and the DHP is ∼4.5 ± 0.3 kcal/mol in favor of DHP. When the tunnels are compared between each other, the ST has the biggest solvent-excluded volume at its entrance, the lowest energy barrier, and also the shortest distance to reach the DHP. Therefore, it is natural that this tunnel is the most used by •NO to reach DHP, as observed from explicit simulations.
However, one should not neglect the LT/EHT in their capacity to supply ligands to the active site. Effectively, their numerous binding sites can accommodate up to three ligands, which can reach DHP at the appropriate time.
As in our previous study of trHbN tunnels (14), the results presented here disagree with the results reported by Bidon-Chanal et al. (19). Effectively, using steered MD, they came to the conclusion that LT is the most favorable diffusion pathway for •NO to reach DHP. In this study, the high energy barrier near the Phe62(E15) side chain explains why LT is rarely used by •NO to reach DHP. Bidon-Chanal et al. did not take into account the more favorable EHT pathway for •NO diffusion to the DHP. In addition, Bidon-Chanal et al. observed a progressive rise in free energy for the migration of •NO through ST, making it less suitable than LT (surprisingly, their PMF values for ST near the DHP indicate that this position is less favorable to •NO than in the solvent). This result is clearly in disagreement with the results obtained using two different approaches (explicit MD simulations and ILS) in this work. Moreover, our MD simulations with explicit NO molecules clearly showed that LT and ST merge at the Xe2 binding site with the same binding energy, which is not the case in the work of Bidon-Chanal et al. Both MD and ILS approaches identified the ST as the most favorable route for •NO to reach oxy-trHbN DHP. This is explained by the presence of the funnel-shape hydrophobic entrance of the ST, the shorter diffusion length, and the lowest energy barrier experienced by •NO.
It is interesting to note that the diffusion of •NO from the solvent to EHc, Xe1, or Xe2 involves a decrease in free energy of ∼4.5 ± 0.3 kcal/mol. Such an energy value ensures efficient capture of •NO in trHbN matrix, preventing the release to the solvent. Over the 200 ns of trajectories, only two such events involving a single •NO was observed and proceeded through the ST (events involving multiple •NO, energetically more complex, were observed but will not be reported in this study). We propose that this efficient capture of •NO by trHbN is related to its high NOD catalytic.
There are few other resolved group I trHb structures from the protozoan Paramecium caudatum (pc-trHbN–PDB 1DLW), the unicellular alga Chlamydomonas eugametos (ce-trHbN–PDB 1DLY), and the cyanobacterium Synechocystis sp. (ss-trHbN–PDB 1S69). All these structures display significant internal empty volumes (pc-trHbN: 180 Å3, ce-trHbN: 400 Å3, and mt-trHbN: 265 Å3) defined by hydrophobic residues (32). The hydrophobic character of these residues is conserved (36). On the other hand, the hydrophobic nature of the residues lining the tunnel entrances is not as well conserved between the different trHbNs. The free volume present in trHbNs structure is organized into two tunnels corresponding to the LT and EHT. In addition, ce-trHbN accommodates a large hydrophobic funnel-shaped surface at the ST entrance, suggesting that this tunnel may be functional. Three additional diffusion routes were found from modeling studies of pc-trHbN: between helices B and G; between helices B and E; and between the heme and helix C (37). TrHbs from groups II and III do not display tunnels. These observations suggest that the redundancy in access ways in trHbN is an evolved feature of the group I trHb.
Finally, during the review process, an article bearing on •NO diffusion in trHbN was published by Mishra and Meuwly (38). This study is based on multiple 2-ns MD simulations of trHbN with one •NO starting in different cavities (total of 24 2-ns trajectories). Some important differences arise from both works. First, unlike our work, they observed many escapes of •NO to the solvent and rare •NO captures from trHbN, which is surprising given the energy difference of ∼4.5 kcal/mol in favor of the protein matrix observed in this work. Second, they observed •NO diffusion from Xe2 to the solvent, through helices C and H, and did not observe diffusion through the EHT. Finally, the heme force field parameters are not convenient for simulations of oxygenated hemoprotein, favoring unlikely conformation of DHP residues as well as Phe62(E15) (14). Substantial methodological differences between the works could explain these discrepancies.
Conclusion
The simulations presented here show that substrate diffusion in trHbN follows discrete paths showing enhanced affinity for apolar gaseous ligands. Diffusion toward the trHbN active site (DHP) begins with favorable hydrophobic interactions at the protein surface, corresponding to tunnel entryways. The strongly hydrophobic funnel-shape entrance of ST makes it the most favorable tunnel in trHbN. This funnel constitutes a discrete surface domain with enhanced affinity for •NO. •NO capture is promoted by formation of short-lived hydrophobic cavities at the protein surface, creating free solvent volumes sufficient to host up to three •NO molecules simultaneously. These molecules, once captured, do not escape and enter the ST. Once inside the protein, •NO diffuses from one cavity to another. Most of these cavities correspond to experimental xenon binding pockets (32). When docked inside specific cavities (Xe1, Xe2, Xe3, and Xe5), •NO was found to affect the dynamics of Phe62(E15) and Ile119(H11) residues in LT and ST, respectively. In contrast to what was observed in Bidon-Chanal et al. (19), •NO diffusion in the LT was found to be hindered by the Phe62(E15) side-chain obstruction, refuting the dual-path mechanism proposed by Bidon-Chanal et al. (19). Moreover, •NO entering the LT preferentially bypasses the Phe62(E15) barrier by passing through EHT. Our results suggest that these paths would be better suited to provide substrates to the active site once the reaction cycles have begun.
Our MD simulations suggest that •NO diffusion between the trHbN surface and the active site is fast. In all 10 simulations performed, a •NO molecule reached the distal heme pocket within 20 ns. This contrasts with a similar earlier work using Mb that required more simulations and longer trajectories to study a similar process (30). This is in accord with the fact that the bimolecular rate constant for the NOD reaction catalyzed by trHbN is ∼15-fold higher than that of horse myoglobin (10).
Supporting Material
Three movies, one figure, and two tables are available at http://www.biophysj.org/biophysj/supplemental/S0006-3495(09)01450-7.
Supporting Material
Acknowledgments
The authors thank Beatrice A. Wittenberg and Jonathan B. Wittenberg for helpful discussion.
This work was supported by the Natural Sciences and Engineering Research Council of Canada (grant No. 46306-01 (2005–2010)), the Fonds Québécois de la Recherche sur la Nature et les Technologies (grant No. 104897), and the Canada Foundation for Innovation (grant No. 12428). R.D. is supported by a postgraduate scholarship from the Fonds Québécois de la Recherche sur la Nature et les Technologies (scholarship No. 106627).
References
- 1.Brunori M. Nitric oxide, cytochrome-c oxidase and myoglobin. Trends Biochem. Sci. 2001;26:21–23. doi: 10.1016/s0968-0004(00)01698-4. [DOI] [PubMed] [Google Scholar]
- 2.Brunori M., Giuffre A., Sarti P., Stubauer G., Wilson M.T. Nitric oxide and cellular respiration. Cell. Mol. Life Sci. 1999;56:549–557. doi: 10.1007/s000180050452. [DOI] [PMC free article] [PubMed] [Google Scholar]
- 3.Stevanin T.M., Ioannidis N., Mills C.E., Kim S.O., Hughes M.N. Flavohemoglobin hmp affords inducible protection for Escherichia coli respiration, catalyzed by cytochromes bo' or bd, from nitric oxide. J. Biol. Chem. 2000;275:35868–35875. doi: 10.1074/jbc.M002471200. [DOI] [PubMed] [Google Scholar]
- 4.Cleeter M.W.J., Cooper J.M., Darleyusmar V.M., Moncada S., Schapira A.H.V. Reversible inhibition of cytochrome-c oxidase, the terminal enzyme of the mitochondrial respiratory-chain, by nitric-oxide—implications for the neurodegenerative diseases. FEBS Lett. 1994;345:50–54. doi: 10.1016/0014-5793(94)00424-2. [DOI] [PubMed] [Google Scholar]
- 5.Brown G.C., Cooper C.E. Nanomolar concentrations of nitric-oxide reversibly inhibit synaptosomal respiration by competing with oxygen at cytochrome-oxidase. FEBS Lett. 1994;356:295–298. doi: 10.1016/0014-5793(94)01290-3. [DOI] [PubMed] [Google Scholar]
- 6.Gardner P.R., Costantino G., Salzman A.L. Constitutive and adaptive detoxification of nitric oxide in Escherichia coli—role of nitric-oxide dioxygenase in the protection of aconitase. J. Biol. Chem. 1998;273:26528–26533. doi: 10.1074/jbc.273.41.26528. [DOI] [PubMed] [Google Scholar]
- 7.Gardner P.R., Costantino G., Szabo C., Salzman A.L. Nitric oxide sensitivity of the aconitases. J. Biol. Chem. 1997;272:25071–25076. doi: 10.1074/jbc.272.40.25071. [DOI] [PubMed] [Google Scholar]
- 8.Kissner R., Nauser T., Bugnon P., Lye P.G., Koppenol W.H. Formation and properties of peroxynitrite as studied by laser flash photolysis, high-pressure stopped-flow technique, and pulse radiolysis. Chem. Res. Toxicol. 1997;10:1285–1292. doi: 10.1021/tx970160x. [DOI] [PubMed] [Google Scholar]
- 9.Pfeiffer S., Gorren A.C.F., Schmidt K., Werner E.R., Hansert B. Metabolic fate of peroxynitrite in aqueous solution—reaction with nitric oxide and pH-dependent decomposition to nitrite and oxygen in a 2:1 stoichiometry. J. Biol. Chem. 1997;272:3465–3470. doi: 10.1074/jbc.272.6.3465. [DOI] [PubMed] [Google Scholar]
- 10.Ouellet H., Ouellet Y., Richard C., Labarre M., Wittenberg B. Truncated hemoglobin HbN protects Mycobacterium bovis from nitric oxide. Proc. Natl. Acad. Sci. USA. 2002;99:5902–5907. doi: 10.1073/pnas.092017799. [DOI] [PMC free article] [PubMed] [Google Scholar]
- 11.Pawaria S., Lama A., Raje M., Dikshit K.L. Responses of Mycobacterium tuberculosis hemoglobin promoters to in vitro and in vivo growth conditions. Appl. Environ. Microbiol. 2008;74:3512–3522. doi: 10.1128/AEM.02663-07. [DOI] [PMC free article] [PubMed] [Google Scholar]
- 12.Pawaria S., Rajamohan G., Gambhir V., Lama A., Varshney G.C. Intracellular growth and survival of Salmonella enterica serovar Typhimurium carrying truncated hemoglobins of Mycobacterium tuberculosis. Microb. Pathog. 2007;42:119–128. doi: 10.1016/j.micpath.2006.12.001. [DOI] [PubMed] [Google Scholar]
- 13.Milani M., Pesce A., Ouellet Y., Ascenzi P., Guertin M. Mycobacterium tuberculosis hemoglobin N displays a protein tunnel suited for O2 diffusion to the heme. EMBO J. 2001;20:3902–3909. doi: 10.1093/emboj/20.15.3902. [DOI] [PMC free article] [PubMed] [Google Scholar]
- 14.Daigle R., Guertin M., Lague P. Structural characterization of the tunnels of Mycobacterium tuberculosis truncated hemoglobin N from molecular dynamics simulations. Proteins: Struct. Funct. Bioinf. 2009;75:735–747. doi: 10.1002/prot.22283. [DOI] [PubMed] [Google Scholar]
- 15.Samuni U., Dantsker D., Ray A., Wittenberg J.B., Wittenberg B.A. Kinetic modulation in carbonmonoxy derivatives of truncated hemoglobins: the role of distal heme pocket residues and extended apolar tunnel. J. Biol. Chem. 2003;278:27241–27250. doi: 10.1074/jbc.M212634200. [DOI] [PubMed] [Google Scholar]
- 16.Crespo A., Marti M.A., Kalko S.G., Morreale A., Orozco M. Theoretical study of the truncated hemoglobin HbN: exploring the molecular basis of the NO detoxification mechanism. J. Am. Chem. Soc. 2005;127:4433–4444. doi: 10.1021/ja0450004. [DOI] [PubMed] [Google Scholar]
- 17.Ouellet Y., Milani M., Couture M., Bolognesi M., Guertin M. Ligand interactions in the distal heme pocket of Mycobacterium tuberculosis truncated hemoglobin N: roles of TyrB10 and GlnE11 residues. Biochemistry. 2006;45:8770–8781. doi: 10.1021/bi060112o. [DOI] [PubMed] [Google Scholar]
- 18.Scott E.E., Gibson Q.H., Olson J.S. Mapping the pathways for O2 entry into and exit from myoglobin. J. Biol. Chem. 2001;276:5177–5188. doi: 10.1074/jbc.M008282200. [DOI] [PubMed] [Google Scholar]
- 19.Bidon-Chanal A., Marti M.A., Crespo A., Milani M., Orozco M. Ligand-induced dynamical regulation of NO conversion in Mycobacterium tuberculosis truncated hemoglobin-N. Proteins. 2006;64:457–464. doi: 10.1002/prot.21004. [DOI] [PubMed] [Google Scholar]
- 20.Brooks B.R., Bruccoleri R.E., Olafson B.D., States D.J., Swaminathan S. CHARMM: a program for macromolecular energy, minimization, and dynamics calculations. J. Comput. Chem. 1983;4:187–217. [Google Scholar]
- 21.MacKerell A.D., Bashford D., Bellott M., Dunbrack R.L., Evanseck J.D. All-atom empirical potential for molecular modeling and dynamics studies of proteins. J. Phys. Chem. B. 1998;102:3586–3616. doi: 10.1021/jp973084f. [DOI] [PubMed] [Google Scholar]
- 22.Phillips J.C., Braun R., Wang W., Gumbart J., Tajkhorshid E. Scalable molecular dynamics with NAMD. J. Comput. Chem. 2005;26:1781–1802. doi: 10.1002/jcc.20289. [DOI] [PMC free article] [PubMed] [Google Scholar]
- 23.Kleywegt G.J., Jones T.A. Detection, delineation, measurement and display of cavities in macromolecular structures. Acta Crystallogr. D Biol. Crystallogr. 1994;50:178–185. doi: 10.1107/S0907444993011333. [DOI] [PubMed] [Google Scholar]
- 24.Cohen J., Arkhipov A., Braun R., Schulten K. Imaging the migration pathways for O2, CO, NO, and Xe inside myoglobin. Biophys. J. 2006;91:1844–1857. doi: 10.1529/biophysj.106.085746. [DOI] [PMC free article] [PubMed] [Google Scholar]
- 25.Humphrey W., Dalke A., Schulten K. VMD—visual molecular dynamics. J. Mol. Graph. 1996;14:33–38. doi: 10.1016/0263-7855(96)00018-5. [DOI] [PubMed] [Google Scholar]
- 26.Chandler D., Pratt L.R. Statistical mechanics of chemical equilibria and intramolecular structures of nonrigid molecules in condensed phases. J. Chem. Phys. 1976;65:2925–2940. [Google Scholar]
- 27.Roux B., Simonson T. Implicit solvent models. Biophys. Chem. 1999;78:1–20. doi: 10.1016/s0301-4622(98)00226-9. [DOI] [PubMed] [Google Scholar]
- 28.Hummer G., Garde S., García A.E., Pohorille A., Pratt L.R. An information theory model of hydrophobic interactions. Proc. Natl. Acad. Sci. USA. 1996;93:8951–8955. doi: 10.1073/pnas.93.17.8951. [DOI] [PMC free article] [PubMed] [Google Scholar]
- 29.Leroux F., Dementin S., Burlat B., Cournac L., Volbeda A. Experimental approaches to kinetics of gas diffusion in hydrogenase. Proc. Natl. Acad. Sci. USA. 2008;105:11188–11193. doi: 10.1073/pnas.0803689105. [DOI] [PMC free article] [PubMed] [Google Scholar]
- 30.Ruscio J.Z., Kumar D., Shukla M., Prisant M.G., Murali T.M. Atomic level computational identification of ligand migration pathways between solvent and binding site in myoglobin. Proc. Natl. Acad. Sci. USA. 2008;105:9204–9209. doi: 10.1073/pnas.0710825105. [DOI] [PMC free article] [PubMed] [Google Scholar]
- 31.Saam J., Ivanov I., Walther M., Holzhütter H.-G., Kuhn H. Molecular dioxygen enters the active site of 12/15-lipoxygenase via dynamic oxygen access channels. Proc. Natl. Acad. Sci. USA. 2007;104:13319–13324. doi: 10.1073/pnas.0702401104. [DOI] [PMC free article] [PubMed] [Google Scholar]
- 32.Milani M., Pesce A., Ouellet Y., Dewilde S., Friedman J. Heme-ligand tunneling in group I truncated hemoglobins. J. Biol. Chem. 2004;279:21520–21525. doi: 10.1074/jbc.M401320200. [DOI] [PubMed] [Google Scholar]
- 33.Lovell S.C., Word J.M., Richardson J.S., Richardson D.C. The penultimate rotamer library. Proteins. 2000;40:389–408. [PubMed] [Google Scholar]
- 34.Lewis R.S., Tamir S., Tannenbaum S.R., Deen W.M. Kinetic analysis of the fate of nitric oxide synthesized by macrophages in vitro. J. Biol. Chem. 1995;270:29350–29355. doi: 10.1074/jbc.270.49.29350. [DOI] [PubMed] [Google Scholar]
- 35.Johnson B.J., Cohen J., Welford R.W., Pearson A.R., Schulten K. Exploring molecular oxygen pathways in Hansenula polymorpha copper-containing amine oxidase. J. Biol. Chem. 2007;282:17767–17776. doi: 10.1074/jbc.M701308200. [DOI] [PMC free article] [PubMed] [Google Scholar]
- 36.Vuletich D.A., Lecomte J.T.J. A phylogenetic and structural analysis of truncated hemoglobins. J. Mol. Evol. 2006;62:196–210. doi: 10.1007/s00239-005-0077-4. [DOI] [PubMed] [Google Scholar]
- 37.Cohen J., Olsen K.W., Schulten K. Finding gas migration pathways in proteins using implicit ligand sampling. Methods Enzymol. 2008;487:439–457. doi: 10.1016/S0076-6879(07)37022-5. [DOI] [PubMed] [Google Scholar]
- 38.Mishra S., Meuwly M. Nitric oxide dynamics in truncated hemoglobin: docking sites, migration pathways, and vibrational spectroscopy from molecular dynamics simulations. Biophys. J. 2009;96:2105–2108. doi: 10.1016/j.bpj.2008.11.066. [DOI] [PMC free article] [PubMed] [Google Scholar]
- 39.DeLano, W.L. 2002. The PyMOL Molecular Graphics System. http://www.pymol.org.
Associated Data
This section collects any data citations, data availability statements, or supplementary materials included in this article.