Abstract
Recently there has been significant interest and progress in the study of spatiotemporal dynamics of Ca2+ that triggers exocytosis at a fast chemical synapse, which requires understanding the contribution of individual calcium channels to the release of a single vesicle. Experimental protocols provide insight into this question by probing the sensitivity of exocytosis to Ca2+ influx. While varying extracellular or intracellular Ca2+ concentration assesses the intrinsic biochemical Ca2+ cooperativity of neurotransmitter release, varying the number of open Ca2+ channels using pharmacological channel block or the tail current titration probes the cooperativity between individual Ca2+ channels in triggering exocytosis. Despite the wide use of these Ca2+ sensitivity measurements, their interpretation often relies on heuristic arguments. Here we provide a detailed analysis of the Ca2+ sensitivity measures probed by these experimental protocols, present simple expressions for special cases, and demonstrate the distinction between the Ca2+ current cooperativity, defined by the relationship between exocytosis rate and the whole-terminal Ca2+ current magnitude, and the underlying Ca2+ channel cooperativity, defined as the average number of channels involved in the release of a single vesicle. We find simple algebraic expressions that show that the two are different but linearly related. Further, we use three-dimensional computational modeling of buffered Ca2+ diffusion to analyze these distinct Ca2+ cooperativity measures, and demonstrate the role of endogenous Ca2+ buffers on such measures. We show that buffers can either increase or decrease the Ca2+ current cooperativity of exocytosis, depending on their concentration and the single-channel Ca2+ current.
Introduction
An important open question in the understanding of neurotransmitter vesicle exocytosis is the degree to which individual Ca2+ channels cooperate during exocytosis of a single vesicle at a given synaptic terminal. This question is referred to as the domain overlap problem (Schneggenburger and Neher, 2005), and has been addressed using an extension of the method commonly used to dissect the Ca2+ sensitivity of exocytosis. When Ca2+ concentration at the release site [Ca2+]Int is varied directly using caged-Ca2+ compounds (Bollmann et al., 2000; Schneggenburger and Neher, 2000; Beutner et al., 2001), or more indirectly by changing the extracellular [Ca2+] (Dodge and Rahamimoff, 1967), the resulting relationship between exocytosis rate R and [Ca2+]int is an indication of intrinsic biochemical Ca2+ sensitivity of exocytosis. This relationship is usually fit to a power function, R ∼ ([Ca2+]int)n, and the empirical value of the exponent n is referred to as the biochemical Ca2+ cooperativity of neurotransmitter release and interpreted as a lower bound on the number of Ca2+ ion binding events involved in exocytosis. However, a different relationship between exocytosis rate and Ca2+ is obtained when Ca2+ influx is varied by a pharmacological block of a subset of available Ca2+ channels (Mintz et al., 1995; Wu et al., 1999), or by titrating the number of open channels using the tail current protocol (Stanley, 1997). The effect of such manipulations is very nonuniform across the channel population: the influx of Ca2+ through nonblocked channels is left unaffected, while the influx through blocked channels is decreased to zero. As the number of blocked channels is increased, the resulting scaling relationship between exocytosis rate and the total Ca2+ influx can again be approximated by a power law, R ∼ (ICa)m. Importantly, the Ca2+ current cooperativity m is not equal to the biochemical Ca2+ cooperativity n, since it is strongly affected by the degree of domain overlap, and probes the geometric arrangement of channels at the exocytosis site (Zucker and Fogelson, 1986; Mintz et al., 1995; Bertram et al., 1999; Wu et al., 1999; Gentile and Stanley, 2005).
Despite the wide use of this Ca2+ current cooperativity analysis, most studies rely on heuristic arguments to interpret the resulting data, and to date only a few modeling studies have analyzed this experimental protocol, the Monte Carlo studies of Shahrezaei et al. (2006) and Luo et al. (2008), and the studies of Zucker and Fogelson (1986), Bertram et al. (1999), and Meinrenken et al. (2003) that relied on deterministic solutions to the mass-action buffered Ca2+ diffusion equations. Here we extend the work of Bertram et al. (1999), and show that a careful reexamination of the problem reveals an interesting distinction and nontrivial relationships between the Ca2+ current cooperativity mICa and the underlying channel cooperativity, mCH, defined as the number of channels involved in the exocytosis of a single vesicle. Further, we use simulations of buffered Ca2+ diffusion, rather than approximations used by Bertram et al. (1999), to explore in more detail the influence of Ca2+ buffers on the Ca2+ channel and current cooperativities of exocytosis.
Materials and Methods
Equations describing buffered diffusion of Ca2+.
Results in Figures 1 and 7–11 involve deterministic three-dimensional (3D) simulations of buffered Ca2+ diffusion. We assume that the binding of Ca2+ to the endogenous buffers is described by simple mass action kinetics with one-to-one stoichiometry:
 |
where kon and koff are, respectively, the binding and the unbinding rates of the Ca2+ buffer, B.
Figure 1.
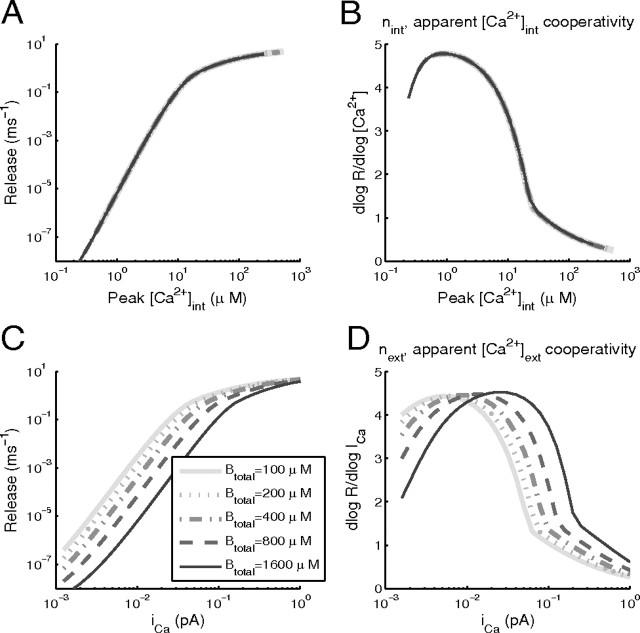
Effect of Ca2+ buffering on the apparent Ca2+ cooperativity of exocytosis assessed by varying Ca2+ influx, iCa. 3D simulations of buffered Ca2+ diffusion were performed in a cubic 1 μm3 enclosure, with a single Ca2+ source of varying strength, in the presence of a single Ca2+ buffer (DB = 50 μm2/s, KD = 1 μm, kon = 0.7 μm−1 ms−1) of different concentrations, Btotal. The release scheme (Eq. 4) is driven by [Ca2+] at a distance of 28 nm from the Ca2+ source. In A, peak release is plotted against the peak [Ca2+] at the release site (28 nm from the channel mouth). B, The slope of the log-log data in A, representing the apparent cooperativity of exocytosis with respect to peak [Ca2+]. Note the lack of sensitivity to the total buffer concentration, Btotal (curves corresponding to different Btotal values overlap in A and B). C, Release as a function of the Ca2+ current magnitude, iCa. D, The log-log slope of the relationship between peak release rate and iCa. Note that the apparent cooperativity with respect to iCa (next) can vary greatly, depending on the buffer concentration.
Figure 7.
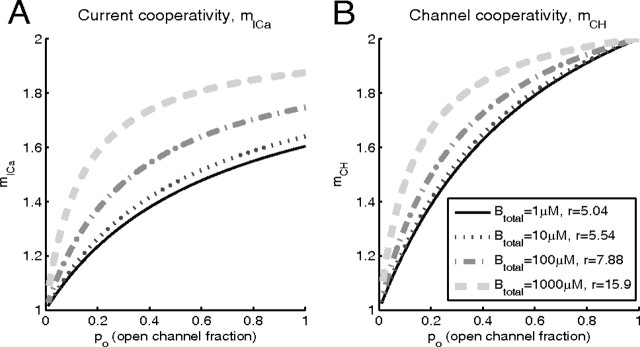
A, B, Dependence of mICa and mCH on the open channel probability for different values of total buffer concentration, in the idealized case of two equidistant channels. Total current is 0.05 pA, and the distance from the two channels to the release site is 20 nm.
Figure 8.
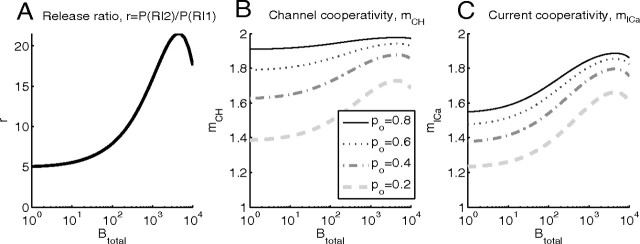
A–C, Dependence of release ratio, mICa, and mCH on the total buffer concentration in the case of two equidistant channels. Simulation parameters as in Figure 7: total current is 0.05 pA and the distance from the two channels to the release site is 20 nm.
Figure 9.
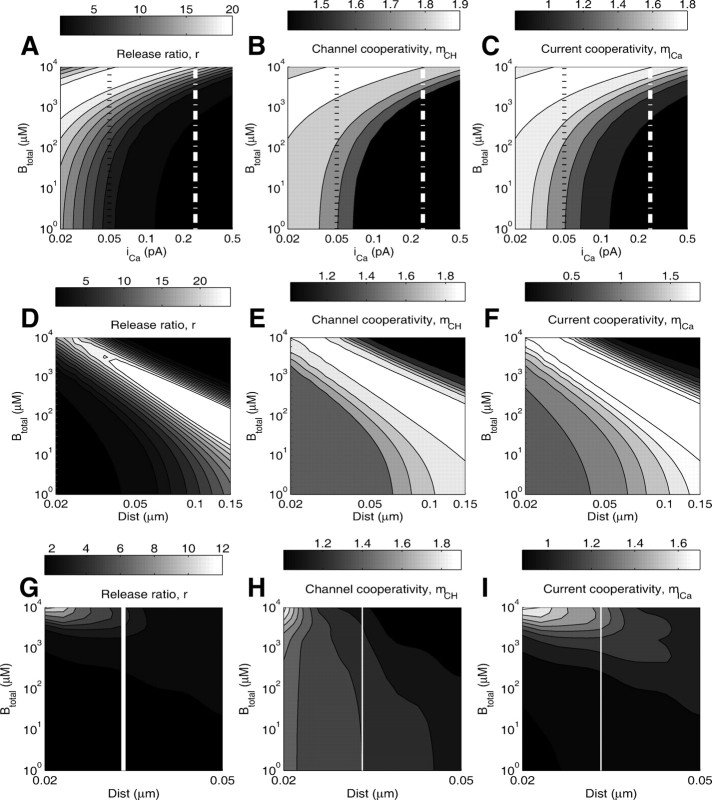
Dependence of Ca2+ channel and current cooperativities on single-channel Ca2+ current, buffer concentration, and distance, at po = 0.5 open channel fraction. The top row of panels shows the dependence of the release ratio (A), mCH (B), and mICa (C) on the total buffer concentration and the single-channel Ca2+ current, with two channels at 20 nm from the exocytosis site. This distance is varied in the middle row of panels, which examine the dependence of the release ratio (D), mCH (E), and mICa (F) on the total buffer concentration and the distance from each channel to the release site, for a fixed single-channel current of iCa = 0.25 pA. Thus, the white line in the top panel at iCa = 0.25 pA corresponds to the left edge of the respective plots in the middle panels. The black dotted line in the top panel corresponds to the data presented in Figure 8 (po = 0.5, iCa = 0.05 pA, distance = 20 nm). In the bottom row of panels, G–I, the distance of one of the two channels is kept fixed at 20 nm, while the second channel distance is varied. The white vertical line corresponds to the distance of 30 nm used in Figure 10.
Figure 10.
A–C, Dependence of release ratio, mICa, and mCH on the total buffer concentration, in the case of two channels placed at distances of 20 nm and 30 nm from the release site, with a Ca2+ current of 0.1 pA through each of the channels. Note the high sensitivity to buffer concentration, and the nonmonotonic dependence of mICa on Btotal.
Figure 11.
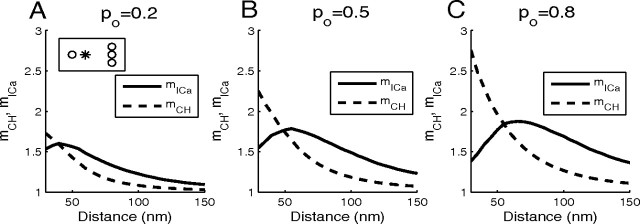
A–C, Behavior of mICa and mCH with four nonequidistant channels, placed as indicated in the inset of A, with one proximal channel at 30 nm from release site (“*”), and a line of three channels at varying distance from the release site, spaced by 30 nm. The current through each channel is 0.1 pA. The cooperativity measures mICa and mCH were computed using Equations 39 and 40 in Appendix B, which generalize Equations 20–22. Mobile buffer is present, with concentration of 100 μm and KD = 1 μm.
This leads to the following reaction–diffusion equations for the Ca2+ concentration, and the concentrations of the free (unbound) buffer:
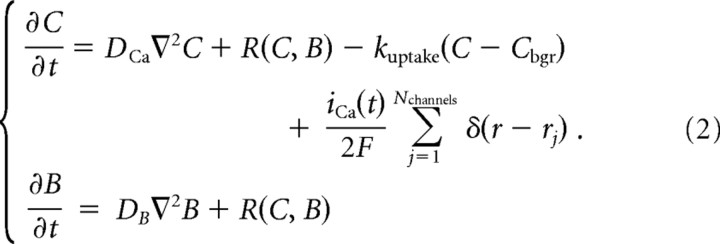 |
Here, C and B are concentrations of Ca2+ and the buffer, respectively, kuptake = 4 s−1 is the rate of Ca2+ uptake by internal Ca2+ stores, and R is the reaction term describing the mass-action kinetics given by Equation 1:
Btotal denotes the total concentration of the buffer; DB and DCa are the diffusion coefficients in cytosol of the buffer and Ca2+, respectively. We choose DCa = 200 μm2 · s−1 (Allbritton et al., 1992), and assume the presence of a single buffer species with fast Ca2+ binding kinetics kon = 0.7 μm−1 · ms−1, an affinity of KD = koff/kon = 1 μm, and moderately high mobility of DB = 50 μm2 · s−1. We vary the total buffer concentration, Btotal, to explore the effect of buffering on the Ca2+ cooperativity of exocytosis. Following convention, in Equations 2 and 3 we have assumed that the initial distribution of the buffer is spatially uniform, and that the diffusion coefficient of the buffer is not affected by the binding of Ca2+ (Bertram et al., 1999; Shahrezaei et al., 2006). Under these assumptions the sum of the bound and the unbound buffer concentrations is constant in space and time, and is equal to the total buffer concentration, Btotal. Thus, [CaB] = Btotal − B. The last term in Equation 2 for Ca2+ concentration represents the Ca2+ influx, where F is Faraday's constant, iCa(t) is the (inward) calcium current per channel, and δ(r − rj) is the Dirac delta function centered at the location of the jth channel. Equations 2 and 3 are solved inside a box enclosure representing the volume surrounding two channels, with dimensions 1 × 1 × 1 μm3. Each action potential is modeled as a 1-ms-long constant Ca2+ current, which is a free model parameter, varying over the range 0.04–4 pA. We impose reflective boundary conditions for Ca2+ and buffer(s) on the sides of the box, and have verified that the results are not significantly affected if absorbing (Dirichlet) boundary conditions are imposed instead. The boundary conditions for [Ca2+] on the top and bottom surfaces simulate extrusion by surface pumps with a time constant of 4 s (for details, see Matveev et al., 2006), which has only a minor effect on the simulated spatiotemporal Ca2+ dynamics.
Ca2+ binding and synaptic response.
We adopt the cooperative Ca2+ binding scheme of (Heidelberger et al., 1994), with parameter values from Felmy et al. (2003):
 |
These reactions are driven by the Ca2+ time course found by integrating Equations 2 and 3; the binding and unbinding rates are set to kon = 0.116 μm−1 · ms−1 and koff = 8.43 ms−1, and the fusion rate is γ = 6.96 ms−1. The cooperativity parameter b is set to 0.25, as by Felmy et al. (2003). The neurotransmitter release rate is given by R = γCa5X. We set X(0) = 1 as the initial condition, so the release rate is quoted per vesicle per unit time (see Fig. 1A,C). The reactions in Equation 4 are converted to ordinary differential equations using the law of mass action. We note that most of our results and conclusions are qualitative in nature and are not sensitive to the specifics of the Ca2+ binding scheme.
Numerical simulations.
All spatial Ca2+ diffusion simulations (see Figs. 1, 7–11) were performed using the CalC (“Calcium Calculator”) software (Matveev, 2008). CalC uses the alternating-direction implicit finite-difference method to solve the buffered diffusion equations (Eqs. 2, 3), with second-order accuracy in space and time. To preserve the accuracy of the method in the presence of the nonlinear buffering term, equations for [Ca2+] and [B] are solved on separate time grids, shifted with respect to each other by half a time step. CalC uses an adaptive time-step method, with a nonuniform spatial grid that has greater density of points close to the Ca2+ channel array. Grid size is adjusted to limit the numerical error to ∼5% (grid of 60 × 60 × 50 points). CalC integrates the ordinary differential equations derived from Equation 4 using the fourth-order adaptive Runge–Kutta method. CalC is freely available from http://www.calciumcalculator.org, and runs on all commonly used computational platforms (UNIX, Mac OS X, and Windows/Intel). To ensure reproducibility of this work, the commented simulation script files generating the data reported here are available at the CalC web site.
Results
I. Biochemical Ca2+ cooperativity of exocytosis
We first examine the intrinsic biochemical Ca2+ cooperativity of neurotransmitter release corresponding to the exocytosis scheme of Felmy et al. (2003) (Eq. 4) that we use in this study. There are two ways to measure the intrinsic cooperativity: either by directly varying intracellular [Ca2+]int, for instance using caged-Ca2+ compounds combined with Ca2+ imaging to measure [Ca2+]int, or by varying the extracellular Ca2+ concentration, [Ca2+]ext. Therefore, we distinguish between two cooperativity measures, nint and next. Generally, cooperativity is defined as the exponent of an assumed power-law relationship, as follows:
However, release follows a sigmoidal Hill function of Ca2+, so we prefer to use the slope of the log-log dependence of release on [Ca2+]:
 |
Here n = nint represents the true biochemical Ca2+ cooperativity of exocytosis. Although a direct measurement of the intrinsic Ca2+ cooperativity has been successfully performed at some synapses, notably at the calyx of Held (Bollmann et al., 2000; Schneggenburger and Neher, 2000), in many preparations the Ca2+ cooperativity of exocytosis is assessed indirectly, by varying the extracellular [Ca2+] concentration. The resulting indirect measure, next, is expected to provide an accurate estimate of the true biochemical Ca2+ cooperativity, nint, due to the approximate linear relationship between [Ca2+]ext and the single-channel Ca2+ current described by the Goldman–Hodgkin–Katz equation (Keener and Sneyd, 1998). Note, however, that the Ca2+-dependent inactivation of Ca2+ channels leads to a sublinear relationship between iCa and [Ca2+]ext (Mintz et al., 1995; Church and Stanley, 1996), saturating at concentrations of [Ca2]ext = 2–3 mm (Schneggenburger et al., 1999). Moreover, the relationship between iCa and [Ca2+]int may be affected by Ca2+ buffers. To examine the effect of buffers, we simulated the dynamics of [Ca2+] and the resulting exocytosis rate resulting from a 1-ms-long Ca2+ current pulse of varying amplitude entering a cubic volume through a single channel, driving the release scheme given by Equation 4 for a site 28 nm from the channel. Figure 1 shows the behavior of the maximal release rate plotted either as a function of peak [Ca2+] at the release site (Fig. 1A,B), or as a function of the single-channel Ca2+ current (Fig. 1C,D), for different values of buffer concentration. The maximal slope of the relationship between the maximal release rate and the peak [Ca2+]int (B) equals 4.8, indicating the presence of 5 Ca2+-binding sites, regardless of the total Ca2+ buffer concentration. Note that nint approaches this upper bound of 5 only at low Ca2+ current values, whereas its magnitude is closer to 3.5 at physiological values of peak Ca2+ in the range 10–15 μm (Müller et al., 2008). Note also that the value of nint depends on the pulse duration, since peak Ca2+ concentration is not maintained sufficiently long to allow full equilibration of the release kinetics, as discussed by Wölfel and Schneggenburger (2003) and Shahrezaei and Delaney (2005).
While the small cooperativity at high [Ca2+] influx is caused by the saturation of the release machinery, the small cooperativity at low values of [Ca2+] influx is due to the effect of nonzero background [Ca2+] ([Ca2+]bgr = 0.1 μm); small nonzero background release rate is present even in the absence of Ca2+ influx, so the peak Ca2+ has to be significantly higher than this background value to lead to a release rate increase.
When release rate is plotted as a function of the single-channel current, iCa (Fig. 1C,D), the influence of the buffer is revealed. For a given range of peak iCa, the cooperativity can vary from near 1 to >4, depending on the buffer concentration. Also, increasing the buffer concentration can either decrease the cooperativity (over a range of small iCa values) or increase it (over a range of large iCa values). In the former case, an increase in buffer diminishes the already weak effects on release of the opening of a Ca2+ channel, relative to the background release, so the apparent cooperativity declines. In the latter case, there is saturation of release sites, which is partially relieved by an increase in the buffer concentration, resulting in an increase in the apparent cooperativity when the buffer concentration is increased. In either case, the buffer changes the relationship between iCa and [Ca]int by absorbing free Ca2+ ions. Thus, experimental measurements of biochemical cooperativity obtained by varying [Ca]ext (and thus iCa) should include a range of variation sufficient to contain the peak in the cooperativity curve (Fig. 1D), since otherwise the biochemical cooperativity will be underestimated.
II. Distinct measures of Ca2+ channel domain overlap
We now turn to the main question of how one can measure the extent of Ca2+ channel domain overlap in the triggering of release. The number of channels contributing to exocytosis of a single vesicle can be assessed by measuring the sensitivity of exocytosis to a partial pharmacological block of Ca2+ channels, rather than the uniform variation in [Ca2+]int or [Ca2+]ext that is used to probe the biochemical cooperativity of exocytosis (Yoshikami et al., 1989; Mintz et al., 1995; Wu et al., 1999). We are primarily concerned with the case of nonselective block, whereby all Ca2+ channels involved in release are uniformly affected, but will briefly restate and extend the results for selective channel block previously discussed by Bertram et al. (1999).
An alternative approach is provided by the tail current protocol, whereby the number of open channels is varied while keeping the driving force constant by applying hyperpolarizing pulses following activating depolarizing steps of different duration (Quastel et al., 1992; Gentile and Stanley, 2005). Assuming power-law scaling between release rate and the macroscopic (rather than single-channel) Ca2+ current, ICa, the Ca2+ current cooperativity of exocytosis would be defined as the exponent m of this relationship, R ∼ (ICa)m (Bertram et al., 1999; Wu et al., 1999) (cf. Eqs. 55–60 of the former reference). Denoting the baseline (unmodified) release rate and the corresponding Ca2+ influx as R0 and I0, respectively, one obtains the following:
 |
Here po is the fraction of channels that are unaffected by the channel blocker, or the fraction of channels that open in response to depolarization in the tail current protocol. Below we will refer to this exponent as the logarithmic Ca2+ current cooperativity of exocytosis, and denote it as m = mICa,log. However, as was pointed out above (see Eq. 6), the relationship between release and ICa is sigmoidal rather than power law. Thus, we also present our results in terms of the more rigorous measure provided by the slope of the log-log relationship between R and ICa:
 |
where P(R) is the probability of release. Although the above two definitions of current cooperativity can differ significantly, we will see that both measures attain their lower bound of 1 in the limit of single-channel coupling of each vesicle, or in the limit of strong channel block (po→0), and attain the upper bound of n (biochemical cooperativity) in the limit of many overlapping domains, which is only possible when a small fraction of channels is blocked (po→1) (see Fig. 3). The current cooperativity defined by Equation 8 describes the sensitivity of release rate to the total Ca2+ current when it is varied by varying the channel open fraction po. It does not represent the sensitivity of release to the single-channel Ca2+ current, iCa.
Figure 3.
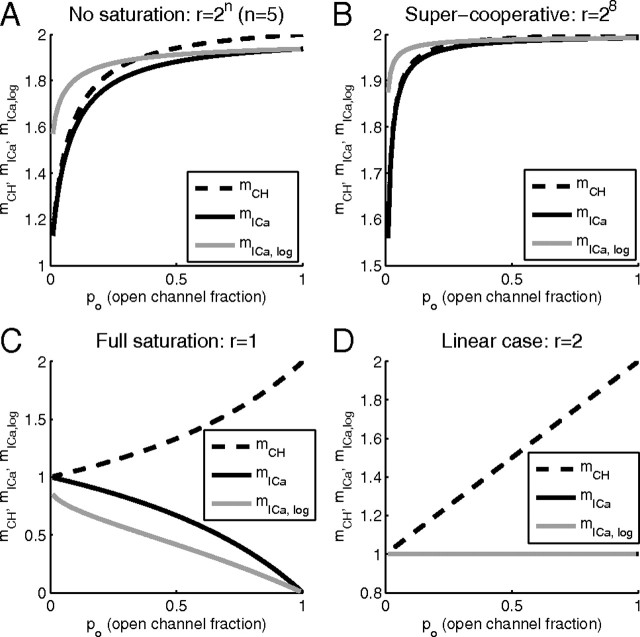
A–D, Distinction between Ca2+ current cooperativity (mICa) and channel cooperativity (mCH) in the case of two equidistant channels per vesicle, for different values of release site saturation, r = (R|2)/P(R|1). Cooperativity measures are plotted against the open channel probability (fraction), po. mICa equals mICa,log (solid gray curve) only in the case r = 2, corresponding to D (solid gray and black curves overlap). Note that mICa,log was previously examined in Figure 7 of Bertram et al. (1999), in the case r ≥ 2, using a different notation, 1/r = (f(1)+f(2))/2, ρ = 1 − po, n = mICa,log.
The Ca2+ current cooperativity measures mICa and mICa,log will be distinguished from the underlying Ca2+ channel cooperativity, which we denote mCH, and define as the average number of channels participating in exocytosis of a single vesicle. This definition is made more precise in the next section.
III. Distinction between Ca2+ channel and Ca2+ current cooperativity
To clearly demonstrate the distinction between mCH and mICa, we consider an idealized example of two channels coupled to each vesicle, with equidistant channel–vesicle separation, as shown in Figure 2. Even though this is a highly idealized case, we will show below that our results generalize to an arbitrary number of equidistant channels (section IV and Appendix A) and to nonequidistant channels (section VI and Appendix B).
Figure 2.
Probabilities of distinct configurations of the release site with two channels per vesicle. Denoting the open (unblocked) channel probability by po, the probability of both channels being blocked is P(0) = (1 − po)2, whereas the probability of one open channel is P(1) = 2po(1 − po), and the probability of both channels remaining open is P(2) = (po)2.
In the case of two equidistant channels, the current cooperativity given by Equation 8 can be calculated as follows:
 |
where we take into account that the release rate R is proportional to release probability, P(R), given by the following:
 |
 |
where P(R|k) is the conditional probability of release given that k channels are open, P(k) is the probability that k channels are open (Fig. 2), and the release ratio parameter r quantifies the increase in release produced by the opening of two channels, compared with the case of a single open channel. This is a crucial parameter in the problem, reaching its lowest value of 1 when the release is completely saturated by the opening of a single channel, and attaining its highest value when the release is far from saturation, in which case it approximately equals 2n, where n is the actual biochemical cooperativity (number of Ca2+ binding sites per vesicle). In the notation of Bertram et al. (1999), r = 1/f1 and ρ = 1 − po. Plugging Equation 10 into Equation 9 yields the following:
 |
A somewhat different expression is obtained with the logarithmic definition, Equation 7:
 |
where the release rate R is again taken to be proportional to the probability of release, P(R), and R0 is the release rate at zero block fraction (po = 1). It is evident from the expressions above that current cooperativity is not a constant quantity, but depends on the channel open fraction po, as previously noted by Bertram et al. (1999).
We next derive an expression for the channel cooperativity, which we define as the average number of channels that open to produce a single release event, weighted by the amount of Ca2+ that each open channel delivers to the vesicle site; this quantifies the number of channels contributing to exocytosis at a given site. In the case of equidistant channels, each channel provides on average the same amount of Ca2+ to the vesicle, so the channel cooperativity equals the average number of channels that open per release event. Denoting P(k|R) the probability that k channels were open when a release event occurred, and applying Bayes' formula for conditional probabilities, in the case of two equidistant channels we obtain the following:
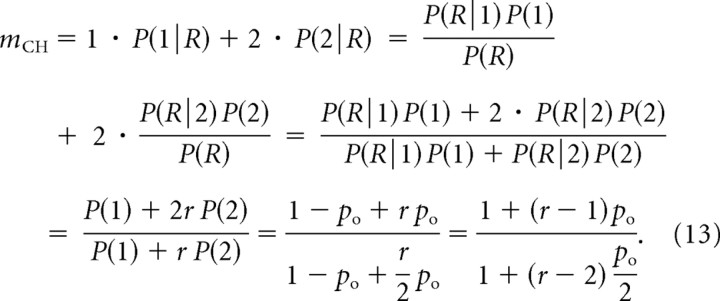 |
This definition easily generalizes to the case of an arbitrary number of equidistant channels (see Appendix A).
Our expressions for current cooperativity, Equation 11, and channel cooperativity, Equation 13, are very similar, but distinct. Figure 3 shows the dependence of these cooperativity measures on channel open probability in the case of two equidistant channels, under several conditions. In Figure 3, A and B, the release site is not near Ca2+ saturation, so the opening of a second channel has a maximal effect on release, r = 2n. The different measures of cooperativity all increase with po, and mCH and mICa have similar values. This is particularly true in Figure 3B, where the biochemical cooperativity is 8. Indeed, in this case the current and channel cooperativities are almost identical. Note that mICa,log has the same trend as mICa, but differs quantitatively. Figure 3C shows the opposite case, where the release site is saturated by Ca2+ from a single open channel, r = 1. The channel and current cooperativities are now widely divergent. In fact, mICa decreases with the fraction of open channels while mCH increases. In the linear case (Fig. 3D), where release from two open channels is twice that from one open channel (r = 2), there is again wide divergence between the cooperativity measures. The similarity between mICa and mICa,log allows us to focus exclusively on the differential current cooperativity measure, mICa, instead of the logarithmic definition of current cooperativity considered in several other studies (Bertram et al., 1999). As Equations 11 and 13 demonstrate, mICa allows for more simple generalization of the formulas for current and channel cooperativity measures.
As Figure 3 shows, mCH approaches the number of available channels (here, M = 2) as the channel opening probability increases to 1, but remains significantly below this upper bound for smaller values of po, since in this case many release events are triggered by the opening of a single channel. Note, however, that mCH can never be lower than 1, since at least one channel has to open to release a vesicle.
From this analysis, we see that mICa provides an accurate estimate for mCH in two distinct cases: (1) limit of low saturation, high biochemical cooperativity n (r→∞) (Fig. 3A,B); (2) limit of large block fraction, po→0. However, mICa provides little information about the underlying channel domain overlap under conditions of large saturation of the release site. This is necessarily the case, since at saturating levels of [Ca2+] the sensitivity of release to Ca2+ and the channel blocker is reduced, regardless of the number of channels involved in release.
Figure 4 shows the behavior of the three distinct cooperativity measures for three fixed values of po and a range of release ratio values, r. Notice that all measures of cooperativity decrease as the release site becomes saturated (r→1) and that mICa and mCH differ the most near the saturation limit, r→1. Note also that the current cooperativity, mICa, can yield values of <1 in the case of low release ratio values, r→1, since in this limit the release is close to saturation and as the iCa-secretion curve plateaus, its slope approaches zero.
Figure 4.
A–C, Dependence of Ca2+ channel and Ca2+ current cooperativity measures on the release ratio, r, for different levels of open channel fraction, po.
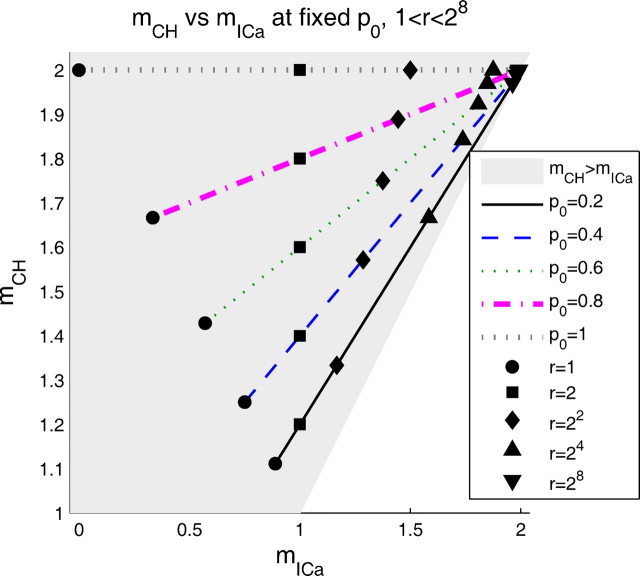
A nonobvious relationship reveals itself if the channel cooperativity is plotted against the current cooperativity, as in Figure 5. Even though mCH and mICa exhibit different nonlinear dependences on parameters r and po, Figure 5 shows that the relationship between mCH and mICa is linear. Evaluating the slope of the plot for different values of po, we found the following simple linear dependence:
as can be verified by substituting in the formulas for mCH and mICa in Equations 11 and 13. Equation 14 can also be written as follows:
In the next subsection we will show that mICa is bounded by the number of available channels (here M = 2), which implies that mICa ≤ mCH.
Figure 5.
Channel cooperativity mCH and current cooperativity mICa are linearly related. As the release ratio is increased from 1 (saturating release case) to 28 (supercooperative release), the point (mICa, mCH) moves along a line with slope that depends on po, as given by Equation 14. For all values of r and po, mCH ≥ mICa (gray region). As r increases, both cooperativity measures approach 2, the number of available channels. In the limit po→0, mICa approaches mCH (1:1 line), and both approach 1.
Figure 5 also confirms the conclusions above on the relationships between mCH and mICa. In particular, it shows that mCH and mICa are close when po→0 (boundary of the gray region), and when r is large (downward-pointing triangles). Namely, in the limit po→0, both cooperativity measures approach 1 for any fixed value of release ratio r, whereas in the limit r→∞ they approach 2 (the number of available channels), for any finite value of po. Thus, we can interpret Equation 14 as follows: when po = 1, both channels are open, and both contribute equally on average, so mCH = 2; as po approaches 0, again for any fixed value of r, double channel openings are rare, and both mCH and mICa approach 1.
IV. Generalization to M equidistant channels and upper bounds on mCH and mICa
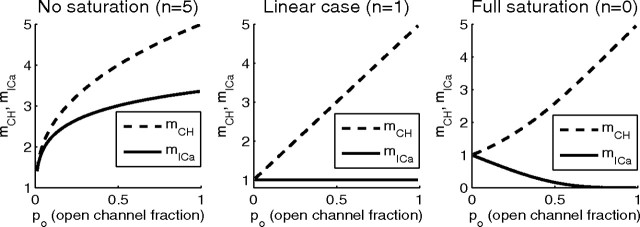
The results summarized by Figures 3–5 for two equidistant channels may be extended to M channels, and the derivation of mCH and mICa for this general case is given in Appendix A. One special case of M = 5 channels is illustrated in Figure 6, which shows that the qualitative features of both cooperativity measures are similar to the M = 2 case examined in Figure 3.
Figure 6.
Dependence of mCH and mICa on the open channel fraction in the case of M = 5 equidistant channels, described by Equation 34 of Appendix A.
In particular, Figures 3–6 demonstrate that neither mICa nor mCH may ever exceed M, the number of available channels. Equation 11 shows that mICa can only reach this upper bound in the limit of high biochemical cooperativity of exocytosis, r→∞. This bound also holds for an arbitrary number of equidistant channels, M, since the release probability is a polynomial of order M in po (Eq. 27 of Appendix A). Consider, for instance, the limiting case of very high biochemical cooperativity, n. In this case, release will be dominated by the sites with all M channels open, with a corresponding probability of P(R) ∝ poM, yielding a log-log slope of mICa = M. Note that the understatement of M by mICa, already apparent for M = 2 (Figs. 3–5), is exaggerated for M > 2. Although it is still true that mCH converges to M as po→1, mICa approaches M[1 − (1 − 1/M)n] in this limit, so the biochemical cooperativity n may have to be much larger than the physiological value of 4–5 in order for mICa to reach M, even when po = 1.
Current cooperativity mICa is also bounded by the biochemical cooperativity of exocytosis, n. For instance, in the linear release case, n = 1 (r = 2n = 2), Equation 11 yields mICa = 1 ≤ n, and therefore in this case mICa cannot reach the upper bound of 2 set by the number of channels. The generalizations of Equations 10–14 to the case of M equidistant channels provided in Appendix A confirm these two upper bounds on mICa, since for po = 1 Equation 36 yields the following:
The generalized definition of mCH for M equidistant channels (Eq. 30) immediately shows that mCH can be as large as but not exceed M, as it is an average of values that range from 1 to M. The relationship between mICa and mCH shown in Equation 14 also generalizes naturally to the case of M channels (see Eqs. 27–31):
Equation 17 may be rewritten as follows:
demonstrating that mICa ≤ mCH for M equidistant channels. Since mICa is bounded by the number of binding sites, n (Eq. 16), while mCH is not, the two cooperativity measures can diverge very significantly when the number of channels is larger than the number of binding sites. In this case the discrepancy between mICa and mCH will be even greater than for the case M = 2 or M = 5 detailed in Figures 3–6. In fact, it is well recognized that in the large-M case, mICa will approach n, which agrees with our Equation 36, and the approximate equality between mICa and n is taken to infer the participation of many channels in the exocytosis of a single vesicle (Borst and Sakmann, 1999; Schneggenburger and Neher, 2005). In particular, Meinrenken et al. (2002) used a model to estimate mCH using mICa, and they found that mCH had to be larger than 10 in the model to attain values of mICa in the range 3–4, as observed in experiments. This confirms our predicted general bound on mICa, and in addition shows that mICa can be considerably smaller than n unless the number of channels is large. To consider an opposite extreme, it is also well recognized that if M = 1, then mICa = 1 (Yoshikami et al., 1989; Gentile and Stanley, 2005), in agreement with Equation 17 (in this case mCH = M = 1). The converse, however, is not true, and mICa = 1 does not imply M = mCH = 1, indicating again that the two cooperativity measures are not in general equal.
If the number of channels is greater than the number of Ca2+ binding sites n, the Monte Carlo simulation-based measure of channel cooperativity introduced by Shahrezaei et al. (2006) (see also Luo et al., 2008) cannot reach the upper limit M that bounds our measure mCH. They defined channel cooperativity as the average number of channels contributing Ca2+ ions to the Ca2+ binding sites in any given release event and calculated it by tracking the source of each of the ions that bind to the release sites. The latter measure, which we will denote mMC, is bounded by the number of binding sites, since the total number of channels that contribute an ion to a release event cannot exceed the number of Ca2+ binding sites. It is also bounded by the number of channels, M, so we have mMC ≤ min(M,n), the same bound obeyed by mICa, which may have encouraged the notion that the two are equivalent (Shahrezaei et al., 2006).
In the initial definition of mCH introduced with Equation 13, there were only two channels, which was less than the tacitly assumed number of binding sites, so mCH and mMC were close in magnitude. The appeal of our definition mCH is that it indicates the number of channels providing Ca2+ to the neighborhood of the fusing vesicle, in agreement with the commonly accepted quantification of channel domain overlap (Borst and Sakmann, 1999; Schneggenburger and Neher, 2005).
V. Effect of Ca2+ buffers on Ca2+ channel and current cooperativity of exocytosis
Instead of fixing the value of the crucial parameter r = P(R|2)/P(R|1) by hand as in the previous section, we now use computer simulations of Ca2+ diffusion to model the current cooperativity protocol. That is, we compute P(R|1) and P(R|2) by solving the Ca2+ diffusion equations (Eqs. 2, 3) and using the Ca2+ binding scheme at the release site given by Equation 4. Such direct simulation of Ca2+ diffusion will also enable us to demonstrate the effect of Ca2+ buffers on mCH and mICa. For the sake of simplicity and ease of interpretation, we assume the presence of a single buffer species of high affinity (KD = 1 μm), fast Ca2+ binding kinetics (kon = 0.7 μm−1 · ms−1), and moderate mobility, DB = 0.05 μm2/ms, as in Figure 1.
Figure 7 shows the dependence of mCH and mICa on the open channel fraction, for different values of the total buffer concentration Btotal, and for a fixed value of single-channel Ca2+ influx. These results were obtained using Equations 11 and 13, as were the corresponding results in Figure 3, but with the release ratio r calculated numerically, as indicated in the legend. For large block fraction, the correction for background release rate becomes significant and is taken into account, as described in Appendix C.
In Figure 7, both mICa and mCH increase when the buffer concentration is increased, at almost all values of the open channel fraction po. This occurs because of the reduction in the release site saturation, leading to an increase in r, and as already seen in Figures 4 and 5, both measures of cooperativity increase with increasing values of r.
In contrast, Figure 8 illustrates that a further increase in Btotal results in a decrease of release ratio, and hence, a reduction of channel and current cooperativities. This is because for Btotal > 1 mm the residual background release rate provides a more significant contribution to evoked release, so the number of open channels becomes less important. This results in a reduced release ratio. The reduction in r for large Btotal is reflected in decreasing values of mCH and mICa. Note that the effect of buffer concentration variation amounts to sliding up and to the right along a given fixed-po line in Figure 5, followed by a motion down and to the left as the release becomes comparable to the background release rate.
Finally, Figure 9 summarizes our results on the effect of buffers on Ca2+ channel and current cooperativities of exocytosis, examining different values of the single-channel Ca2+ current, iCa (Fig. 9A–C) and channel–vesicle distance (Fig. 9D–F). Note that the values of mCH and mICa are completely determined by the values of the release ratio plotted in the left panels of each row of plots. Note also that the linear relationship given by Equation 17 manifests itself in the scaling similarity between panels B and C, and E and F, respectively, of Figure 9. Figure 9G–I examines the situation in which the distance to one channel is kept fixed, while the distance to the second channel is increased, as discussed in the next section.
VI. Case of nonequidistant channels
In the previous sections we focused on the situation of two channels equidistant from a vesicle. We now generalize these results for the case of two nonequidistant channels.
We begin with the generalization of the current cooperativity expressions mICa given by Equations 9–11, using labels “10,” “01,” and “11” to reflect the opening of the proximal channel, the distal channel, and both channels together, respectively: P(01) = P(10) = po(1 − po), P(11) = po2. The release probability expression becomes the following:
 |
Note that the parameter r agrees with its definition in Equation 10 in the limit of equidistant channels, and in the notation of Bertram et al. (1999) is identical to 1/f1. Inserting Equation 19 into Equation 9 yields the following:
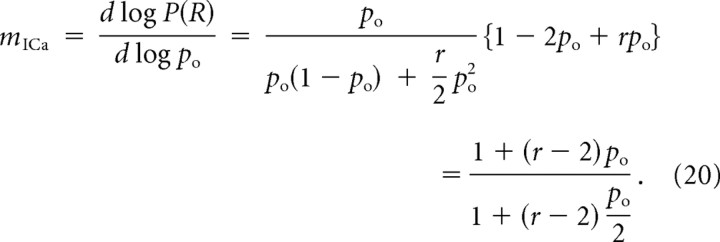 |
This expression is equivalent to Equation 11, given the above generalized definition of r. In particular, once again it is clear that mICa is bounded by the number of channels, M = 2.
To generalize the channel cooperativity measure mCH given by Equation 13, we quantify the contribution of each channel to the Ca2+ domain in the vicinity of the vesicle by measuring the Ca2+ concentration at the release site resulting from the opening of one channel at a time. That is, we let Ca10 and Ca01 denote the Ca2+ concentrations at the release site when only the proximal or distal channel is open, respectively. Note that Ca01/Ca10 < 1. We define the average number of channels contributing to release when both channels are open as 1 + Ca01/Ca10. Thus, the following is true:
 |
This heuristic approximation is particularly reasonable in the absence of buffering, since binding probability is proportional to Ca2+ concentration, and it reduces to Equation 13 in the limit of equidistant channels, Ca10 = Ca01. From Equations 19 and 21, we obtain the following:
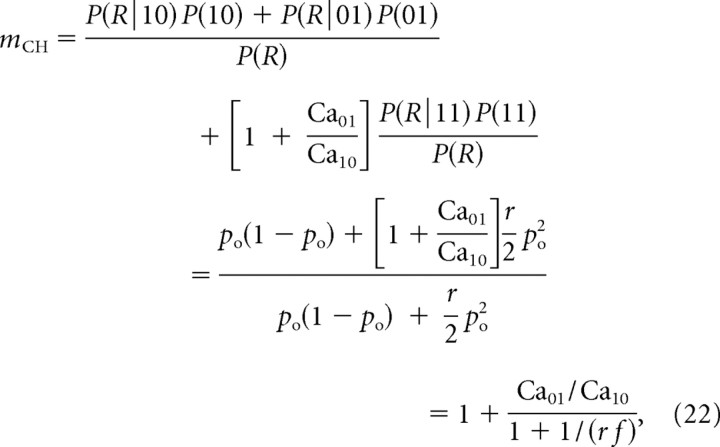 |
where the new parameter f = po/[2(1 − po)] is the ratio of two-channel to single-channel opening probabilities. In the limit of moving one channel far from the vesicle while keeping the other channel fixed, mCH as defined by Equation 22 approaches 1, which agrees with the intuition that the closer channel dominates.
In contrast to the case of equidistant channels, the sign of the difference between mICa and mCH depends on the model parameters:
 |
In particular, mICa overestimates mCH if Ca01 < Ca10(1 − 2/r). For sufficiently remote placement of the distal channel, this condition is satisfied, as demonstrated in Figure 10. Note that the release ratio calculated in the left panel of Figure 10 is smaller than that calculated in the case of equidistant channels (Fig. 8, left), since the proximal channel makes the dominant contribution to release. As expected, the channel cooperativity decreases with increasing buffer concentration, due to the increased shielding of the remote channel by the buffer. In contrast, current cooperativity shows nonmonotonic behavior as in the equidistant case (Fig. 8, right).
These results are further illustrated in Figure 9G–I, where the distance to the remote channel is varied along the horizontal parameter axis. Note that the entire Figure 10 corresponds to the white vertical line in Figure 9G–I. The lack of similarity between the behavior of mCH (Fig. 9H) and mICa (Fig. 9I) demonstrates that the simple linear relationship between mCH and mICa given by Equation 17 does not hold in the case of nonequidistant channels.
In the case of nonequidistant channels, as in the case of equidistant channels, mICa and mCH can be generalized to an arbitrary number of channels. Figure 1 1examines the situation of four channels per release site, with one proximal channel situated at a distance of 30 nm from the release site, and a line of three channels separated by 30 nm from each other, with the cluster center located at varying distances of 30–150 nm from the release site (Fig. 11A, see inset). As expected from the analysis of two channels, the channel cooperativity monotonically decreases as the distance to the three-channel cluster increases, reaching values between 1 and 2. Thus, the effect of the remote channel cluster can be reduced to the effect of a single remote channel of greater current amplitude. In contrast, the dependence of mICa on the distance is nonmonotonic, since release is partially saturated when all four channels are close to the release site, so the current cooperativity increases until the distance is large enough to prevent the saturation of the site. In contrast to the equidistant channel case, current cooperativity can be larger than channel cooperativity, as noted above for two channels (Fig. 9G–I).
Finally, we note that the dependence of channel cooperativity on buffer concentration and distance allows us to infer the effect of diffusional barriers, which are likely to exert significant influence on the Ca2+ concentration microdomains at the active zone (Kits et al., 1999; Glavinović and Rabie, 2001; Shahrezaei and Delaney, 2004). Although we have not explicitly calculated the effect of diffusion barriers, their influence on current and channel cooperativities can be understood in terms of the parameter dependence shown in Figures 7–11. Namely, if the barriers uniformly shield a population of channels from the vesicle, this effect is analogous to an increase in the diffusional distance of each channel from the release site, which may either decrease or increase mCH and mICa, depending on the degree of saturation of release, as shown in Figure 9D–F. However, if the diffusional barrier preferentially shields a subset of channels, this would be analogous to the situation examined in Figure 11; in particular, this would necessarily lead to a decrease of the channel cooperativity, mCH.
VII. Case of selective block
Above we have considered the case of nonselective channel block, whereby the open channel fraction po characterizes the open probability of all channels contributing to exocytosis. However, Ca2+ current cooperativity measurements are also used to probe the participation of different Ca2+ channel subtypes in exocytosis, by blocking one type of Ca2+ channel at a time (Dunlap et al., 1995; Mintz et al., 1995; Reid et al., 1998; Wu et al., 1999; Scheuber et al., 2004). This situation was analyzed in detail by Bertram et al. (1999) (see p. 742 therein) in terms of cooperativity measure mICa,log (denoted “n” in that paper). Here we extend those results to the mICa and mCH measures. If we consider two channels at different distances from the release site, with channel 2 defined to be the distal channel as before, Equation 19 generalizes to the following:
 |
If only the distal channel is affected by the block, p1 is constant but p2 varies. Assuming for simplicity that both channel contribute equally to total Ca2+ current, ICa is proportional to p1 + p2, and we obtain the following:
 |
As the distance from the release site to the blocked (distal) channel increases, then f10→1, and f01→0, and according to the above expression, mICa→0. Moreover, mICa monotonically decreases as the distance to the blocked channel increases. Conversely, if the proximal channel is blocked, then mICa monotonically increases as the nonblocked (distal) is moved away from the release site. These results validate the usual interpretation that a low mICa value indicates a large distance from the release site of the channel subtype affected by the blocker (Wu et al., 1999). Thus, a low value of mICa is ambiguous, and can either indicate a tight coupling between the release site and a single channel in the case of random (nonselective) channel block, or, conversely, may indicate a large separation between the release site and the affected channel in the case of selective channel block. We reiterate that caution must be exercised in interpreting a low value of mICa obtained even with nonselective block, as mICa can significantly understate the number of channels interacting with a release site; a low value of mICa can be obtained when either one nearby channel dominates release or when release is close to saturation, as discussed above in section IV.
Generalizing mCH to the nonselective case transforms Equation 22 to the following:
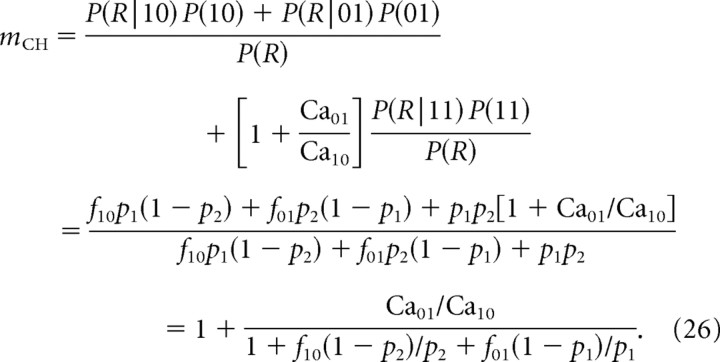 |
As the remote channel is separated from the release site, Ca01→0, f01→0, and f10→1, so the channel cooperativity approaches unity. Thus, in contrast to mICa, mCH has the same limit no matter which of the two channel types is blocked and independent of the degree of block.
Discussion
The notion of cooperativity between release rate and Ca2+ concentration was initially introduced to characterize the intrinsic chemical properties of the putative release mechanism (Dodge and Rahamimoff, 1967). More recently the cooperativity concept has been extended to quantify the sensitivity of the release rate to the whole-terminal Ca2+ current, ICa, whereby the number of open channels is varied while the single-channel Ca2+ current is kept constant. The exponent of the resulting nonlinear relationship between release rate and ICa has been termed “current cooperativity” and denoted here mICa. A similar technique measures the sensitivity of exocytosis rate to the fraction of available channels by titrating the channel opening probability using tail currents (Gentile and Stanley, 2005). These techniques allow one to address the question of how many channels contribute to the exocytosis of a single vesicle at a given synaptic terminal (for review, see Gentile and Stanley, 2005). However, the validity of mICa [called NCaCh by Gentile and Stanley (2005)] as a measure of the underlying channel participation in exocytosis has not been previously rigorously examined. The Monte Carlo simulation approach of Shahrezaei et al. (2006) and Luo et al. (2008) sought a direct calculation of channel cooperativity by counting how many different channels in an active zone contributed Ca2+ ions to the Ca2+ binding gates at a given release site, averaged over multiple release events. This measure of channel cooperativity, which we denote mMC, was asserted to be equivalent to current cooperativity mICa, as long as release is far from saturation. Others had also implicitly assumed that channel and current cooperativity are the same, or at least closely related (Bertram et al., 1999; Gentile and Stanley, 2005).
Here we have rigorously defined the various measures of cooperativity, both conceptually and mathematically. Our goal was not to establish the number of channels contributing to a single release event, which is likely to vary between different types of synapses, but to clarify the concepts and formulas so that such determinations can be made rigorously and consistently from experimental data. In particular, we showed that the Ca2+ current cooperativity, mICa, and the underlying Ca2+ channel cooperativity, mCH, are not equal (Figs. 3–6). Our definition of channel cooperativity, mCH, differs from that of Shahrezaei et al. (2006) and Luo et al. (2008), mMC, defined as the average number of channels providing Ca2+ ions for the exocytosis of a single vesicle. In keeping with the deterministic character of our simulations, which preclude tracking the source of ions that bind (indeed, Ca2+ is treated as a continuous substance rather than a collection of ions), we have defined mCH for equidistant channels as the average number of channels that open to produce a single release event (Eq. 13). As we have noted, mMC cannot exceed the number of binding sites, but mCH can be as large as the number of channels. Thus, the measure we consider is a true measure of domain overlap, and can in principle yield values as high as 60 in some specific cases such as the calyx of Held terminal (Borst and Sakmann, 1996; Meinrenken et al., 2002). The two measures mCH and mMC are approximately equal if the number of channels is less than or equal to the number of binding sites and channels are equidistant from the vesicle, but differ in general. To take a numerical example, if there is a single binding site but 10 equidistant open channels, each channel will contribute 1/10 of the ions that bind, averaged over many trials, so mCH = 10, but only one channel can contribute to any single event, mMC = 1.
Although we have shown mICa and mCH to be conceptually distinct using simple mathematical expressions, we found that the two measures are closely related, at least when the channels are equidistant from the vesicle. We also confirmed the assertion of Shahrezaei et al. (2006) that the two measures are numerically close when release is not saturated and the number of channels is small (Figs. 3, 4). The formulas are particularly simple for two equidistant channels because they depend on only two nondimensional parameters, the channel open probability, po, and the ratio r of release with two channels open to that with one channel open. This simplicity comes about because we have decoupled the dependence of the release fraction r on all the various physical properties of the synapse, which is complex, from the dependence of the two cooperativity measures on r, which is simple.
The definitions of mICa and mCH generalize naturally to M equidistant channels (Eqs. 27–31). Although the final expressions become very complex (Eqs. 32–36), the qualitative behaviors of mICa and mCH elucidated for the two-channel case are still applicable in the case of arbitrary M, as illustrated in Figure 6. For instance, we found that mICa cannot be greater than mCH when the channels are equidistant from the vesicle (Eq. 18). Thus, mICa, which can be determined experimentally, gives a lower bound for the underlying mCH, which cannot be measured with current technology.
For the case of two nonequidistant channels, we found the expression for mICa (Eq. 20) to be identical to that for the equidistant channel case (Eq. 11), and constructed a heuristic generalization of mCH (Eq. 22) that weights the contribution of each channel by the concentration of Ca2+ it provides when it opens alone. Thus, if there are two channels, one close to the vesicle and a second far away, both mCH and mMC will be close to 1, reflecting the near channel's dominant contribution to release. Note that mICa would also be near 1 in this case. We showed that this result also holds for one near channel and a cluster of several remote channels: namely, mCH and mICa both approach 1 as the distance to the remote channel cluster increases, reflecting the dominance of the proximal channel (Fig. 11). This agrees with the intuition of proponents of single-channel release. In contrast, with an array of many channels nearly equidistant from a vesicle, mCH would be approximately equal to the number of channels, as posited by the many-channel proponents. However, if the number of channels is large, mICa may be a severe underestimate of mCH, since it cannot exceed the number of binding sites (Eq. 16). The channel cooperativity measure of (Shahrezaei et al., 2006), mMC, would also be bounded by the number of binding sites and thus would not capture the intuition of collective control of release by a large number of channels, each making a small contribution.
Neither mCH nor mMC is experimentally measurable with current technology, but mCH is more likely to be measurable in the future, since it may eventually be possible to determine the location and the gating state of presynaptic Ca2+ channels, as well as the resulting Ca2+ concentration at the putative release site. In contrast, it is difficult to envision an experimental method to determine mMC, which would require identifying which channels provided the Ca2+ ions that triggered a given release event.
Finally, we addressed the conflicting results on the effects of exogenous buffers on channel cooperativity gleaned from prior modeling work. The study of Bertram et al. (1999) suggested that the effect of buffer addition will depend strongly on its Ca2+-binding properties. Namely, a saturable buffer would increase the cooperativity regardless of channel arrangement, due to the interchannel interactions in the saturation of the buffer. On the other hand, a high concentration of nonsaturable buffer was shown to decrease the simulated Ca2+ current cooperativity, since its only effect would be to intercept Ca2+ ions from each of the channels, restricting the extent of domain overlap. In contrast, the Monte Carlo study of Shahrezaei et al. (2006) suggested that buffers can only reduce channel cooperativity, regardless of the buffering properties. However, the latter study did not include a full sensitivity analysis with respect to various buffering parameters, due to the computational expense of Monte Carlo simulations, and did not distinguish between channel and current cooperativity. Here we addressed this open question by simulating the buffered Ca2+ diffusion for a range of total buffer concentration values and other simulation parameters, and the results in Figures 7–9 show that mCH and mICa may in fact exhibit nonmonotonic dependence on Btotal in the equidistant channel configuration, supporting and generalizing the conclusions of Bertram et al. (1999). However, we also observe that for the nonequidistant channel configuration, an increase in buffering causes a monotonic decrease in channel cooperativity mCH (Figs. 9H, 10, 11), in agreement with the results of Shahrezaei et al. (2006), since an increase in buffering increases the shielding of the remote channel.
Appendix A: Arbitrary Number of Equidistant Channels
Derivation of linear relationship between mCH and mICa
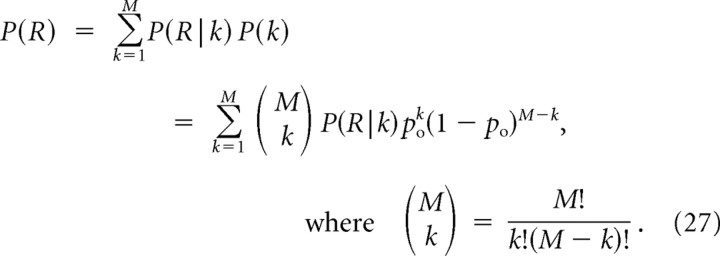
Here we generalize Equation 14 to the case of M equidistant channels. Denoting P(R|k) the probability of release given k open channels, the release probability is given by the following:
 |
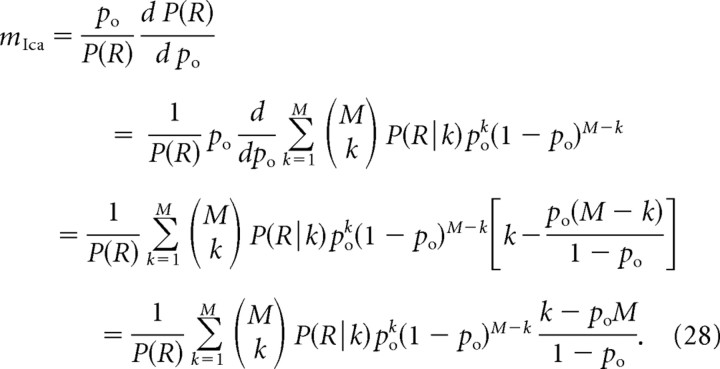
Now, the current cooperativity is given by the following:
 |
Multiplying by (1 − po), we obtain the following:
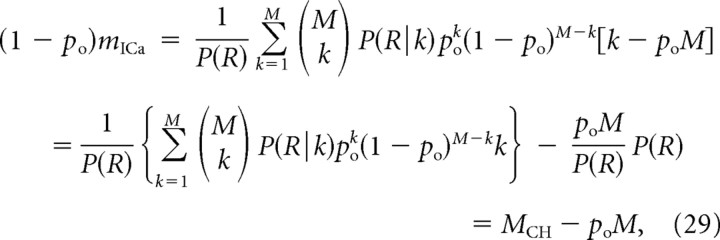 |
where the channel cooperativity mCH is given as the generalization of Equation 13:
 |
Here it is assumed that all k open equidistant channels contribute equally to release. Thus, the following is true:
which generalizes Equation 14.
Closed-form expressions for mCH and mICa
To obtain closed-form expressions for mCH and mICa generalizing Equations 11 and 13, we assume a linear relationship between the number of open channels and the local Ca2+ concentration, and in the absence of release saturation we have P(R|k) ∝ kn, where n is the biochemical cooperativity of neurotransmitter release. Differentiation with respect to po of the binomial distribution generating function, (po + qo)M, allows us to express the release probability, Equation 27, as follows:
 |
Current cooperativity is obtained using Equation 9, while channel cooperativity is obtained as follows:
 |
Note in particular that P(R) is a polynomial of order M in po, and therefore its logarithmic derivative, mICa = dlog P(R)/dlog po, is bounded from above by M.
The resulting functional form of mCH and mICa for several different values of n is given below:
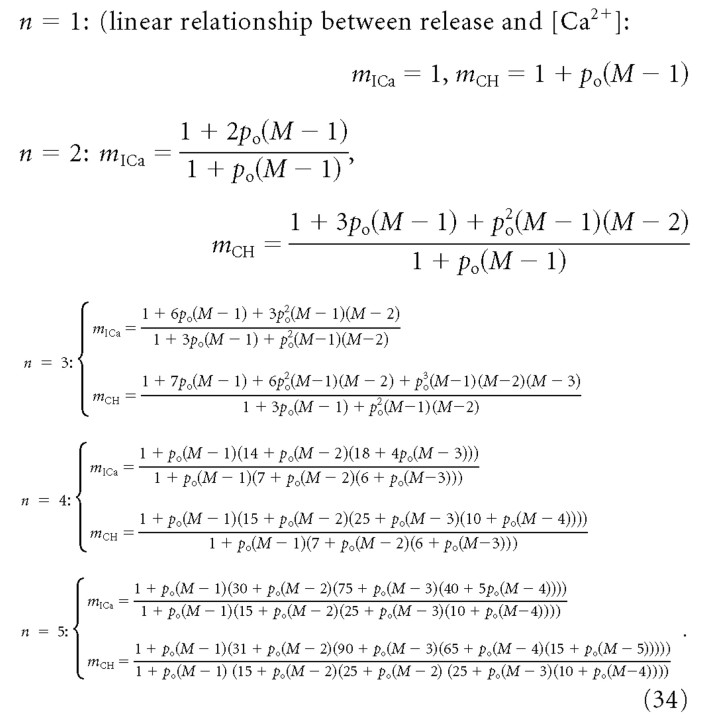 |
As a check of these expressions, setting M = 2 yields Equations 11 and 13, with r = 2n.
We find the following limiting behavior for po→1, for any values of M and n:
 |
where qo = 1 − po. Note in particular that mCH approaches the channel number M in this limit, while mICa is always an underestimate of M, since it is the log-log slope of a polynomial in po of order M. Note also that mICa is also bounded by the number of binding sites, n, since the following is true:
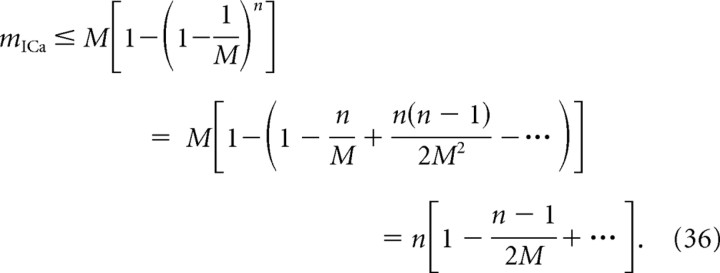 |
Therefore, mICa ≤ min(n,M).
If the release is partially saturated by the opening of several channels, the above expressions should be understood as upper bounds on the corresponding values of mICa and mCH. The case of complete saturation by a single channel corresponds to n = 0, and both cooperativity measures can be derived from the release probability, P(R) = 1 − (1 − po)M:
 |
Appendix B: Arbitrary Number of Nonequidistant Channels
Here we generalize Equations 19–22 to the case of M nonequidistant channels. Denoting P(R|k) the probability of release given a particular configuration “k” of open channels among the given M channel, release probability is given by the following:
 |
where the sum extends over L = 2M possible configurations, and N(k) denotes the number of channels that are open in a particular configuration. Contrary to the equidistant channel case, the values P(R|k) cannot be determined using any simplifying assumptions, but have to be computed numerically, using a 3D model of Ca2+ diffusion and binding. We then obtain the following:
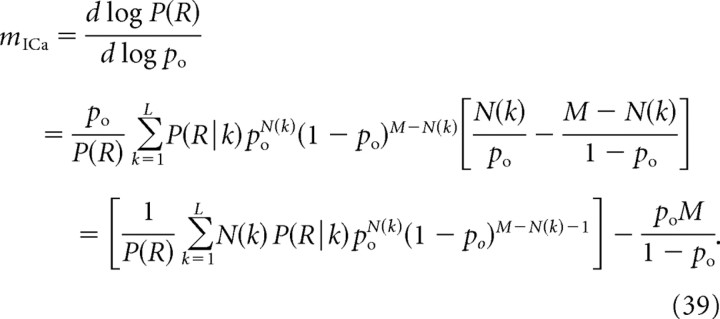 |
Denoting Ci(k) the Ca2+ concentration at the release site due to the opening of a single channel i among the N(k) channels that open in a particular configuration k, and denoting Cmax(k) the maximal among these Ci(k) values, the expression for mCH can be written as follows:
 |
Note that this generalizes Equation 21 for M = 2, in which case the sum extends over configurations k = {“00,” “01,” “10,” “11”}, among which k = “00” does not contribute since P(R|00) = 0, while for k = “01” and k = “10,” only one channel is open, so Cmax(k) is identical to the sum Ci(k), yielding a factor of unity in the brackets; finally, in the state k = “11,” the factor in the brackets equals (C01 + C10)/C10, in agreement with Equation 21.
Appendix C: Effect of Background Release Rate
For the sake of simplicity, the derivation of the Ca2+ channel and the Ca2+ current cooperativities of release for the case of two channels (Eqs. 11–13) ignores the contribution of background release rate due to the resting [Ca2+]. In other words, we assume P(R|0) = 0. However, for small values of intracellular Ca2+ at the release site, these expressions are modified as follows:
 |
where P(R|0) is the background resting release rate (release probability under condition that both channels are closed). Plugging this into Equation 9, we obtain the following:
 |
Similarly, Equation 13 becomes the following:
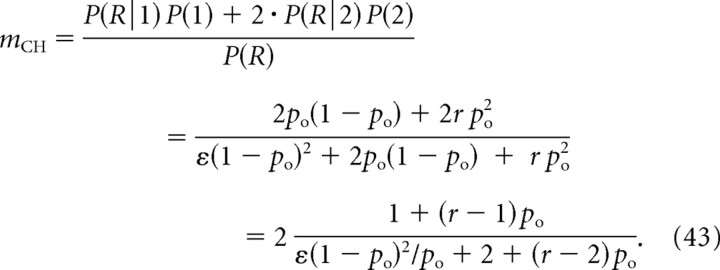 |
For the case of nonequidistant channels, Equation 19 is modified as follows:
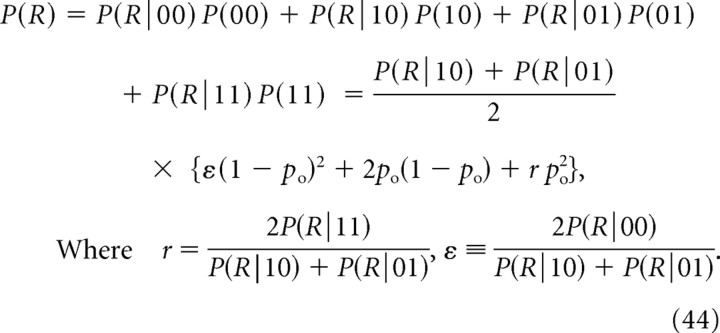 |
With this redefinition of parameters r and ε, Equation 42 for mICa remains valid, while the expression for current cooperativity, Equation 22, is transformed to the following:
 |
where f = po/[2(1 − po)] (cf. Eq. 22).
Footnotes
This work was supported by National Science Foundation Grants DMS-0817703 (to V.M.) and DMS-0613179 (to R.B.) and by the Intramural Research Program of the National Institutes of Health–National Institute of Diabetes and Digestive and Kidney Diseases (A.S.).
References
- Allbritton NL, Meyer T, Stryer L. Range of messenger action of calcium ion and inositol 1,4,5-trisphosphate. Science. 1992;258:1812–1815. doi: 10.1126/science.1465619. [DOI] [PubMed] [Google Scholar]
- Bertram R, Smith GD, Sherman A. Modeling study of the effects of overlapping Ca2+ microdomains on neurotransmitter release. Biophys J. 1999;76:735–750. doi: 10.1016/S0006-3495(99)77240-1. [DOI] [PMC free article] [PubMed] [Google Scholar]
- Beutner D, Voets T, Neher E, Moser T. Calcium dependence of exocytosis and endocytosis at the cochlear inner hair cell afferent synapse. Neuron. 2001;29:681–690. doi: 10.1016/s0896-6273(01)00243-4. [DOI] [PubMed] [Google Scholar]
- Bollmann JH, Sakmann B, Borst JG. Calcium sensitivity of glutamate release in a calyx-type terminal. Science. 2000;289:953–957. doi: 10.1126/science.289.5481.953. [DOI] [PubMed] [Google Scholar]
- Borst JGG, Sakmann B. Calcium influx and transmitter release in a fast CNS synapse. Nature. 1996;383:431–434. doi: 10.1038/383431a0. [DOI] [PubMed] [Google Scholar]
- Borst JGG, Sakmann B. Effects of changes in action potential shape on calcium currents and transmitter release in a calyx-type synapse of the rat auditory brainstem. Philos Trans R Soc Lond B Biol Sci. 1999;354:347–355. doi: 10.1098/rstb.1999.0386. [DOI] [PMC free article] [PubMed] [Google Scholar]
- Church PJ, Stanley EF. Single L-type calcium channel conductance with physiological levels of calcium in chick ciliary ganglion neurons. J Physiol. 1996;496:59–68. doi: 10.1113/jphysiol.1996.sp021665. [DOI] [PMC free article] [PubMed] [Google Scholar]
- Dodge FA, Jr, Rahamimoff R. Cooperative action of calcium ions in transmitter release at the neuromuscular junction. J Physiol. 1967;193:419–432. doi: 10.1113/jphysiol.1967.sp008367. [DOI] [PMC free article] [PubMed] [Google Scholar]
- Dunlap K, Luebke JI, Turner TJ. Exocytotic Ca2+ channels in mammalian central neurons. Trends Neurosci. 1995;18:89–98. [PubMed] [Google Scholar]
- Felmy F, Neher E, Schneggenburger R. Probing the intracellular calcium sensitivity of transmitter release during synaptic facilitation. Neuron. 2003;37:801–811. doi: 10.1016/s0896-6273(03)00085-0. [DOI] [PubMed] [Google Scholar]
- Gentile L, Stanley EF. A unified model of presynaptic release site gating by calcium channel domains. Eur J Neurosci. 2005;21:278–282. doi: 10.1111/j.1460-9568.2004.03841.x. [DOI] [PubMed] [Google Scholar]
- Glavinović MI, Rabie HR. Monte Carlo evaluation of quantal analysis in the light of Ca2+ dynamics and the geometry of secretion. Pflugers Arch. 2001;443:132–145. doi: 10.1007/s004240100631. [DOI] [PubMed] [Google Scholar]
- Heidelberger R, Heinemann C, Neher E, Matthews G. Calcium dependence of the rate of exocytosis in a synaptic terminal. Nature. 1994;371:513–515. doi: 10.1038/371513a0. [DOI] [PubMed] [Google Scholar]
- Keener JP, Sneyd J. New York: Springer; 1998. Mathematical physiology. [Google Scholar]
- Kits KS, de Vlieger TA, Kooi BW, Mansvelder HD. Diffusion barriers limit the effect of mobile calcium buffers on exocytosis of large dense cored vesicles. Biophys J. 1999;76:1693–1705. doi: 10.1016/S0006-3495(99)77328-5. [DOI] [PMC free article] [PubMed] [Google Scholar]
- Luo F, Dittrich M, Stiles JR, Meriney SD. Quantitative analysis of single channel openings and evoked transmitter release from active zones. Soc Neurosci Abstr. 2008;34:34–1. [Google Scholar]
- Matveev V. CalC (Calcium Calculator) simulation software, release version 6.0.5. 2008 Available at http://web.njit.edu/∼matveev/calc.html. [Google Scholar]
- Matveev V, Bertram R, Sherman A. Residual bound Ca2+ can account for the effects of Ca2+ buffers on synaptic facilitation. J Neurophysiol. 2006;96:3389–3397. doi: 10.1152/jn.00101.2006. [DOI] [PubMed] [Google Scholar]
- Meinrenken CJ, Borst JG, Sakmann B. Calcium secretion coupling at calyx of held governed by nonuniform channel-vesicle topography. J Neurosci. 2002;22:1648–1667. doi: 10.1523/JNEUROSCI.22-05-01648.2002. [DOI] [PMC free article] [PubMed] [Google Scholar]
- Meinrenken CJ, Borst JG, Sakmann B. Local routes revisited: the space and time dependence of the Ca2+ signal for phasic transmitter release at the rat calyx of Held. J Physiol. 2003;547:665–689. doi: 10.1113/jphysiol.2002.032714. [DOI] [PMC free article] [PubMed] [Google Scholar]
- Mintz IM, Sabatini BL, Regehr WG. Calcium control of transmitter release at a cerebellar synapse. Neuron. 1995;15:675–688. doi: 10.1016/0896-6273(95)90155-8. [DOI] [PubMed] [Google Scholar]
- Müller M, Felmy F, Schneggenburger R. A limited contribution of Ca2+ current facilitation to paired-pulse facilitation of transmitter release at the rat calyx of Held. J Physiol. 2008;586:5503–5520. doi: 10.1113/jphysiol.2008.155838. [DOI] [PMC free article] [PubMed] [Google Scholar]
- Quastel DM, Guan YY, Saint DA. The relation between transmitter release and Ca2+ entry at the mouse motor nerve terminal: role of stochastic factors causing heterogeneity. Neuroscience. 1992;51:657–671. doi: 10.1016/0306-4522(92)90305-l. [DOI] [PubMed] [Google Scholar]
- Reid CA, Bekkers JM, Clements JD. N- and P/Q-type Ca2+ channels mediate transmitter release with a similar cooperativity at rat hippocampal autapses. J Neurosci. 1998;18:2849–2855. doi: 10.1523/JNEUROSCI.18-08-02849.1998. [DOI] [PMC free article] [PubMed] [Google Scholar]
- Scheuber A, Miles R, Poncer JC. Presynaptic Cav2.1 and Cav2.2 differentially influence release dynamics at hippocampal excitatory synapses. J Neurosci. 2004;24:10402–10409. doi: 10.1523/JNEUROSCI.1664-04.2004. [DOI] [PMC free article] [PubMed] [Google Scholar]
- Schneggenburger R, Neher E. Intracellular calcium dependence of transmitter release rates at a fast central synapse. Nature. 2000;406:889–893. doi: 10.1038/35022702. [DOI] [PubMed] [Google Scholar]
- Schneggenburger R, Neher E. Presynaptic calcium and control of vesicle fusion. Curr Opin Neurobiol. 2005;15:266–274. doi: 10.1016/j.conb.2005.05.006. [DOI] [PubMed] [Google Scholar]
- Schneggenburger R, Meyer AC, Neher E. Released fraction and total size of a pool of immediately available transmitter quanta at a calyx synapse. Neuron. 1999;23:399–409. doi: 10.1016/s0896-6273(00)80789-8. [DOI] [PubMed] [Google Scholar]
- Shahrezaei V, Delaney KR. Consequences of molecular-level Ca2+ channel and synaptic vesicle colocalization for the Ca2+ microdomain and neurotransmitter exocytosis: a monte carlo study. Biophys J. 2004;87:2352–2364. doi: 10.1529/biophysj.104.043380. [DOI] [PMC free article] [PubMed] [Google Scholar]
- Shahrezaei V, Delaney KR. Brevity of the Ca2+ microdomain and active zone geometry prevent Ca2+-sensor saturation for neurotransmitter release. J Neurophysiol. 2005;94:1912–1919. doi: 10.1152/jn.00256.2005. [DOI] [PubMed] [Google Scholar]
- Shahrezaei V, Cao A, Delaney KR. Ca2+ from one or two channels controls fusion of a single vesicle at the frog neuromuscular junction. J Neurosci. 2006;26:13240–13249. doi: 10.1523/JNEUROSCI.1418-06.2006. [DOI] [PMC free article] [PubMed] [Google Scholar]
- Stanley EF. The calcium channel and the organization of the presynaptic transmitter release face. Trends Neurosci. 1997;20:404–409. doi: 10.1016/s0166-2236(97)01091-6. [DOI] [PubMed] [Google Scholar]
- Wölfel M, Schneggenburger R. Presynaptic capacitance measurements and Ca2+ uncaging reveal submillisecond exocytosis kinetics and characterize the Ca2+ sensitivity of vesicle pool depletion at a fast CNS synapse. J Neurosci. 2003;23:7059–7068. doi: 10.1523/JNEUROSCI.23-18-07059.2003. [DOI] [PMC free article] [PubMed] [Google Scholar]
- Wu LG, Westenbroek RE, Borst JG, Catterall WA, Sakmann B. Calcium channel types with distinct presynaptic localization couple differentially to transmitter release in single calyx-type synapses. J Neurosci. 1999;19:726–736. doi: 10.1523/JNEUROSCI.19-02-00726.1999. [DOI] [PMC free article] [PubMed] [Google Scholar]
- Yoshikami D, Bagabaldo Z, Olivera BM. The inhibitory effects of omega-conotoxins on Ca channels and synapses. Ann N Y Acad Sci. 1989;560:230–248. doi: 10.1111/j.1749-6632.1989.tb24100.x. [DOI] [PubMed] [Google Scholar]
- Zucker RS, Fogelson AL. Relationship between transmitter release and presynaptic calcium influx when calcium enters through discrete channels. Proc Natl Acad Sci U S A. 1986;83:3032–3036. doi: 10.1073/pnas.83.9.3032. [DOI] [PMC free article] [PubMed] [Google Scholar]


