

Abstract
Solution-phase hydrogen/deuterium exchange (HDX) monitored by high-resolution FT-ICR mass spectrometry offers a rapid method to study protein conformations and protein-protein interactions. Pepsin is usually used to digest proteins in HDX and is known as lack of cleavage specificity. To improve digestion efficiency and specificity, we have optimized digestion conditions and cleavage preferences for pepsin and protease type XIII from Aspergillus saitoi. A dilution series of the proteases was used to determine the digestion efficiency for several test proteins. Protease type XIII prefers to cleave on the C-terminal end of basic amino acids and produced the highest number of fragments and the best sequence coverage compared to pepsin or protease type XVIII from Rhizhopus. Furthermore, protease type XIII exhibited much less self-digestion than pepsin, and thus is superior for HDX experiments. Many highly overlapped segments from protease type XIII and pepsin digestion, combined with high-resolution FT-ICR mass spectrometry, provide high sequence resolution (to as few as one or two amino acids) for the assignment of amide hydrogen exchange rate. Our H/D exchange results correlate well with the secondary and tertiary structure of myoglobin. Such assignments of highly overlapped fragments promise to greatly enhance the accuracy and sequence resolution for determining conformational differences resulting from ligand binding or protein-protein interactions.
Introduction
The combination of mass spectrometry with solution-phase hydrogen/deuterium exchange (HDX) has become a powerful method to study protein structure and protein/protein interactions 1-5. High-resolution mass analysis (such as FT-ICR MS 6) is particularly advantageous for accurately assigning the peptide fragments after protease digestion and in resolving overlap of peptide isotopic distributions, both before and after HDX 4, 7. The reliability and sequence resolution of solution-phase HDX monitored by mass spectrometry has been hampered by the limited number and poor specificity of proteases that are active at the low pH necessary to quench HDX. Pepsin has previously been the protease of choice for such experiments because of its activity at low pH and its broad specificity (yielding a wide variety of peptides). However, incomplete cleavage of some proteins and limited number of proteolytic peptides has restricted its range of applicability. Recently, Cravello et al. 8 reported the use of two other enzymes (protease type XIII from Aspergillus saitoi and protease type XVIII from Rhizhopus), and Man et al. 9 used pepsin and protease type XIII to study the interaction of myoglobin with lipidic vesicles. However, those two papers did not compare the digestion and ionization efficiency of the two proteases.
Here, we compare and optimize the digestion efficiencies, sequence coverage, and cleavage specificity for pepsin, protease type XIII, and protease type XVIII. By use of high resolution 14.5 T FT-ICR mass analysis, we obtain many more fragments (96 vs. 27 for protease type XIII and 77 vs. 20 for pepsin) with higher maaa accuracy (better than 1 ppm) compared to Man et al. We thus resolve many more overlapped peptide isotopic distributions and dramatically increase sequence resolution to assign hydrogen deuterium exchange rates. We also compare the extent of self-digestion for pepsin and protease type XIII. Proteolysis was performed under HDX quench conditions (pH ∼2.3-2.5 and temperature ∼0 ºC). We also evaluated RAGE (Receptor for Advanced Glycosylated End Products) protein (∼35 kDa), both E. coli expressed (without glycosylation) and baculovirus expressed (with glycosylation) 10, IPMS (α-isopropylmalate synthase, ∼70 kDa), c-Kit (a tyrosine kinase protein, ∼49 kDa), and FKBP (human recombinant [C22A] FK506-binding protein, ∼12 kDa) with pepsin and protease type XIII.
Experimental Procedures
Materials
Myoglobin from equine heart, protease type XIII from Aspergillus saitoi, protease type XVIII from Rhizhopus, and deuterium oxide were purchased from Sigma Aldrich (St. Louis, MO). Pepsin was purchased from Roche Applied Science (Indianapolis, IN).
Hydrogen/Deuterium Exchange and Proteolysis
The entire HDX experiment was automated with a LEAP robot (HTS PAL, Leap Technologies, Carrboro, NC) 11. A 5 μL stock myoglobin solution (80 μM) was mixed with 45 μL 50 mM sodium phosphate buffer in D2O (pH, 7.8) to initiate each H/D exchange period. Concentration for the stock solutions of RAGE protein, c-Kit were 20 μM; IPMS and FKBP were 40 μM. The HDX incubation periods were 0, 0.5, 1, 2, 4, 8, 15, 30, 60, 120, 240, and 480 min. For the blank control, there was no initial dilution in D2O. All HDX runs were performed in triplicate. Each HDX reaction was quenched by addition of protease solution in 1.0% (v/v) formic acid at 1:1 (v/v) to decrease the final pH to ∼2.3 to ∼2.5, followed by 2 min protease digestion and injection of the digested sample (30 μL) to a liquid chromatograph. HDX was performed at 0.4 ºC controlled by a Huber recirculating H2O bath (Peter Huber, Germany).
On-Line LC
A Jasco HPLC/SFC instrument (Jasco, Easton, MD) was interfaced to the LEAP robot to desalt and separate the peptides after proteolysis. The protein digest was injected to either a C5 column (Jupiter, Phenomenex [Torrance, CA], 1 mm × 50 mm, 5 μm particle size, 300 Å pore size) or a ProZap™ C18 column (Grace Davidson, Deerfield, IL), HR 1.5 μm particle size, 2.1 mm × 10 mm, 500 Å pore size). Peptides were eluted with a rapid gradient from 2% B to 95% B in 1.5 min (A: acetonitrile/H2O/formic acid, 5/94.5/0.5; B: acetonitrile/H2O/formic acid, 95/4.5/0.5), at a flow rate of 50 μL/min for the Jupiter™ C5 column or 0.3 mL/min for the ProZap™ C18 column. A post-column splitter directed the LC eluent at ∼400-500 nL/min for efficient microelectrospray ionization (micro-ESI) 12.
Micro-ESI FT-ICR MS, MS/MS, and Data Analysis
The microelectrosprayed LC eluent was directed into a custom-built 14.5 T FT-ICR mass spectrometer 13 with a Thermo Fisher Scientific LTQ front end 14, 15. FT-ICR mass spectra were collected from 400 < m/z < 2000 at high mass resolving power (m/δm50% = 200,000 at m/z 400). The total data acquisition period for each sample was 6 min. External ion accumulation 16 was performed in the linear ion trap with a target ion population of three million charges collected for each FT-ICR measurement. LTQ-accumulated ions were transferred (∼1 ms transfer period) through three octopole ion guides (2.2 MHz, 250 Vp-p) to a capacitively coupled 17 closed cylindrical ICR cell (55 mm I.D.) for analysis. Automatic gain control 14 and high magnetic field 18 provided excellent external calibration mass accuracy (typically better than 500 ppb rms). Data was collected with Xcalibur software (Thermo) and analyzed by an in-house package 7 permitting reliable identification and accurate assignment of the deuterium incorporation in each of the myoglobin fragments in the spectrum. The analysis algorithm takes full advantage of the high resolution/high mass accuracy of FT-ICR MS and permits the assignment of overlapped isotopic distributions for fragments of the same nominal m/z, even for partially resolved overlaps between species differing by 13C, 15N, and 2D. Supplemental Figure 1 illustrates the capability of 14.5 T FT-ICR MS to resolve overlapping peptide isotopic distributions, separated by as little as ∼15 mDa (and we have previously resolved separations less than 5 mDa7). Collision-induced dissociation (CID) MS/MS was performed in the LTQ to confirm peptide fragment sequences for the blank control to aid in exclusion of protease self-digested fragments.
Results and Discussion
Protease Digestion Optimization and Myoglobin Peptide Mapping
Digestion conditions were systematically optimized for each protease. The enzyme stock solutions of pepsin (∼1.4 mg/mL), protease type XIII (∼12.0 mg/mL), and protease type XVIII (∼20.0 mg/mL) were used separately to digest myoglobin. For a 2 min digestion, pepsin, protease type XIII, and protease type XVIII produced 48, 31, and 16 fragments, resulting in 96.7%, 60.1%, and 45.1% sequence coverage. A series of dilutions (2-fold, 5-fold, and 10-fold) of the stock protease solutions was prepared and evaluated. Pepsin at 1.4 mg/mL, protease type XIII at 1.2 mg/mL, and protease type XVIII at 2.0 mg/mL gave the best digestion efficiency, yielding 44, 57, and 26 fragments, and resulting in 88.2%, 94.8%, and 80.4% sequence coverage.
Figure 1 shows myoglobin peptide maps from digestion by pepsin (1.4 mg/mL), protease type XIII (1.2 mg/mL), and protease type XVIII (2.0 mg/mL), and subsequent separation with a reversed-phase Jupiter™ C5 column. Table 1 shows the number of proteolytic fragments, sequence coverage, average length of the peptide fragments, and optimized protease concentration for each protease. More and shorter fragments provide more overlapping fragments with higher sequence resolution of the protein backbone amides. A three-peptidase mixture produced low efficiency digestion of myoglobin relative to separate digestions (data not shown). Poor efficiency was attributed to protease digestion in the mixture. Protease type XVIII was the least efficient of the three proteases. To compensate for possible column overloading, we changed to a ProZap™ C18 column that accommodates high protein concentration, but still retains small peptides and provides a fast flow rate. Figure 2 demonstrates that with this high flow rate reversed-phase column, pepsin at 1.4 mg/mL and protease type XIII at 1.2 mg/mL each generate highly overlapped fragments. Table 2 shows the number of proteolytic fragments, sequence coverage, average length of the peptide fragments, and optimized protease concentration for pepsin and protease type XIII. Table 3 shows the 96 fragments from myoglobin produced by protease type XIII with sub-ppm mass assignment error.
Figure 1.

Myoglobin fragments following separate 2 min digestions by pepsin (∼1.4 mg/mL), protease type XIII (∼1.2 mg/mL), or protease type XVIII (∼2.0 mg/mL). Fragments were desalted and separated with a Jupiter™ C5 column. The structural units of myoglobin are represented above the primary sequence (same for Figure 2).
Table 1.
Myoglobin fragment number and sequence coverage for pepsin, protease type XIII, and protease type XVIII digestion, and subsequent separation with a reversed-phase HPLC C5 column (see Figure 1). Protease type XIII yielded the most fragments with short average length compared to pepsin. Protease type XVIII produced the shortest fragments, but with low cleavage efficiency.
| Pepsin | Protease type XIII | Protease type XVIII | |
|---|---|---|---|
| Number of Fragments | 48 | 57 | 26 |
| Sequence Coverage | 96.7% | 94.8% | 80.4% |
| Average Length | 15 aa | 10 aa | 9 aa |
| Optimal Protease Concentration | 1.4 mg/mL | 1.2 mg/mL | 2.0 mg/mL |
Figure 2.

Myoglobin peptide maps from separate digestion by pepsin (∼1.4 mg/mL) and protease type XIII (∼1.2 mg/mL). Fragments were desalted and separated with a ProZap™ C18 column. Retention time was reduced to 1.5 min (compared to 4.5 min with a Jupiter™ C5 column).
Table 2.
Myoglobin fragment assignment for pepsin and protease type XIII digestions, and subsequent separation with a Pro ZAP™ C18 column (see Figure 2). Protease type XIII yields greater sequence coverage with shorter average peptide length than pepsin. Protease type XIII improves the sequence coverage and increases the accuracy of deuterium uptake assignment.
| Pepsin | Protease type XIII | |
|---|---|---|
| Number of Fragments | 77 | 96 |
| Sequence Coverage | 98.7% | 99.8% |
| Average Length | 17 aa | 15 aa |
| Optimal Protease Concentration | 1.4 mg/mL | 1.2 mg/mL |
Table 3.
Myoglobin fragments produced by protease type XIII digest and separated with a ProZap™ C18 columna.
| Fragment Sequence | Charge | Mono m/z | Mono mass | Error (ppm) |
|---|---|---|---|---|
| ADIAGHGQEVL | 2 | 555.2828 | 1108.5509 | 0.33 |
| ADIAGHGQEVL | 1 | 1109.5583 | 1108.551 | 0.25 |
| ADIAGHGQEVLIR | 3 | 460.2527 | 1377.7362 | 0.22 |
| ADIAGHGQEVLIR | 2 | 689.8753 | 1377.7361 | 0.29 |
| AELKPLAQSH | 2 | 547.3037 | 1092.5928 | -0.04 |
| AIIH | 1 | 453.282 | 452.2747 | 0.12 |
| ALEL | 1 | 445.2657 | 444.2584 | 0.09 |
| ATKHKIPIKYL | 3 | 437.9431 | 1310.8075 | 0.01 |
| ATKHKIPIKYLEFISDAIIHVLHSKHPG--DFGADAQGAMTKALELFRNDIAAKYKELGFQG | 7 | 950.7946 | 6648.5112 | -0.07 |
| ATKHKIPIKYLEFISDAIIHVLHSKHPG--DFGADAQGAMTKALELFRNDIAAKYKELGFQG | 8 | 832.0718 | 6648.5157 | -0.75 |
| ATKHKIPIKYLEFISDAIIHVLHSKHPG--DFGADAQGAMTKALELFRNDIAAKYKELGFQG | 9 | 739.731 | 6648.5128 | -0.32 |
| DAIIH | 1 | 568.309 | 567.3017 | 0.03 |
| DGEWQQVL | 1 | 974.4584 | 973.4511 | -0.55 |
| DLKKHGTVVL | 2 | 555.3377 | 1108.6607 | -0.2 |
| EFIS | 1 | 495.245 | 494.2378 | -0.1 |
| EFISD | 1 | 610.2717 | 609.2644 | 0.41 |
| EFISDAIIH | 2 | 522.7715 | 1043.5285 | 0.32 |
| EFISDAIIH | 1 | 1044.5354 | 1043.5282 | 0.61 |
| ELFRND | 1 | 793.3836 | 792.3764 | 0.39 |
| ELKPLAQSH | 2 | 511.7851 | 1021.5556 | 0.04 |
| FDKFKHLKTE | 3 | 431.5714 | 1291.6922 | 0.21 |
| FDKFKHLKTE | 2 | 646.8533 | 1291.6921 | 0.32 |
| FDKFKHLKTEAE | 3 | 498.2648 | 1491.7725 | -0.19 |
| FKHLKTE | 2 | 451.7584 | 901.5021 | 0.09 |
| FRND | 1 | 551.2572 | 550.25 | 0.09 |
| FTGH | 1 | 461.2143 | 460.2071 | 0.05 |
| FTGHPETLEK | 2 | 579.7933 | 1157.572 | -0.23 |
| GFQG | 1 | 408.1878 | 407.1805 | 0.07 |
| GGILKKKGHHEAELK | 4 | 411.994 | 1643.9468 | 0.23 |
| GGILKKKGHHEAELK | 3 | 548.9896 | 1643.9468 | 0.21 |
| GGILKKKGHHEAELKPLAQSH | 4 | 570.3248 | 2277.27 | 0.25 |
| GGILKKKGHHEAELKPLAQSH | 3 | 760.0979 | 2277.2718 | -0.52 |
| GGILKKKGHHEAELKPLAQSH | 5 | 456.4613 | 2277.2698 | 0.33 |
| GHPETLEK | 2 | 455.735 | 909.4554 | 0.21 |
| GILKKKGHHEAELKPLAQSH | 4 | 556.0695 | 2220.2489 | 0.11 |
| GLSDGE | 1 | 577.2464 | 576.2391 | 0.15 |
| GLSDGEWQQVL | 2 | 616.3011 | 1230.5876 | 0.38 |
| GLSDGEWQQVLNVWGKVE | 3 | 682.0096 | 2043.007 | -0.41 |
| GLSDGEWQQVLNVWGKVE | 2 | 1022.5105 | 2043.0064 | -0.11 |
| GLSDGEWQQVLNVWGKVEADIAGHGQEVL | 3 | 1045.5239 | 3133.5497 | -0.89 |
| GLSDGEWQQVLNVWGKVEADIAGHGQEVL--IRLFTGHPETLEKFDK | 6 | 841.9359 | 5045.5712 | -0.73 |
| GTVVL | 1 | 488.3082 | 487.301 | -0.67 |
| HPGDFGADAQGAMTK | 2 | 751.8385 | 1501.6623 | -0.2 |
| HPGDFGADAQGAMTKAL | 3 | 562.935 | 1685.783 | 0.11 |
| HPGDFGADAQGAMTKAL | 2 | 843.8989 | 1685.7832 | -0.02 |
| HPGDFGADAQGAMTKALEL | 3 | 643.6443 | 1927.9109 | -0.54 |
| HSKHPGDFGADAQGAMTK | 3 | 618.9567 | 1853.8482 | -0.14 |
| IAGHGQEVL | 2 | 462.251 | 922.4874 | -0.11 |
| IAGHGQEVLIR | 2 | 596.8436 | 1191.6727 | -0.19 |
| ILKKKGHHEAELKPLAQSH | 4 | 541.8144 | 2163.2285 | -0.38 |
| IRLF | 1 | 548.3554 | 547.3481 | 0.23 |
| KASEDLKKHGTVVL | 3 | 508.9631 | 1523.8673 | -0.12 |
| KKGHHEAELKPLAQSH | 4 | 453.2484 | 1808.9644 | 0.08 |
| KKGHHEAELKPLAQSH | 3 | 603.9954 | 1808.9643 | 0.14 |
| KKKGHHEAELKPLAQSH | 3 | 646.6937 | 1937.059 | 0.27 |
| KKKGHHEAELKPLAQSH | 4 | 485.2721 | 1937.0593 | 0.13 |
| KYKEL | 1 | 680.3975 | 679.3903 | 0.37 |
| LFRND | 1 | 664.3418 | 663.3345 | -0.7 |
| LFTGHPETL | 2 | 507.7664 | 1013.5182 | 0.07 |
| LFTGHPETLEK | 2 | 636.3353 | 1270.656 | -0.15 |
| LFTGHPETLEK | 3 | 424.5592 | 1270.6555 | 0.19 |
| LGGILKKKGHHEAE | 3 | 506.2914 | 1515.8522 | -0.02 |
| LKKHGTVV | 2 | 441.2821 | 880.5496 | -0.19 |
| LKKHGTVVL | 2 | 497.824 | 993.6334 | 0.15 |
| LKKKGHHEAELKPLAQSH | 4 | 513.5433 | 2050.1438 | -0.1 |
| NVWGK | 1 | 603.325 | 602.3177 | 0.01 |
| NVWGKVE | 1 | 831.4358 | 830.4285 | 0.25 |
| NVWGKVE | 2 | 416.2216 | 830.4285 | 0.22 |
| PETLEK | 1 | 716.3825 | 715.3752 | 0.1 |
| PGDFGADAQGAMTK | 2 | 683.3085 | 1364.6024 | 0.53 |
| PLAQSH | 1 | 652.3415 | 651.3342 | -0.2 |
| SKHPGDFGADAQGAMTKAL | 3 | 634.644 | 1900.9102 | -0.01 |
| SKHPGDFGADAQGAMTKALELFRND--IAAKYKELGFQG | 5 | 797.2049 | 3980.9879 | -0.91 |
| TALGGIL | 1 | 644.3978 | 643.3906 | -0.08 |
| TALGGILKKKGHHEA | 3 | 520.6386 | 1558.8938 | 0.36 |
| TALGGILKKKGHHEAELK | 4 | 483.2864 | 1929.1164 | -0.22 |
| TALGGILKKKGHHEAELKPLAQSH | 5 | 513.4951 | 2562.4391 | 0.11 |
| TALGGILKKKGHHEAELKPLAQSH | 4 | 641.6172 | 2562.4395 | -0.04 |
| TGHPETLEK | 2 | 506.2588 | 1010.503 | 0.27 |
| TGHPETLEKFD | 2 | 637.3068 | 1272.5991 | -0.31 |
| VLHSKHPGDFGADAQ | 3 | 526.9267 | 1577.7582 | 0.27 |
| VLHSKHPGDFGADAQGAMTK | 3 | 689.6741 | 2066.0004 | -0.02 |
| VLHSKHPGDFGADAQGAMTK | 4 | 517.5073 | 2065.9998 | 0.29 |
| VLHSKHPGDFGADAQGAMTKAL | 4 | 563.5377 | 2250.1214 | 0.06 |
| VLHSKHPGDFGADAQGAMTKAL | 3 | 751.048 | 2250.1222 | -0.29 |
| VLHSKHPGDFGADAQGAMTKALEL | 4 | 624.0692 | 2492.2475 | 0.27 |
| VLHSKHPGDFGADAQGAMTKALEL | 3 | 831.7564 | 2492.2474 | 0.33 |
| VLHSKHPGDFGADAQGAMTKALEL--FRNDIAAKYKELGFQG | 6 | 722.707 | 4330.1978 | -0.49 |
| VLHSKHPGDFGADAQG--AMTKALELFRNDIAAKYKELGFQG | 5 | 867.0473 | 4330.1998 | -0.94 |
| VLNVWGKVE | 2 | 522.2978 | 1042.5809 | 0.21 |
| WGKVE | 1 | 618.3244 | 617.3172 | 0.31 |
| WQQVL | 1 | 673.3667 | 672.3595 | 0.16 |
| YKEL | 1 | 552.3027 | 551.2954 | 0.2 |
| YKELGFQG | 1 | 941.4727 | 940.4654 | 0.06 |
| YLE | 1 | 424.2079 | 423.2006 | -0.01 |
| YLEF | 1 | 571.2763 | 570.269 | -0.03 |
96 fragments were assigned with sub-ppm mass accuracy, to yield 99.8% sequence coverage, with an average length of 15 aa. Each listed mass is for the monoisotopic neutral mass.
Enhanced Cleavage and Ionization Efficiency by Protease Type XIII
Pepsin produced fewer fragments than protease type XIII: 41 vs. 90 for RAGE protein and 211 vs. 238 for IPMS. Sequence coverage for pepsin was also more limited than for protease type XIII: 68% vs. 94% for RAGE and 87% vs. 94% for IPMS. Moreover, the average fragment from protease type XIII was ∼2 amino acids shorter than for pepsin, allowing higher sequence resolution. Reproducibility for our three-trial parallel experiments and several repeats was good (typically to within 5%). Furthermore, the same fragments with different charge states showed the same extent of deuterium incorporation, further validating deuterium incorporation for that fragment.
Cleavage preferences for proteases were based on the ratio of the number of fragments with a specific C-terminal amino acid to the total number of that amino acid in the protein sequence. Figure 3 shows the cleavage preferences (top 10 preferred amino acids, for pepsin and protease type XIII, based on aggregate results from myoglobin, IPMS, c-Kit, RAGE, and FKBP proteins). Cleavage preferences refer to the carboxyl-terminal amino acid following proteolysis. Our observed cleavage preferences for pepsin (Figure 3, top panel) are similar to those reported by Smith and Zhang 2. Shintani and Ichishima et al. 19 reported the cloning and expression of protease type XIII. They also investigated cleavage specificity and determined that protease type XIII generally favors hydrophobic residues and has specificity for the Lys-Ile bond. For the proteins in this study, protease type XIII prefers to cleave on the C-terminal side of basic amino acids, i.e., histidine, arginine and lysine (3 of the top 4 preferred cleavages: Figure 3, bottom). Under positive-ion electrospray conditions, basic amino acids side chains are protonated, to yield abundant positive ions during ESI, resulting in increased signal-to-noise ratio for protease type XIII cleaved fragments. Increased signal-to-noise ratio is especially useful to accurately assign deuterium incorporation for HDX analysis by MS, due to the reduction in signal for ion isotopic distributions after extensive deuterium incorporation.
Figure 3.

Pepsin (top) and protease type XIII (bottom) cleavage preferences for myoglobin, IPMS, RAGE and c-Kit proteins. The Preference Ratio is the number of fragments with the specified C-terminal amino acid divided by the total number of that specific amino acid in the protein.
The digestion results for FKBP further support the cleavage preference by protease type XIII. Basic amino acids (Lys and Arg) are highly concentrated in the middle ∼40 amino acids segment of the FKBP primary sequence. Protease type XIII at ∼1.2 mg/mL digestion resulted in missed coverage in that region of the protein, whereas pepsin digestion covered the same region (with two long peptic fragments). We infer that protease type XIII over-digested that region and the resulting small fragments with high charge state (low m/z value), were not detected in our experiment (detection range, 400 <m/z < 2000). Excluding the missed covered portion, digestion still showed that protease type XIII selectively cleaves on the C-terminal end of basic amino acids His, Lys and Arg, as well as the hydrophobic amino acids Phe and Leu.
Self-digestion was also investigated for pepsin and protease type XIII. One hour after the protease solutions were prepared, they were injected and separated by LC and analyzed by FT-ICR MS. Protease type XIII showed much less self-digestion than pepsin. Pepsin self-digestion produced 164 fragments spanning 91% of its primary sequence (Swiss-Prot ID: P00791), whereas protease type XIII self-digestion resulted in 28 fragments spanning only 29% of its primary sequence (Swiss-Prot ID: Q12567).
High Sequence Resolution Provided by Protease Type XIII and Pepsin
Although both pepsin and protease type XIII exhibit preference for cleavage sites, their cleavage specificities are relatively broad compared to other proteases (e.g., trypsin). The low specificity results in a high percentage of overlapping fragments, enabling the assignment of deuterium incorporation to relatively small segments of the protein. As illustrated by Figure 2, many overlapping fragments span myoglobin amino acid residues 20-50 and 60-114, composed of mainly protease type XIII fragments and some pepsin fragments.
From separate HDX experiments with pepsin and protease type XIII, we generated deuterium incorporation number vs. HDX incubation period with our in-house peak assignment algorithm 7, followed by maximum entropy method (MEM) evaluation of the H/D exchange rate distribution 20. Figures 4 and 5 demonstrate the increased sequence resolution (sometimes to a single backbone amide hydrogen) obtained by combining the data from separate pepsin and protease type XIII digestions. The resolved exchange rates are consistent with the myoglobin 3-D structure.
Figure 4.
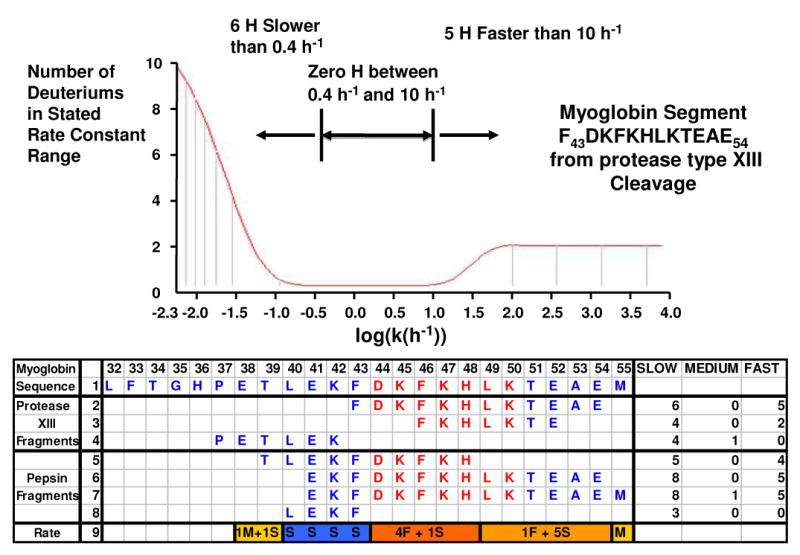
Digestion with both pepsin and protease type XIII to increase sequence resolution within myoglobin segment 32-55. Top: HDX rate constant distribution based on maximum entropy method fit to the deuterium incorporation vs. time profile for the protease type XIII digest fragment 43-54. Bottom: Assigned slow-, intermediate-, and fast-exchanging amide hydrogens for seven peptides spanning positions 32-55. Amide hydrogens from the loop region 44-50 are shown in red. The numbers of fast- (F), medium- (M) and slow- (S) exchanging hydrogens are listed in line 9 (see text). Amino acids 40L, 41E, 42K, and 43F were identified as slow-exchanging hydrogens (blue). Of the 2 medium-exchanging hydrogens, one was narrowed down to segment 38-39 (gold), and another to amino acid 55M (gold). Four fast-exchanging hydrogens could be narrowed down to segment 44-48 (orange) and one another to segment 49-54 (light orange).
Figure 5.
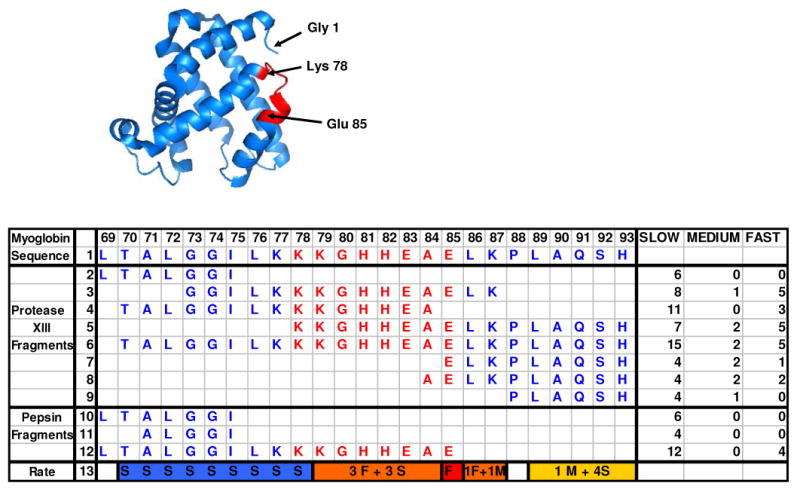
MEM assigned exchange rates for increased sequence resolution for myoglobin segment 69-93. Amide hydrogens from the loop region 78-85 are shown in red (see the inserted myoglobin 3-D structure). From the exchange rates of the 11 overlapping fragments, we assigned the number of fast- (F), medium- (M) and slow- (S) exchanging hydrogens to line 13 (see text). The amide hydrogen on amino acid 85E (in red) was identified as fast-exchanging. Three fast-exchanging hydrogens were narrowed down to segment 79-84 (in orange) and another to either 86L or 87K (orange). Of the two assigned medium-exchanging hydrogens, one is on either 86L or 87K, and another on segment 89-93 (gold). All of the backbone amide hydrogens on segment 70-77 (blue) were slow-exchanging hydrogens.
Figure 4 (top) shows an MEM-generated amide H/D exchange rate distribution for myoglobin protease type XIII fragment 43-54. There were 5 fast-exchanging hydrogens (k > 10 h-1) and 6 slow-exchanging hydrogens (k < 0.4 h-1). The bottom panel lists the numbers of slow-, intermediate-, and fast-exchanging amide hydrogens for 7 fragments (3 from protease type XIII and 4 from pepsin) within the longer 32-55 segment. There were 5 fast exchanging hydrogens in the protease type XIII fragment 43-54. Because segment 41-54 also has only 5 fast exchanging hydrogens, amino acids 42K and 43F are evidently protected against exchange by their participation in helix C (see Figure 2). The N-terminal hydrogen of amino acid E41 exchanges D or H very rapidly during the HDX period (but also back-exchanges H for D during proteolysis and)--hence, no exchange kinetics can be determined for the N-terminal amino acid of a proteolytic peptide, no matter how fast or slow it exchanges in the intact protein. The protease type XIII fragment 37-42 and the pepsin fragment 40-43 have no fast-exchanging amide hydrogens, consistent with their location in helix C. Several other fragments from 20-43 also have no or only one fast exchanging amide hydrogens (data not shown). From comparison of segments 39-48 and 40-43, it is possible to assign the 3 slow-exchanging hydrogens to 41E, 42K and 43F, and 4 fast-exchanging hydrogens to segment 44-48. Further comparison of these two segments with segment 37-42 localizes the one medium-exchanging amide hydrogen to residue 38E or 39T. Adding the 3 slow-exchanging amide hydrogens from segment 39-43 identifies residue 40L as slow exchanging. From the results for segments 41-54 and 41-55, we can identify the medium-exchanging hydrogen to be on amino acid 55M. Comparison of segments 39-48 and 41-54 allows assignment of one fast-exchanging hydrogen to segment 49-54. Results from other segments further corroborate those assignments. Combination of all of these results indicates that the 5 fast-exchanging amide hydrogens are in segment 44-54 connecting the two helices, consistent with the 44-50 loop in the 3-D structure of myoglobin.
Another example of the use of overlapped fragments from protease type XIII and pepsin to improve sequence resolution for myoglobin is illustrated by Figure 5. In the myoglobin 3-D structure (see insert), the sequence 78-85 (depicted in red) connects helix E (spans amino acid 58-77) and helix F (spans amino acid 86-95). It is in an exposed loop and should have higher deuterium incorporation rate. The rate distribution of 11 fragments (8 from protease type XIII and 3 from pepsin) was generated by MEM fitting. In segment 69-75, generated from both protease type XIII and pepsin, and in segment 71-75, all of the amide hydrogens are slow-exchanging. Given that fragment 88-93 has one medium-exchanging and 4 slow-exchanging hydrogens, we can identify them to be in 89-93 (proline has no amide hydrogen on its N-terminal side and it is on the N-terminal of the segment). From the results for segments 84-93 and 85-93, we can identify one fast-exchanging hydrogen to amino acid 85E and one other fast-exchanging hydrogen to amino acid 86L or 87K. Given that both protease type XIII segments 78-93 and 70-93 have 5 fast- and 2 medium-exchanging amide hydrogens, we can further infer that the hydrogens on segment 71-78 are all slow-exchanging, and the 3 fast exchanging hydrogens are on segment 79-84 (the hydrogen on the N-terminus of a segment is not measurable). The results from the overlapping assignment match well with the myoglobin 3-D structure, namely that segment 78-85 in the loop connecting two helices has higher exchange rate. These results strongly support the use of H/D exchanged monitored by high-resolution mass spectrometry to reveal protein structure with high sequence resolution.
NMR HDX analysis has been performed on sperm whale myoglobin 21, 22. Here, we analyzed horse heart myoglobin. Those two myoglobins share ∼87% sequence identity. Moreover, we used different buffers at different pH, so the conformations are not directly comparable. Nevertheless, our conclusions are highly similarity to those from NMR. The exchange rates are consistent with myoglobin's secondary structure: i.e., higher exchange rate in loops connecting two helices and lower exchange rate in the helices.
Conclusions
Digestion efficiency was optimized for several proteins with both pepsin and protease type XIII. Protease type XIII cleavage preferences at the carboxyl end of basic amino acids provide efficient electrospray ionization and subsequent MS detection. Efficient ionization is especially useful for HDX analysis by MS, due to higher signal-to-noise ratio for the peptide ion isotopic distributions, particularly after extensive deuterium incorporation. Protease type XIII was superior to pepsin based on our results for myoglobin and several other proteins, by producing more fragments and better sequence coverage, as well as producing smaller average fragment length. Furthermore, protease type XIII was less prone to self-digestion than pepsin. In summary, protease type XIII produces more fragments of shorter length, with increased S/N than pepsin, thus enhancing the sequence resolution for deuterium uptake. Protease type XIII thus appears to be the enzyme of choice for HDX MS analysis of protein conformation and protein-ligand interactions. H/D exchange for myoglobin with protease type XIII and pepsin confirms the 3-D solution structure of myoglobin by accurately locating fast- and slow-exchanging amide hydrogens in the loops and α-helices. Often the site of deuterium exchange can be localized to short amino acid segments (sometimes to one or two amino acids). The range of applications of HDX coupled with high resolution FT-ICR MS in exploring protein conformational differences from protein-ligand and protein-protein interactions may thus be extended to larger proteins than previously possible.
Supplementary Material
Micro-ESI FT-ICR mass spectra of myoglobin fragments 119-135 (*, 3+ charge state, monoisotopic m/z 562.935) and 114-135 (Δ, 4+ charge state, monoisotopic m/z 563.538). Those fragments were generated by protease type XIII digestion and LC separation with a ProZap C18 column. Their isotopic distributions overlap after certain periods of deuterium incubation. High-resolution FT-ICR MS detection, combined with our data analysis algorithm, enables accurate assignment of the fragments and accurate calculation of deuterium incorporation for each fragment.
Acknowledgments
The authors thank Xiu Yu and Michael Greig at Pfizer, La Jolla, CA, Patrick Frantom at Albert Einstein College of Medicine, NY, Shaun McLoughlin and Robert Johnson at Abbott Laboratories, IL, and Jyotica Batra at Florida State University for providing samples. This work was supported by NIH (GM-78359), NSF Division of Materials Research through DMR-0654118 and the State of Florida.
Abbreviations
- HDX
hydrogen/deuterium exchange
- FT-ICR
Fourier transform ion cyclotron resonance
- MS
mass spectrometry
- LC
liquid chromatograph
- ESI
electrospray ionization
- LTQ
linear quadrupole ion trap
- RAGE
Receptor for Advanced Glycosylated End Products
- FKBP
human recombinant [C22A] FK506-binding protein
- IPMS
α-isopropylmalate synthase
- c-Kit
a tyrosine kinase protein
References
- 1.Zhang Z, Smith DL. Protein Sci. 1993;2:522–531. doi: 10.1002/pro.5560020404. [DOI] [PMC free article] [PubMed] [Google Scholar]
- 2.Smith DL, Deng Y, Zhang Z. J Mass Spectrom. 1997;32:135–146. doi: 10.1002/(SICI)1096-9888(199702)32:2<135::AID-JMS486>3.0.CO;2-M. [DOI] [PubMed] [Google Scholar]
- 3.Lanman JK, Lam TT, Barnes S, Sakalian M, Emmett MR, Marshall AG, Prevelige PE. J Mol Biol. 2003;325:759–772. doi: 10.1016/s0022-2836(02)01245-7. [DOI] [PubMed] [Google Scholar]
- 4.Lam TT, Lanman JK, Emmett MR, Hendrickson CL, Marshall AG, Prevelige PE. J Chromatogr A. 2002;982:85–95. doi: 10.1016/s0021-9673(02)01357-2. [DOI] [PubMed] [Google Scholar]
- 5.Engen JR, Smith DL. Anal Chem. 2001;73:256A–265A. doi: 10.1021/ac012452f. [DOI] [PubMed] [Google Scholar]
- 6.Marshall AG, Hendrickson CL, Jackson GS. Mass Spectrom Rev. 1998;17:1–35. doi: 10.1002/(SICI)1098-2787(1998)17:1<1::AID-MAS1>3.0.CO;2-K. [DOI] [PubMed] [Google Scholar]
- 7.Kazazic S, Emmett MR, Blakney GT, Hendrickson CL, Marshall AG. Proc 54th Amer Soc Mass Specttrom Ann Conf on Mass Spectrometry & Allied Topics; Seattle, WA. 2006. [Google Scholar]
- 8.Cravello L, Lascoux D, Forest E. Rapid Commun Mass Spectrom. 2003;17:2387–2393. doi: 10.1002/rcm.1207. [DOI] [PubMed] [Google Scholar]
- 9.Man P, Montagner C, Vernier G, Dublet B, Chenal A, Forest E, Forge V. J Mol Biol. 2007;368:464–472. doi: 10.1016/j.jmb.2007.02.014. [DOI] [PubMed] [Google Scholar]
- 10.Evans SV, Brayer GD. J Biol Chem. 1988;263:4263–4268. [PubMed] [Google Scholar]
- 11.Kazazic S, Nilsson CL, Emmett MR, Marshall AG. 5th North American FT-ICR Mass Spectrometry Conference; Key West, Florida. 2005. [Google Scholar]
- 12.Emmett MR, Caprioli RM. J Am Soc Mass Spectrom. 1994;5:605–613. doi: 10.1016/1044-0305(94)85001-1. [DOI] [PubMed] [Google Scholar]
- 13.Schaub TM, Hendrickson CL, Horning S, Quinn JP, Senko MW, Marshall AG. Anal Chem. 2008;80:3985–3990. doi: 10.1021/ac800386h. [DOI] [PubMed] [Google Scholar]
- 14.Schwartz JC, Senko MW, Syka JEP. J Am Soc Mass Spectrom. 2002;13:659–669. doi: 10.1016/S1044-0305(02)00384-7. [DOI] [PubMed] [Google Scholar]
- 15.Syka JEP, Marto JA, Bai DL, Senko MW, Schwartz JC, Ueberheide B, Garcia B, Busby SA, Muratore T, Shabanowitz J, Hunt DF. J Proteome Res. 2004;3:621–626. doi: 10.1021/pr0499794. [DOI] [PubMed] [Google Scholar]
- 16.Senko MW, Hendrickson CL, Emmett MR, Shi SDH, Marshall AG. J Am Soc Mass Spectrom. 1997;8:970–976. [Google Scholar]
- 17.Beu SC, Laude DA. Anal Chem. 1992;64:177–180. [Google Scholar]
- 18.Marshall AG, Guan S. Rapid Commun Mass Spectrom. 1996;10:1819–1823. doi: 10.1002/(SICI)1097-0231(199611)10:14<1855::AID-RCM764>3.0.CO;2-B. [DOI] [PubMed] [Google Scholar]
- 19.Shintani T, Ichishima E. Biochim Biophys Acta. 1994;1204:257–264. doi: 10.1016/0167-4838(94)90016-7. [DOI] [PubMed] [Google Scholar]
- 20.Zhang Z, Li W, Logan TM, Li M, Marshall AG. Protein Sci. 1997;6:2203. doi: 10.1002/pro.5560061015. [DOI] [PMC free article] [PubMed] [Google Scholar]
- 21.Eliezer D, Wright PE. J Mol Bol. 1996;263:531–538. doi: 10.1006/jmbi.1996.0596. [DOI] [PubMed] [Google Scholar]
- 22.Cavagnero S, Theriault Y, Narula SS, Dyson HJ, Wright PE. Protein Sci. 2000;9:186–193. doi: 10.1110/ps.9.1.186. [DOI] [PMC free article] [PubMed] [Google Scholar]
Associated Data
This section collects any data citations, data availability statements, or supplementary materials included in this article.
Supplementary Materials
Micro-ESI FT-ICR mass spectra of myoglobin fragments 119-135 (*, 3+ charge state, monoisotopic m/z 562.935) and 114-135 (Δ, 4+ charge state, monoisotopic m/z 563.538). Those fragments were generated by protease type XIII digestion and LC separation with a ProZap C18 column. Their isotopic distributions overlap after certain periods of deuterium incubation. High-resolution FT-ICR MS detection, combined with our data analysis algorithm, enables accurate assignment of the fragments and accurate calculation of deuterium incorporation for each fragment.