

Abstract
Despite widely publicized hypertension treatment guidelines for physicians and lifestyle recommendations for patients, blood pressure control rates remain low. In community-based primary care clinics, we performed a nested, 2×2 randomized, controlled trial of physician intervention vs. control and/or patient intervention vs. control. Physician Intervention included internet-based training, self-monitoring, and quarterly feedback reports. Patient Intervention included 20 weekly group sessions followed by 12 monthly phone counseling contacts, and focused on weight loss, DASH dietary pattern, exercise, and reduced sodium intake. The primary outcome was change in systolic blood pressure at 6 months.
Eight primary care practices (32 physicians) were randomized to Physician Intervention or Control. Within those practices, 574 patients were randomized to Patient Intervention or Control. Patients’ mean age was 60 years, 61% female, 37% African American. BP data were available for 91% of patients at 6 months. The main effect of Physician Intervention on systolic blood pressure at 6 months, adjusted for baseline pressure, was 0.3 mmHg (95% CI −1.5 to 2.2; p = 0.72). The main effect of the Patient Intervention was −2.6 mmHg (95% CI −4.4, −0.7; p = 0.01). The interaction of the 2 interventions was significant (p = 0.03); the largest impact was observed with the combination of Physician and Patient Intervention (−9.7 ± 12.7 mmHg). Differences between treatment groups did not persist at 18 months. Combined physician and patient intervention lowers blood pressure; future research should focus on enhancing effectiveness and sustainability of these interventions.
Keywords: Hypertension, blood pressure, behavioral intervention, quality improvement, lifestyle, DASH dietary pattern
Introduction
Hypertension is the most prevalent risk factor for cardiovascular and kidney disease1 and accounts for approximately 35% of atherosclerotic cardiovascular disease (CVD)2. Antihypertensive therapy reduces the risk of stroke by approximately 35%, congestive heart failure by 42%, and coronary heart disease by 28%.3 Prevention and treatment guidelines for providers and patients are readily available.4 Nonetheless, adherence to both provider guidelines and lifestyle recommendations for patients is low, resulting in continued low rates of blood pressure (BP) control.5 We tested interventions to increase physician adherence to national guidelines and patient adherence to lifestyle recommendations for lowering BP.
Methods
The Hypertension Improvement Project (HIP) was approved by the Duke Institutional Review Board. The design6 was a nested 2×2 randomized controlled trial of a physician intervention, a patient intervention, and both combined, compared to neither. Nesting occurred both at the level of the practice and the level of the physician. Primary care practices were randomly assigned to the Physician Intervention (MD-I) or to the MD Control (MD-C). All participating MDs within a given practice had the same randomization assignment. Within the participating practices, patients were individually randomized to the Patient Intervention (Pt-I) or to usual care (Pt-C). Follow-up measurements were performed at 6 and 18 months post-randomization. The primary outcome was systolic BP change at 6 months. The study design is displayed in Fig. 1.
Figure 1.

Study flow
Enrollment and randomization
Four matched pairs of community-based primary care practices in central North Carolina were randomized between 2005 and 2007. Practices were matched with regard to specialty (internal medicine or family practice) and patient socioeconomic mix. One practice of each pair was blindly assigned by the study statistician to intervention or control status. Within each practice, all physicians were invited to participate, with a goal of enrolling four physicians per clinic. Each physician provided written informed consent. For logistical reasons, we enrolled practices in waves or “cohorts” of one intervention and one control clinic each.
We sent a recruitment letter from the physician to potentially eligible patients. We sought to enroll 10–15 patients from each MD. Patients were eligible if they were at least 25 years old and were hypertensive based on billing codes. Patients were excluded if they had self-reported chronic kidney disease, a CVD event within the past 6 months, or were pregnant, breastfeeding or planning a pregnancy.
Potential study participants were pre-screened by phone and then attended two screening visits at which eligibility was confirmed, written informed consent was obtained, and baseline data were collected. Randomization to Pt-C or Pt-I occurred in varying block sizes using a computer-generated algorithm, stratified by cohort and clinic. Randomization was performed by the study statistician; all data collection staff remained blinded to participant’s treatment assignment. It was not feasible to blind patients or providers to their own randomization assignment. Patients were asked not to discuss their randomization assignment with their provider, but strict blinding of the physicians was not feasible.
Interventions
The Physician Intervention (MD-I) lasted 18 months and consisted of three elements:
Two training modules were provided on-line. The first module addressed the Seventh Joint National Committee on Prevention, Detection, Evaluation and Treatment of High Blood Pressure (JNC-7) guidelines.4 and the second addressed lifestyle modification for BP control. Each module required approximately 45 minutes, included a quiz that gave immediate feedback, and provided Continuing Medical Education credit through Duke University. Participating physicians completed the modules within two weeks of randomization and before the patient intervention began.
Each physician in MD-I received an evaluation and treatment algorithm that summarized, on a color-coded, pocket-size laminated card, the major JNC-7 guidelines, including lifestyle guidelines and a decision tree.
The quality improvement (QI) procedure assessed clinical performance measures (CPMs) and provided quarterly feedback to physicians on adherence to JNC-7 guidelines. At each MD-I site, participating physicians completed a CPM data form every time a HIP patient (in either Pt-I or Pt-C) had a clinic visit. The form recorded patient demographics, comorbidity, prior and current BP measurements, and actions taken during the visit. In addition, one day each month, MDs completed a CPM form on all adult patients treated during that day, whether or not the patient was a HIP participant, recording the same data as for study participants, but without patient identifiers.
These data were converted into personalized quarterly feedback reports that indicated: a) the proportion of hypertensive patients in the practice with adequately controlled BP, the change in that proportion over the course of the study, and comparison to the other participating MDs; b) the proportion of patients with diabetes or chronic kidney disease (CKD) who were at JNC-7 goal BP; c) the proportion of patients prescribed specific classes of medication based on JNC-7 guidelines; and d) the proportion who received lifestyle modification counseling based on physician self-report.
The MD Control condition (MD-C) constituted “usual care”. There was no attempt to change or monitor procedures already in place for quality improvement and physician education with regard to BP control. No performance data were collected from these physicians, and no performance feedback was given.
The Patient Intervention (Pt-I) consisted of 20 weekly group sessions (n = 10–15 patients/ group) over approximately 6 months. All intervention sessions occurred at or near the patients’ primary care clinic.
The behavior goals of Pt-I included weight loss if overweight, the Dietary Approaches to Stop Hypertension (DASH) dietary pattern7, increased moderate to vigorous physical activity, reduced sodium intake, and moderation of alcohol intake. In addition, the intervention promoted adherence to antihypertensive medication regimen. Pt-I was based on key theoretical constructs developed to guide health behavior change efforts, and on practical applications from previous trials.8 The intervention was designed to promote frequent self-monitoring, feedback, goal-setting, and social support, and used Motivational Interviewing techniques.9
Pt-I was conducted by two experienced behavioral interventionists who were trained and certified to deliver a group intervention focusing on diet and exercise and to use Motivational Interviewing techniques. They were assisted by community health advisors (CHAs).10 Two CHAs assisted with group sessions at each clinic and contacted participants who missed a session. After the initial 6 month intensive intervention, CHAs contacted participants by phone each month for 1 year to offer brief lifestyle counseling.
The Patient Control condition (Pt-C) constituted usual care, comprising an individual visit with an interventionist to receive advice and written materials on lifestyle modification for BP control consistent with JNC-7 guidelines.
Measurements
Measurements were obtained from all randomized MDs and all randomized patients at baseline, 6 and 18 months.
Physician measurements
All physicians, regardless of treatment assignment, were asked to complete a self-administered questionnaire concerning demographics, education, training, characteristics of patients under their care, and usual practice patterns.
Patient measurements
All study measurements were obtained during face-to-face clinic visits by trained, certified study personnel who were blinded to intervention assignment.
Blood pressure: Personnel were trained and certified using methods used in previous BP trials.8 Duplicate measurements were obtained with a calibrated automated appropriate-sized cuff after the participant had been seated quietly for at least 5 minutes. At each time-point (baseline, 6- and 18 months), participants attended two study visits approximately 1 week apart. BP for that time-point was defined as the mean over the two study visits (i.e., 4 BP readings). For eligibility, hypertension was considered present based on billing codes. For all other purposes, hypertension was defined as measured systolic (S)BP 140mmHg or higher, diastolic (D)BP 90mmHg or higher, or taking antihypertensive medication. BP treatment goals were defined based on JNC-7 guidelines.4
Height was measured once to the nearest 0.1 cm, using a calibrated, wall-mounted stadiometer.
Weight was measured in duplicate with the participant wearing light, indoor clothes without shoes and using a high-quality, calibrated digital scale. Body mass index (BMI) was calculated as the Quetelet Index (kg/m2).
Dietary intake was assessed with the Block Food Frequency Questionnaire (FFQ).11
Physical activity was assessed by a calibrated, triaxial accelerometer (RT3, Stayhealthy, Inc, Monrovia, California) worn for at least 10 hours per day for at least four days over the course of a week, including one weekend day. Data are expressed as total weekly minutes of moderate to vigorous physical activity (MVPA).12
Medications were self-reported and verified by study staff by inspection of medication bottles.
Laboratory measurements were performed in a certified commercial laboratory (LabCorp, Research Triangle Park, North Carolina), including fasting glucose and lipid profile and 24-hour urinary excretion of potassium, sodium and phosphorus (to reflect intake of fruits and vegetables, salt, and dairy products, respectively).
Dyslipidemia was defined as LDL-cholesterol 160mg/dl or higher or taking lipid-lowering medications. Diabetes mellitus was defined as fasting blood sugar over 125 mg/dl or taking diabetes medication. The diagnosis of CKD was based on patient self-report. Although self-report of CKD is likely to be under-estimated, self-report was used to identify patients with severe CKD, which would preclude eating the high-potassium DASH dietary pattern. For determining patient mix in MD-I feedback reports, these diagnoses were based on physician report.
Outcomes
The primary outcome was change in SBP from baseline to 6 months. Secondary outcomes included change in DBP at 6 months, BP change at 18 months, the effect of treatment on weight loss, dietary pattern, physical activity, fasting blood glucose and lipids, and the proportion of patients with adequate BP control.
Power and statistical analysis
The original study design defined the primary outcome as the proportion at goal BP, and with a planned sample size of 500 patients, was powered to detect an effect size of 0.3. During the study it became clear that the proportion of patients who were at goal BP at baseline (assessed blinded to treatment group) was higher than anticipated based on national statistics, potentially inducing a ceiling effect that could leave the study underpowered. Consequently, with the permission of the trial’s Data and Safety Monitoring Board (DSMB), the primary outcome was changed to the continuous variable, change in SBP, with change in proportion at goal relegated to a secondary outcome. In addition, recruitment for the remaining study participants targeted those with BP above goal at baseline. The achieved sample size of 574 patients in 8 practices provided 80% power to detect a difference of 4 mmHg.
Comparisons across treatment groups were adjusted for baseline value and cohort. There were no interim analyses. All participants were analyzed according to their original intervention assignment, but participants who did not complete the study measurements were not included in analyses. We compared baseline characteristics of completers and non-completers using a chi-squared or t-test (with Satterthwaite’s adjustment if indicated), and we performed a sensitivity analysis using last value carried forward. Intervention effects were consistent across cohort (assessed by a treatment-by-cohort interaction); accordingly, results are presented in aggregate.
Analysis of change in BP was performed using analysis of covariance (ANCOVA). The 2×2 factorial design allowed for tests of the main effect of MD-I, the main effect of Pt-I, and the interaction between the two interventions. For SBP and DBP, the “adjusted” (or “least squares”) mean reflects the mean change in BP within each group after accounting for any differences in case mix between the groups. In addition, we considered the design to be equivalent to a 4-arm parallel trial, and evaluated differences across pairs of intervention arms ((MD-C/Pt-C; MD-I/Pt-C; MD-C/Pt-I; MD-I/Pt-I). Similar analytic methods were applied to secondary outcomes.
The effect of treatment group on the proportion “at goal” or “not at goal” was evaluated by chi-squared analysis.
Results
A total of 8 primary care practices, comprising 32 physicians, were randomized to MD-I or MD-C (Figure 1). There were no significant differences between randomized groups with regard to MD age, sex, race, specialty, years in practice, or patient panels (Table 1). Approximately 31% reported that they were “quite familiar” with JNC guidelines. All physicians in the MD-I group completed the two training modules. Quarterly feedback reports were based on physicians completing a mean of 36.4 ± 16.4 forms/quarter on patients who were not HIP participants and 8.2 ± 5.7 forms/quarter on patients who were HIP participants.
Table 1. Baseline characteristics of physicians. N (%) unless otherwise noted.
| Characteristic | Overall | Intervention | Control | p-value* |
|---|---|---|---|---|
| N | 32 | 16 | 16 | |
| Age, mean years (SD) | 48 (10) | 47 (13) | 49 (7) | .61 |
| Female | 11 (34%) | 3 (19%) | 8 (50%) | .06 |
| African American | 5 (16%) | 2 (12%) | 3 (19%) | .63 |
| Family Medicine (all others Internal Medicine) | 17 (53%) | 8 (50%) | 9 (56%) | .72 |
| Years post MD degree, mean (SD) | 21 (10) | 20 (12) | 22 (8) | .64 |
| Clinic patients per day, mean (SD) | 21 (3) | 22 (3) | 20 (3) | .13 |
| Patients with hypertension/day, mean % (SD) | 29% (16) | 30% (14) | 28% (18) | .79 |
| “Quite familiar” with JNC guidelines | 10 (31%) | 5 (31%) | 5 (31%) | .99 |
p-value for intervention vs control
Within the 8 randomized practices, a total of 574 patients were randomized to Pt-I or Pt-C. Approximately 56% of screened patients were randomized (Figure 1), with most exclusions due to patients declining to participate. The mean age of patients was 60.5 years (range 28–94), 61% were women, 37% were African American, and 1% were Hispanic/Latino (Table 2). Most participants completed high school and reported that their income was “adequate” (93% and 85%, respectively), without differences across treatment groups. BMI ranged from 20.5 to 47.9 kg/m2, but on average, participants were obese (BMI > 30 kg/m2). Three percent self-reported chronic kidney disease (CKD). Billing code diagnosis of hypertension was confirmed in 97% of participants, who were taking a mean of 2 antihypertensive medications. Mean baseline BP was 133.1/74.1 mmHg. At baseline, approximately 60% of study participants were at goal BP.
Table 2. Baseline characteristics of patients, overall and by treatment group. Percent except where otherwise noted.
| Characteristic | Overall | MD-C/Pt-C | MD-I/Pt-C | MD-C/Pt-I | MD-I/Pt-I | p-value* |
|---|---|---|---|---|---|---|
| N (total) | 574 | 141 | 148 | 140 | 145 | |
| Age, mean years (SD) | 60.5(11.4) | 60.7 (12.2) | 61.6 (10.2) | 59.0 (12.3) | 60.7 (11.0) | .27 |
| Female | 61% | 65% | 58% | 66% | 55% | .17 |
| African American | 37% | 42% | 31% | 44% | 33% | .07 |
| Hispanic | 1% | 1% | 1% | 0% | 1% | .59 |
| Current smoker | 9% | 11% | 9% | 8% | 8% | .85 |
| Diabetes mellitus | 30% | 33% | 31% | 26% | 29% | .69 |
| BMI, mean kg/m2 (SD) | 32.5 (5.5) | 32.9 (5.7) | 32.7 (5.4) | 31.8 (5.5) | 32.6 (5.2) | .32 |
| Hypertension | 97% | 99% | 97% | 98% | 95% | .34 |
| Number of BP meds, mean (SD) | 2.0 (1.1) | 2.1 (1.2) | 2.0 (1.1) | 2.0 (1.1) | 1.9 (1.2) | .58 |
| SBP, mmHg, mean (SD) | 133.1 (16.1) | 131.6 (14.6) | 134.6 (15.7) | 132.1 (17.6) | 133.8 (16.3) | .34 |
| DBP, mmHg, mean (SD) | 74.1 (11.3) | 73.3 (10.5) | 74.3 (11.0) | 73.3 (12.6) | 75.3 (11.1) | .39 |
| Dyslipidemia | 48% | 49% | 54% | 44% | 44% | .28 |
| Prior CVD event | 16% | 16% | 14% | 14% | 21% | .39 |
p-value for comparison across treatment groups.
Outcome data are presented for patients with both baseline and follow-up data for each variable. Follow-up data were available for 91% of randomized participants at 6 months and 88.5% at 18 months, without difference by treatment group (Figure 1). At baseline, there were no significant differences between completers and non-completers with regard to dietary intake, excretion of sodium, and weight. Completers were more physically active at baseline than non-completers (36.5 min/week vs. 19.1 min/week, p = .02), had higher baseline urinary potassium excretion (60.0 vs. 53.1 mmol/24 hours, p = .05), and had lower baseline SBP (132.7/73.9 vs. 137.5/76.2 mmHg, p = .05 for SBP, p=.17 for DBP).
With neither intervention (MD-C/Pt-C), SBP fell by a mean of 6.7 ± 12.8mmHg at 6 months. With the MD intervention alone (MD-I/Pt-C), SBP fell by 5.3 ± 12.1mmHg, and with the Pt intervention alone (MD-C/Pt-I), by 7.1 ± 12.1mmHg (Figure 2a). With the combination of MD and Patient interventions (MD-I/Pt-I), SBP fell by 9.7 ± 12.7mmHg, p = .0072 compared to all other groups. In the main effects model, at 6 months there was no significant effect of MD-I (0.3mmHg (95% CI −1.5 to 2.2), p = 0.76). In contrast, the main effect of Pt-I was a net reduction of 2.6mmHg (CI −4.4 to −0.7, p=.01). Further, there was a significant interaction between MD-I and Pt-I (p = 0.03), suggesting that the effect of Pt-I was enhanced by coincident exposure to MD-I. Similar results were seen for diastolic BP (Figure 2b). Figure 2 also demonstrates BP changes from baseline to 18 months. Although changes at 18 months were similar to changes at 6 months, they were no longer significant: at 18 months, the main effect for the MD intervention was 0.3, (p=.81), the main effect for the patient intervention was −0.2 (p=.89) and the interaction was no longer significant. There were no statistically significant interactions for effects by race, sex, or age at either time point. Participants who were above goal BP at baseline had a 4.0 mmHg greater reduction in SBP than patients in whom BP was already at goal at baseline (p<0.0001, CI 2.6 to 5.4). This finding suggests that the HIP interventions will be most effective in those who need it most, which may have implications for targeting implementation of this kind of intervention in clinical settings.
Figure 2.

Change in BP at 6 and 18 months (2a: SBP; 2b: DBP)
These findings were confirmed in a separate non-parametric analysis, in a model that included physician as a covariate, and in a sensitivity analysis in which missing values were replaced by last value carried forward.
Figure 3 shows the percent of patients with BP at JNC-7-defined goal. The proportion of patients with BP at goal increased in the first 6 months post-randomization, with significant differences across treatment groups (p=.03) seemingly due to higher rates in those exposed to the patient intervention (MD-C/Pt-I and MD-I/Pt-I), but differences between treatment groups did not persist at 18 months.
Figure 3.
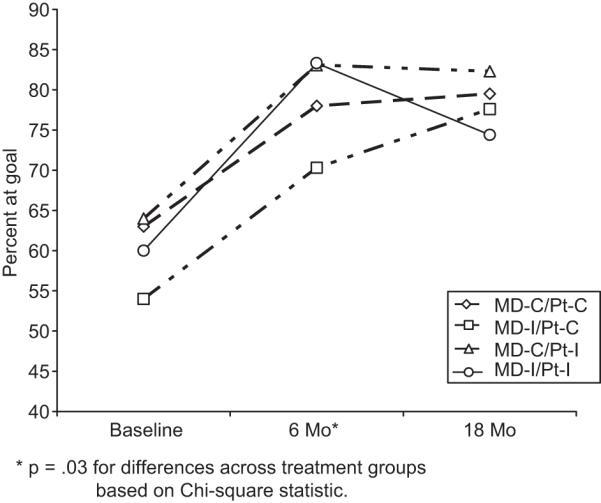
Percent of patients at goal BP
Table 3 shows that at baseline, treatment groups were comparable with regard to physical activity, dietary intake, and weight. In general, the effects on behavior of MD-I and Pt-I were independent of each other; the only significant interaction was for the effect on intake of fruits and vegetables (F/V) (p-value for interaction = 0.05). In the main effects analysis, there was no significant effect of either intervention on MV-PA. At 6 months, MD-I resulted in a significant increase in F/V intake and decreased total fat intake. Pt-I increased intake of F/V and of dairy products, and decreased intake of both total and saturated fat. Each of these dietary changes is consistent with the DASH dietary pattern. These changes were not reflected in the urinary excretion data (data not shown). Pt-I, but not MD-I, led to a significant reduction in weight (−6.1 and +0.6 lb, respectively; p<0.0001 for Pt-I main effect). At 18 months, the effect of MD-I on F/V intake was no longer significant, but the effect on total fat intake persisted. The effects of Pt-I on F/V, total fat and saturated fat intake persisted, but effects on dairy intake and weight did not. There were no significant changes in the number of antihypertensive medications, but we did not measure changes in dose.
Table 3. Effect of intervention on physical activity, dietary intake and weight. Values represent means (SD).
| Outcome | MD-C/Pt-C | MD-I/Pt-C | MD-C/Pt-I | MD-I/Pt-I | p-value: MD-I main effect |
p-value: Pt-I main effect |
|---|---|---|---|---|---|---|
| Physical activity by accelerometry (Moderate-vigorous physical activity, minutes/week) | ||||||
| Baseline | 43.9 (122.5) | 36.4 (127.1) | 37.9 (89.1) | 28.8 (106.7) | ||
| Change (6-month) | −15.7 (122.0) | 18.5 (297.8) | 6.2 (103.2) | 28.4 (134.9) | .15 | .49 |
| Change (18-month) | −13.0 (145.7) | 5.0 (95.1) | −21.5 (138.8) | −0.7 (112.3) | .07 | .10 |
| Dietary pattern | ||||||
| F/V, servings/d | ||||||
| Baseline | 1.28 (.90) | 1.23 (.88) | 1.33 (.99) | 1.42 (1.13) | ||
| Change (6-month) | 0.04 (.81) | 0.09 (.72) | 0.59 (1.27) | 0.92 (1.34) | .02 | <.0001 |
| Change (18-month) | 0.01 (0.90) | −0.03 (0.87) | 0.41 (1.13) | 0.55 (1.13) | .53 | <.0001 |
| Dairy, servings/d | ||||||
| Baseline | 0.94 (.90) | 0.89 (.89) | 0.94 (.89) | 0.95 (.81) | ||
| Change (6-month) | −0.01 (.72) | 0.01 (.56) | 0.06 (.67) | 0.21 (.75) | .17 | .01 |
| Change (18-month) | −0.03 (0.80) | −0.00 (0.61) | 0.08 (0.51) | −0.01 (0.79) | .57 | .56 |
| Total fat, % Kcal | ||||||
| Baseline | 38.1 (8.0) | 39.8 (8.3) | 38.4 (8.1) | 37.3 (6.8) | ||
| Change (6-month) | 0.6 (7.0) | −1.2 (6.7) | −2.3 (8.5) | −4.3 (7.1) | .002 | <.0001 |
| Change (18-month) | 0.8 (8.0) | −1.1 (6.6) | −1.7 (7.7) | −2.8 (7.8) | .02 | <.0001 |
| Saturated fat, % Kcal | ||||||
| Baseline | 10.6 (2.5) | 11.0 (2.3) | 10.9 (2.7) | 10.5 (2.4) | ||
| Change (6-month) | 0.2 (2.3) | −0.2 (2.0) | −1.0 (2.7) | −1.3 (2.1) | .07 | <.0001 |
| Change (18-month) | 0.1 (2.3) | −0.2 (2.0) | −0.9 (2.1) | −1.0 (2.2) | .28 | <.0001 |
| Urinary Sodium, mmol/24 hrs | ||||||
| Baseline | 174.7 (77.0) | 175.2 (82.9) | 150.9 (68.0) | 170.3 (76.2) | ||
| Change (6-month) | −22.8 (71.2) | −23.6 (75.2) | −13.1 (62.2) | −31.4 (79.7) | .62 | .14 |
| Change (18-month) | −8.3 (84.1) | −1.4 (69.9) | −24.0 (85.2) | −28.0 (76.6) | .03 | .32 |
| Weight, lb | ||||||
| Baseline | 202.1 (39.6) | 199.0 (38.4) | 192.3 (38.0) | 202.5 (37.5) | ||
| Change (6-month) | −0.3 (6.3) | 0.1 (11.2) | −5.2 (10.7) | −7.0 (10.7) | .44 | <.0001 |
| Change (18-month) | −2.1 (12.0) | −0.4 (13.4) | −2.6 (12.2) | −3.8 (9.8) | .83 | .06 |
N in each category ranged from 74% (urine) to 91% (weight) of randomized participants at 6 months and from 71% (urine) to 89% (weight) at 18 months.
Discussion
The HIP trial demonstrated that in the setting of primary care clinics, an intensive behavioral lifestyle intervention significantly reduced BP at 6 months, with evidence that this effect occurred because of adoption of healthy dietary pattern and weight loss. A QI-type intervention for the primary care physicians treating these patients apparently did not lead to more effective BP management. However, a key finding of the trial was that the effect of the patient intervention was significantly enhanced by simultaneous exposure of the primary care provider to the QI-type intervention.
MD-I may have enhanced the effect of Pt-I through several mechanisms. In previous research, providers report lack of confidence in addressing behavior change and patient lifestyle13, and the training on lifestyle counseling included in the physician intervention may have increased their confidence and enhanced their counseling, reinforcing the lifestyle advice patients were receiving in the patient intervention. Such reinforcement alone may not be sufficient to change patient behavior, but coupling it with intensive support for behavior change may have encouraged patients to adopt BP-lowering behaviors. In addition, the combined intervention may have changed the doctor-patient interaction in such a way that the physician was more likely to intensify antihypertensive treatment. Although there was no clear effect of the MD intervention on the number of antihypertensive medications prescribed, we were unable to assess changes in dose, which perhaps would more sensitively reflect intensification of therapy.
Our findings are consistent with a systematic review of QI interventions for BP control.14 In evaluating 44 papers, Walsh et al found that QI strategies that target the provider have limited effect compared to strategies that target the patient. The median reduction in BP associated with QI interventions that provided monitoring and feedback for providers was 1.5/0.6 mmHg compared to 3.3/2.8 mmHg for interventions that promoted patient self-management. In this systematic review, there was no opportunity to evaluate combinations of physician and patient strategies. However, subsequently Roumie et al randomized 205 primary care providers to interventions that were similar but less intense than HIP: provider education consisting of a letter to the MD, provider education plus an electronic alert system which added a single reminder for each patient, or provider education and alert plus patient education which added mailed written advice concerning adherence to medication and lifestyle changes.15 This study was conducted largely in academic medical center clinics, in a study population that was older than HIP participants (mean age 65 vs. 60 years), 97% male (compared to 39% in HIP), and with higher baseline BP (157/82 vs. 133/74 mmHg). Despite these differences, results were similar: at 6 months, the group receiving provider education and alert plus patient education was 33% more likely to have SBP less than 140 mmHg than the group receiving provider education only (p=0.013). Provider education plus alerts without patient education did not improve the SBP control rate.
Our provider intervention was unique in its emphasis on lifestyle counseling. There are numerous challenges to providing lifestyle counseling in the context of a primary care visit, including time, providers’ confidence in their or the patient’s ability to change behavior, and lack of reimbursement for these activities. We expected that the MD training in the HIP provider intervention would increase lifestyle counseling, but the extent to which counseling occurred was based on MD self-report. It is possible that MDs in the intervention group were more likely to report counseling whether or not they were actually providing it, knowing that was expected of them. A discrepancy between reported and actual counseling may help explain the lack of effect of MD-I on BP.
Unlike the Roumie trial, we tested the patient intervention alone. The HIP Pt-I is similar to what has been effective in previous studies16-18, but is unique in its application in this study in the community practice setting. In addition, the HIP Pt-I focused heavily on adoption of the DASH dietary pattern, which has been shown to lower BP7 and LDL-cholesterol19 and has been associated with successful weight loss.16, 20 In HIP, Pt-I significantly improved dietary pattern consistent with the DASH dietary pattern. The DASH dietary pattern is not specifically a low-salt diet, but the BP effect of DASH is increased by simultaneous reduction in sodium intake.21 Reducing sodium intake was a goal of the HIP Pt-I, but urinary excretion data did not suggest an effect. The lack of significant decrease in sodium excretion could reflect the limitations of a single 24-hour urine collection for assessing intake22, or an actual absence of change. Nonetheless, clinical trial and meta-analysis would suggest that the impact on BP of weight loss and DASH is greater than the impact of currently recommended sodium reduction.23, 24 Thus it may be advantageous that the HIP Pt-I had its predominant impact on DASH adherence and weight loss. In general, effects on BP were associated with changes in behavior. For example, patients who lost weight had a 2.1 mmHg greater improvement in SBP (p=0.0013, CI 0.8 to 3.3) than patients who didn’t lose weight.
The main effect of the HIP Pt-I on behavior and BP was somewhat less than in previous similar studies. For example, the PREMIER study exposed a similar patient population to a similar intervention. In the two active treatment groups in PREMIER, BP fell by approximately 4/3 mmHg (net of control)16, compared to a reduction of 2.6/1.0 mmHg in HIP (Pt-I main effect). This difference could well be within the variability of the effect estimate, or it could be due to increased effects in a younger population (mean age 50 years in PREMIER vs. 60 in HIP). However, PREMIER participants were otherwise similar to HIP (generally healthy, 36% male, 36% Black, BP 134/84 mmHg at baseline).
Therefore, the lesser effect on BP is more likely to reflect mild dilution of the intervention’s effect as the study design moves from academic medical centers (PREMIER) closer to an effectiveness trial conducted in community-based practices (HIP). Indeed the results of HIP may be more generalizable than other trials because participants were recruited from community practices, received the intervention locally, and were diverse with respect to race, gender, and age.
As noted in PREMIER and other trials, intervention effects on BP did not persist to the end of the study (18-months after randomization, or 12 months after the intensive behavioral intervention for patients). We originally speculated that the 6-month outcomes would reflect the maximum impact of the patient intervention but might be too early to reflect maximum impact of the MD intervention. The 18-month outcomes presumably assess the durability of Pt-I as well as the cumulative (perhaps maximal) effect of MD-I. We noted that there was some persistent effect on behavior (i.e., improved dietary pattern and some weight loss), but there was no significant effect of either Pt-I or MD-I on BP at 18 months. The effect in the MD-I/Pt-I group at 18 months, however, was comparable to that found at 6 months.
The HIP study has three potential limitations. First, the analysis of primary outcome is based on those who completed follow-up. No imputation procedure was used for missing data because no method was considered satisfactory given that BP and other measurements were collected at baseline and then at the time of primary outcome assessment, with no intermediate measurements. Although a completers analysis is potentially subject to bias, the follow-up rate exceeded 91% at 6 months and 88% at 18 months, and a sensitivity analysis assuming no change in BP in non-completers yielded similar results
Second, because BP control rates were unexpectedly high at baseline, the primary outcome was changed from “proportion at goal BP” to “change in SBP”. However, the new primary outcome initially had been designated as an important secondary outcome, the decision to change the primary outcome was made blinded to treatment group effects and was reviewed and approved by the DSMB, and the results are consistent.
And third, the study population represents a relatively healthy cohort with high rates of BP control at baseline and limited co-morbidity. In addition, only about 10% of potentially eligible patients were randomized. These factors suggest potential limitations to both generalizability of the results and implementation of the interventions.
Perspectives
The HIP behavioral intervention improved dietary pattern and lowered BP over 6 months, but the intervention was intensive, the effect size relatively small, and the effect did not persist. Implementation of similar lifestyle intervention program would require further development to make it affordable, scalable within health systems, and able to produce sustained improvements in behavior and BP. The same is true for the HIP MD intervention. Improving the MD intervention might require integrated tools for easily assessing patient behavior and providing brief targeted advice within the context of the modern primary care practice. Nonetheless, given the potential impact of lifestyle modification on BP and the apparent role that doctors play in encouraging healthy behaviors, future development and testing of both patient and provider interventions should be a high priority.
Acknowledgements
The investigators gratefully acknowledge the valuable contributions of the study participants and the following individuals:
Research staff: Kathleen Aicher, Blondeaner Brown, Gwendolyn Davis, LaVerne Johnson-Pruden, Martis King, Tonya Milligan, Rhonda Mooney, LaChanda Reams, Patrice Reams, Sonia P. Steele.
Duke Medical Media (Ann Bushyhead) and the Duke CME office.
DSMB members: Jean Spaulding, MD (Chair); L. Kristen Newby, MD; Michael Pignone MD, MD; Steven C. Grambow PhD; Wendy Demark-Wahnefried PhD.
Physicians and staff at the participating clinics: Durham Medical Center, Durham, NC; Harps Mill Internal Medicine, Raleigh, NC; Henderson Family Medicine Clinic, Henderson, NC; Hillsborough Family Practice, Hillsborough, NC; Metropolitan Durham Medical Group, Durham, NC; Oxford Family Physicians, Oxford, NC; Roxboro Medical Associates, Roxboro, NC; Triangle Family Practice, Durham, NC.
Sources of funding: R01-HL75373.
Footnotes
There are no conflicts of interest to disclose.
References
- 1.Working Group Report on Primary Prevention of Hypertension . National High Blood Pressure Education Program. National Institutes of Health, National Heart, Lung, and Blood Institutes document Bethesda: National Institutes of Health; 2000. [Google Scholar]
- 2.Kannel WB. Blood pressure as a cardiovascular risk factor: prevention and treatment. Journal of the American Medical Association. 1996;275:1571–1576. [PubMed] [Google Scholar]
- 3.Psaty B, Smith NL, Siscovick DS, Koepsell TD, Weiss NS, Heckbert SR, Lemaitre RN, Wagner EH, Furberg CD. Health outcomes associated with anti-hypertensive therapies used as first line agents: A systematic review and meta-analysis. Journal of the American Medical Association. 1997;277:739–745. [PubMed] [Google Scholar]
- 4.Chobanian AV, Bakris GL, Black HR, Cushman WC, Green LA, Izzo JL, Jr., Jones DW, Materson BJ, Oparil S, Wright JT, Jr., Roccella EJ. The Seventh Report of the Joint National Committee on Prevention, Detection, Evaluation, and Treatment of High Blood Pressure: the JNC 7 report. Hypertension. 2003;42:1206–1252. doi: 10.1161/01.HYP.0000107251.49515.c2. [DOI] [PubMed] [Google Scholar]
- 5.Singer GM, Izhar M, Black HR. Guidelines for hypertension: are quality-assurance measures on target? Hypertension. 2004;43:198–202. doi: 10.1161/01.HYP.0000114697.14697.d2. [DOI] [PubMed] [Google Scholar]
- 6.Dolor RJ, Yancy WS, Jr., Owen WF, Matchar DB, Samsa GP, Pollak KI, Lin PH, Ard JD, Prempeh M, McGuire HL, Batch BC, Fan W, Svetkey LP. Hypertension Improvement Project (HIP): study protocol and implementation challenges. Trials. 2009;10:13. doi: 10.1186/1745-6215-10-13. [DOI] [PMC free article] [PubMed] [Google Scholar]
- 7.Appel L, Moore TJ, Obarzanek E, Vollmer WM, Svetkey LP, Sacks FM, Bray GA, Vogt TM, Cutler JA, Windhauser MM, Lin P-H, Karanja N, for the DASH Collaborative Research Group A clinical trial of the effects of dietary patterns on blood pressure. N Engl J Med. 1997;336:1117–1124. doi: 10.1056/NEJM199704173361601. [DOI] [PubMed] [Google Scholar]
- 8.Svetkey LP, Harsha DW, Vollmer WM, Stevens VJ, Obarzanek E, Elmer PJ, Lin PH, Champagne C, Simons-Morton DG, Aickin M, Proschan MA, Appel LJ. Premier: a clinical trial of comprehensive lifestyle modification for blood pressure control: rationale, design and baseline characteristics. Ann Epidemiol. 2003;13:462–471. doi: 10.1016/s1047-2797(03)00006-1. [DOI] [PubMed] [Google Scholar]
- 9.Miller WR, Rollnick S. Motivational interviewing: preparing people for change. 2nd ed Guilford Press; 2002. [Google Scholar]
- 10.Brownstein JN, Chowdhury FM, Norris SL, Horsley T, Jack L, Jr., Zhang X, Satterfield D. Effectiveness of community health workers in the care of people with hypertension. Am J Prev Med. 2007;32:435–447. doi: 10.1016/j.amepre.2007.01.011. [DOI] [PubMed] [Google Scholar]
- 11.Block G, Thompson FE, Hartman AM, Larkin FA, Guire KE. Comparison of two dietary questionnaires validated against multiple dietary records collected during a 1-year period. J Am Diet Assoc. 1992;92:686–693. [PubMed] [Google Scholar]
- 12.Chen C, Jerome GJ, Laferriere D, Young D, Vollmer WM. Use of RT3 Triaxial Accelerometers in the Weight Loss Maintenance (WLM) Trial. Journal of Physical Activity & Health. 2009:6. doi: 10.1123/jpah.6.3.354. [DOI] [PMC free article] [PubMed] [Google Scholar]
- 13.Cook S, Drum ML, Kirchhoff AC, Jin L, Levie J, Harrison JF, Lippold SA, Schaefer CT, Chin MH. Providers’ assessment of barriers to effective management of hypertension and hyperlipidemia in community health centers. J Health Care Poor Underserved. 2006;17:70–85. doi: 10.1353/hpu.2006.0021. [DOI] [PubMed] [Google Scholar]
- 14.Walsh JM, McDonald KM, Shojania KG, Sundaram V, Nayak S, Lewis R, Owens DK, Goldstein MK. Quality improvement strategies for hypertension management: a systematic review. Med Care. 2006;44:646–657. doi: 10.1097/01.mlr.0000220260.30768.32. [DOI] [PubMed] [Google Scholar]
- 15.Roumie CL, Elasy TA, Greevy R, Griffin MR, Liu X, Stone WJ, Wallston KA, Dittus RS, Alvarez V, Cobb J, Speroff T. Improving blood pressure control through provider education, provider alerts, and patient education: a cluster randomized trial. Ann Intern Med. 2006;145:165–175. doi: 10.7326/0003-4819-145-3-200608010-00004. [DOI] [PubMed] [Google Scholar]
- 16.Appel LJ, Champagne CM, Harsha DW, Cooper LS, Obarzanek E, Elmer PJ, Stevens VJ, Vollmer WM, Lin PH, Svetkey LP, Stedman SW, Young DR, Writing Group of the PCRG Effects of comprehensive lifestyle modification on blood pressure control: main results of the PREMIER clinical trial. Journal of the American Medical Association. 2003;289:2083–2093. doi: 10.1001/jama.289.16.2083. [DOI] [PubMed] [Google Scholar]
- 17.Whelton PK, Appel LJ, Espeland MA, Applegate WB, Ettinger WH, Jr., Kostis JB, Kumanyika S, Lacy CR, Johnson KC, Folmar S, Cutler JA, TONE Collaborative Research Group Sodium reduction and weight loss in the treatment of hypertension in older persons: a randomized controlled trial of nonpharmacologic interventions in the elderly (TONE) Journal of the American Medical Association. 1998;279:839–846. doi: 10.1001/jama.279.11.839. [DOI] [PubMed] [Google Scholar]
- 18.Trials of Hypertension Prevention Collaborative Research Group Effects of weight loss and sodium reduction intervention on blood pressure and hypertension incidence in overweight people with high-normal blood pressure. The Trials of Hypertension Prevention, phase II. Arch Intern Med. 1997;157:657–667. [PubMed] [Google Scholar]
- 19.Obarzanek E, Sacks FM, Vollmer WM, Bray GA, Miller ER, 3rd, Lin PH, Karanja NM, Most-Windhauser MM, Moore TJ, Swain JF, Bales CW, Proschan MA, Group DR. Effects on blood lipids of a blood pressure-lowering diet: the Dietary Approaches to Stop Hypertension (DASH) Trial. Am J Clin Nutr. 2001;74:80–89. doi: 10.1093/ajcn/74.1.80. [DOI] [PubMed] [Google Scholar]
- 20.Svetkey LP, Stevens VJ, Brantley PJ, Appel LJ, Hollis JF, Loria CM, Vollmer WM, Gullion CM, Funk K, Smith P, Samuel-Hodge C, Myers V, Lien LF, Laferriere D, Kennedy B, Jerome GJ, Heinith F, Harsha DW, Evans P, Erlinger TP, Dalcin AT, Coughlin J, Charleston J, Champagne CM, Bauck A, Ard JD, Aicher K, Weight Loss Maintenance Collaborative Research G Comparison of strategies for sustaining weight loss: the weight loss maintenance randomized controlled trial. Journal of the American Medical Association. 2008;299:1139–1148. doi: 10.1001/jama.299.10.1139. [DOI] [PubMed] [Google Scholar]
- 21.Sacks FM, Svetkey LP, Vollmer WM, Appel LJ, Bray GA, Harsha D, Obarzanek E, Conlin PR, Miller ER, 3rd, Simons-Morton DG, Karanja N, Lin PH, DASH-Sodium Collaborative Research Group Effects on blood pressure of reduced dietary sodium and the Dietary Approaches to Stop Hypertension (DASH) diet. N Engl J Med. 2001;344:3–10. doi: 10.1056/NEJM200101043440101. [DOI] [PubMed] [Google Scholar]
- 22.Liu K, Stamler J. Assessment of sodium intake in epidemiological studies on blood pressure. Ann Clin Res. 1984;16(Suppl 43):49–54. [PubMed] [Google Scholar]
- 23.Neter JE, Stam BE, Kok FJ, Grobbee DE, Geleijnse JM. Influence of weight reduction on blood pressure: a meta-analysis of randomized controlled trials. Hypertension. 2003;42:878–884. doi: 10.1161/01.HYP.0000094221.86888.AE. [DOI] [PubMed] [Google Scholar]
- 24.Graudal NA, Galloe AM, Garred P. Effects of sodium restriction on blood pressure, renin, aldosterone, catecholamines, cholesterols, and triglyceride: a meta-analysis. Journal of the American Medical Association. 1998;279:1383–1391. doi: 10.1001/jama.279.17.1383. [DOI] [PubMed] [Google Scholar]