Abstract
Multi-channel amplification was implemented within a cellular phone system and compared to a standard cellular-phone response. Three cellular phone speech-encoding strategies were evaluated: a narrow-band (3.5 kHz upper cut-off) enhanced variable-rate coder (EVRC), a narrow-band selectable-mode vocoder (SMV), and a wide-band SMV (7.5 kHz cut-off). Because the SMV encoding strategies are not yet available on phones, the processing was simulated using a computer. Individualized-amplification settings were created for 14 participants with hearing loss using NAL-NL1 targets. Overall gain was set at preferred listening levels for both the individualized-amplification setting and the standard cellular phone setting for each of the three encoders. Phoneme-recognition scores and subjective ratings (listening effort, overall quality) were obtained in quiet and in noise. Stimuli were played from loudspeakers in one room, picked up by a microphone connected to a (transmitting) computer, and sent over the internet to a receiving computer in an adjacent room, where the signal was amplified and delivered monaurally. Phoneme scores and subjective ratings were significantly higher for the individualized-amplification setting than for the standard setting in both quiet and noise. There were no significant differences among the cellular-phone encoding strategies for any measure.
Keywords: Hearing loss, cellular phone, hearing aids, amplifiers, speech perception
One of the more common complaints of hearing-aid users is difficulty hearing on the telephone with hearing aids (Kochkin, 2000). Underlying this general complaint are problems related to inadequate coupling between the phone and the hearing aid, acoustic feedback, and electromagnetic interference with the use of a telecoil. These problems can occur for both land lines and cellular phones.
Cellular phone users may experience additional problems related to poor signal quality and, for hearing-aid users, incompatibility between the hearing aid and the cellular phone. Recent federal regulations should ease the compatibility problem, but these regulations have not been fully implemented. In addition, developments in hearing-aid technology aimed at wireless coupling between hearing aids and cellular phones are expected to alleviate some of the coupling problems noted above.
There is also a need for appropriate cellular-phone technology for the 70% of people with hearing loss who do not wear hearing aids (Kochkin, 2007). Although the overall intensity can be adjusted using the cellular-phone volume control, the range of adjustment is limited to a few broad categories. In other words, fine volume adjustments are not available. Moreover, cellular phones do not have the frequency shaping needed to provide appropriate high-frequency information to people with hearing loss. There is evidence that frequency shaping based on the National Acoustics Laboratories Revised prescription (NAL-R) (Byrne & Cotton, 1988) enhances the audibility of speech compared to a flatter frequency response when listeners are allowed to control overall volume (e.g. Studebaker, 1992; Byrne, 1996). It is expected, therefore, that for people with hearing loss, frequency shaping of a cellular-phone response may provide an audibility advantage over standard cellular-phone responses. Given the degraded nature of a cellular-phone signal, however, it is not certain that increased audibility will translate into improved speech-recognition.
A second consideration for cellular-phone users with hearing loss is the fidelity of the signal transmitted. To save bit rate, cellular-phone encoders use processing algorithms that extract essential information from an input speech signal, rather than transmitting the entire signal. The Enhanced Variable Rate Codec (EVRC), is an example of a speech-encoding algorithm used in many cellular phones. The EVRC is a linear-predictive algorithm that models the speech signal with a few parameters to define the crucial articulatory and voicing properties of the speech signal. By sending the model parameters, rather than the original signal, bit-rate (and, therefore, network traffic) is significantly reduced, a desirable goal for shared communication channels (i.e. the air links between cellular phones and cellular stations). Although speech processed through the algorithm is intelligible, some distortion occurs because details of the original speech signal are lost. In addition, EVRC can only reproduce signals up to about 3.5 kHz.
The selectable-mode vocoder (SMV), the next generation of encoder, is not yet available on commercial cellular phones. Like EVRC, it is uses a speech-encoding algorithm that is based on a model of speech production. Unlike the EVRC encoder, however, SMV provides multiple modes of operation that are selected based on input speech characteristics. The SMV algorithm includes voice-activity detection and a scheme to categorize segments of the input signal. Silence and unvoiced segments, for example, are coded at a fraction of the bit rate to further reduce channel traffic. There are two versions of the SMV: a narrow-band version (SMV-NB), with an upper frequency limit of about 3.5 kHz, and a wide-band version (SMV-WB) with an upper frequency limit of about 7.5 kHz. Given the evidence that hearing aids with wideband amplification can result in improved speech recognition for some hearing-aid users (see, for example, Skinner et al., 1982; Mackersie et al., 2004), it is reasonable to expect that a wideband cellular-phone encoding scheme will offer a similar advantage over narrowband schemes. This expectation, however, requires verification.
Regardless of which encoding scheme is used, the speech signal goes through the following steps.
Analog-to-digital conversion: The current generation of cellular phones sample at 8 kHz with a quantization level of 16 bits.
Signal encoding: the digital signal is further processed to reduce the bit rate required for transmission. Most encoding methods make use of a source-filter model of speech production. Essentially, the encoders re-create a facsimile of the original signal that is believed to contain the primary acoustic information needed for recognition and talker identification by listeners with normal hearing.
Wireless transmission: the encoded signal is broken down into packets and transmitted wirelessly.
When the signal is received, the process described above is reversed. That is, the packets are reassembled, and the received signal undergoes decoding followed by digital-to-analog conversion, amplification, and delivery to the telephone’s output transducer.
The general purpose of the present study was to evaluate new cellular-phone technology that adds multi-channel digital hearing-aid processing before digital-to-analog conversion. The cellular-phone technology was designed to be used without hearing aids.
The specific objectives were:
to determine if cellular-phone processing incorporating individualized selective amplification results in improved speech recognition and subjective ratings of listening effort and overall quality relative to a standard cellular-phone frequency response. For the purposes of this paper, “individualized amplification” refers to frequency responses settings within the phone that were based on the National Acoustics Laboratories Non-linear prescription, Version 1 (NAL-NL1) (Byrne et al., 2001), a commonly used generic prescription. It was predicted that speech recognition and subjective ratings would be better for the individualized amplification than for the standard cellular-phone response.
to compare, in the same listeners, speech recognition and subjective ratings of listening effort and overall quality for three cellular-phone encoding strategies (EVRC, SMV-NB, SMV-WB). It was predicted that speech recognition and subjective ratings would be better for the wide-band encoding scheme than for the two narrow-band schemes. Differences between the two narrow-band schemes (EVRC, SMV-NB) were not expected.
METHOD
Participants
Fourteen adults with sensorineural hearing loss participated in the study. All participants were native English speakers. The sample size was chosen based on a power analysis of the amplification effect (individualized amplification vs. standard setting) completed on preliminary data for six participants. It was determined that in order to reach a power goal of 0.80, a minimum of 12 participants was needed for the subjective ratings of listening effort and sound quality, and a minimum of seven participants was needed for the recognition data.
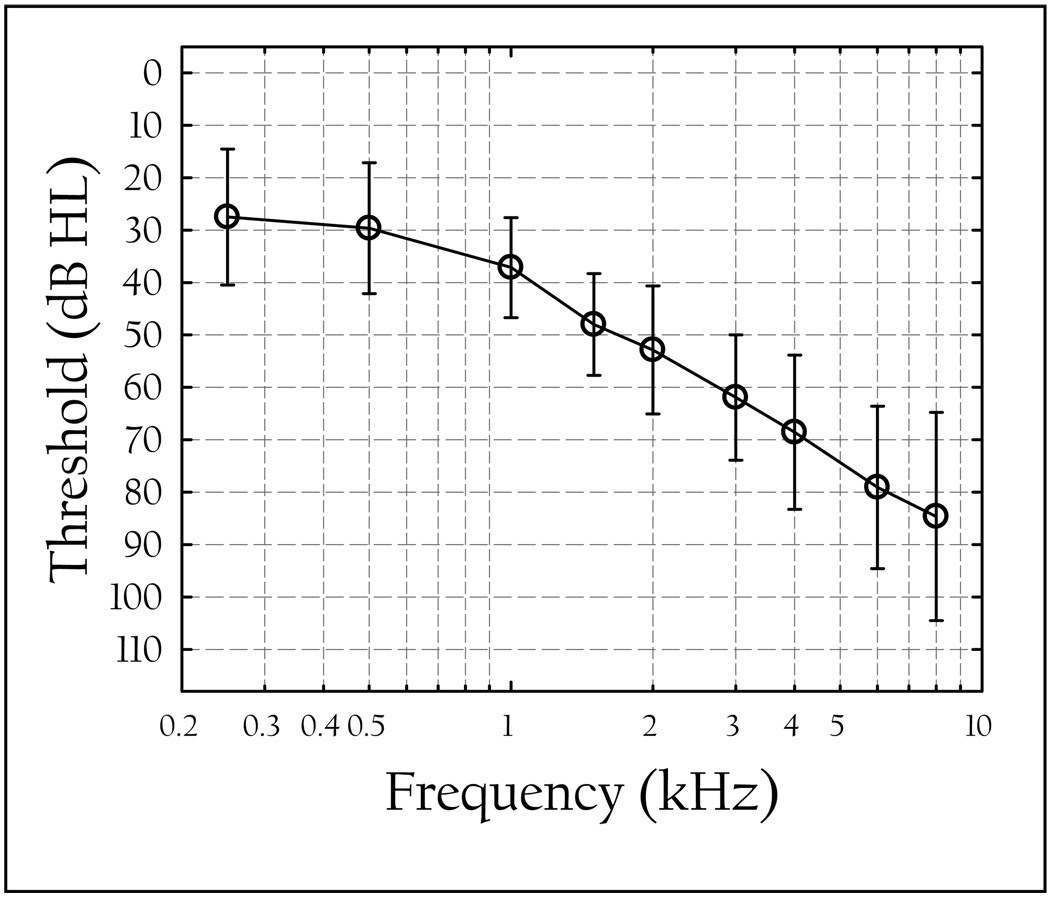
Participants ranged in age from 61 to 84 years with a mean of 76 years. The three-frequency pure-tone average thresholds (0.5, 1, 2 kHz) ranged from 23 to 53 dB HL with a mean of 40 dB HL. Audiogram configuration varied among the participants from flat/gradually sloping (< 20 dB between 0.5 and 2 kHz, n=7) to steeply sloping (> 20 dB between 0.5 and 2 kHz, n =7). Mean pure-tone thresholds for the test ear are shown in Figure 1.
Figure 1.
Mean pure-tone thresholds for the test ear for the participants. The error bars represent ± 1 standard deviation.
All but two participants were hearing-aid users with a minimum of two years of hearing-aid experience. The remaining two participants did not wear hearing aids. The twelve hearing-aid users wore a variety of hearing aids whose frequency responses generally conformed to the NAL-NL1 prescription.
Cell-phone encoding strategies
Three speech encoding strategies were evaluated:
An enhanced variable rate coder (EVRC) with an upper frequency cut-off of 3.5 kHz
A narrow-band selectable mode vocoders (SMV-NB) with an upper frequency cut-off of 3.5 kHz
A wide-band selectable mode vocoder (SMV-WB) with an upper frequency cut-off of 7.5 kHz.
All cellular-phone processing was simulated using a personal computer. This was necessary because the SMV-NB and SMV-WB encoding strategies were not, at the time of this writing, obtainable on commercially-available cellular phones. The signal processing used in the simulation was the same as the signal processing used in cellular-phone communication, except that the encoded signal packets were sent through the internet, rather than over existing wireless channels.
Hearing-aid functions
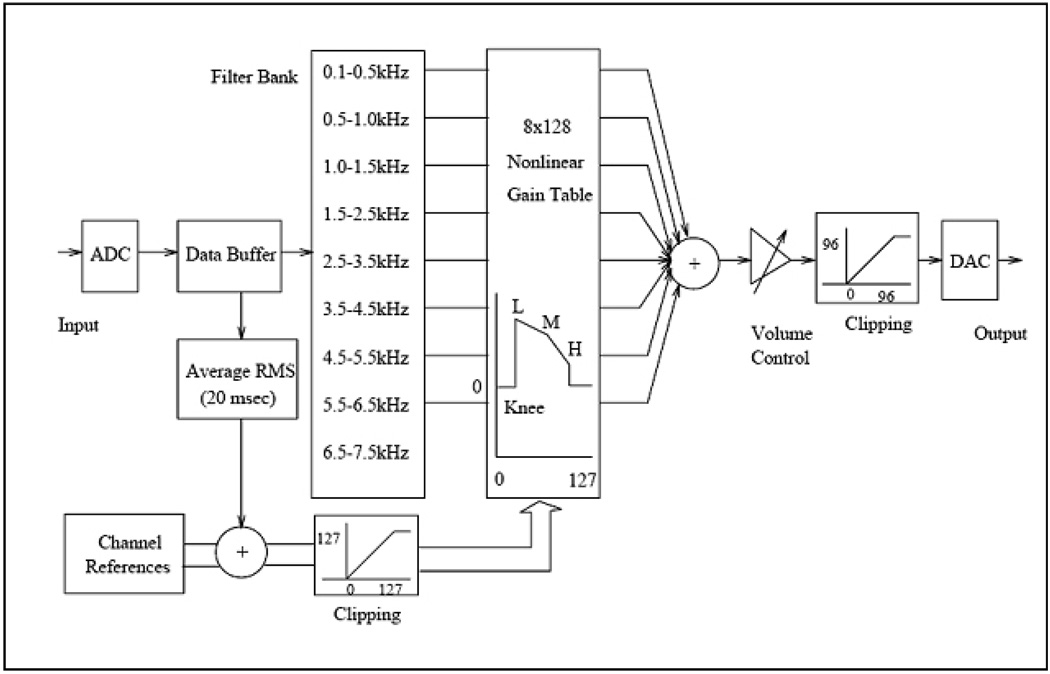
In addition to the encoding strategies described above, the simulated cellular-phone technology also incorporated multi-channel, non-linear hearing-aid processing with three functional blocks: i) filter bank, ii) compressor, and iii) volume control (see Figure 2).
Figure 2.
The multi-channel, non-linear amplification system developed for the cellular phone.
The filter bank uses hierarchical, interpolated finite impulse response filters (IFIR). It has nine channels, covering the frequency range of 0.1 – 7.5 kHz. The out-of-channel attenuation of each filter is about 35–40 dB. The channel bandwidth is about 0.25 kHz for the three low-frequency channels, and 1 kHz for the high-frequency channels. Narrower bandwidths are used at low frequencies to reflect the better low-frequency resolution of the human auditory system. Eight out of the nine channels are used to produce the amplified output. The highest frequency channel is dropped for anti-aliasing purposes. The outputs of the eight channels are summed to produce the final speech signal.
Computationally, the filter bank has about 68 non-zero coefficients and about 200 zero valued coefficients. This means that a total of 68 multiplications are performed on each sample of the input signal to implement the entire filter bank. The delay of the system could be as small as 77 samples (4.8 msec when the signal is sampled at 16 kHz). It is, effectively, a real-time implementation of a non-linear amplification function.
The output of each filter serves as the input to a compressor module. The compressor is controlled by level-dependent gain table with 8×128 (channel × input level) entries. The input level is computed as the average intensity in dB within a small time window (for example, 128 points or 8 msec when the signal is sampled at 16 kHz). The gain entry is computed as a piece-wise linear function of the input level whose parameters are obtained from the user configuration file.
Instrumentation and set up
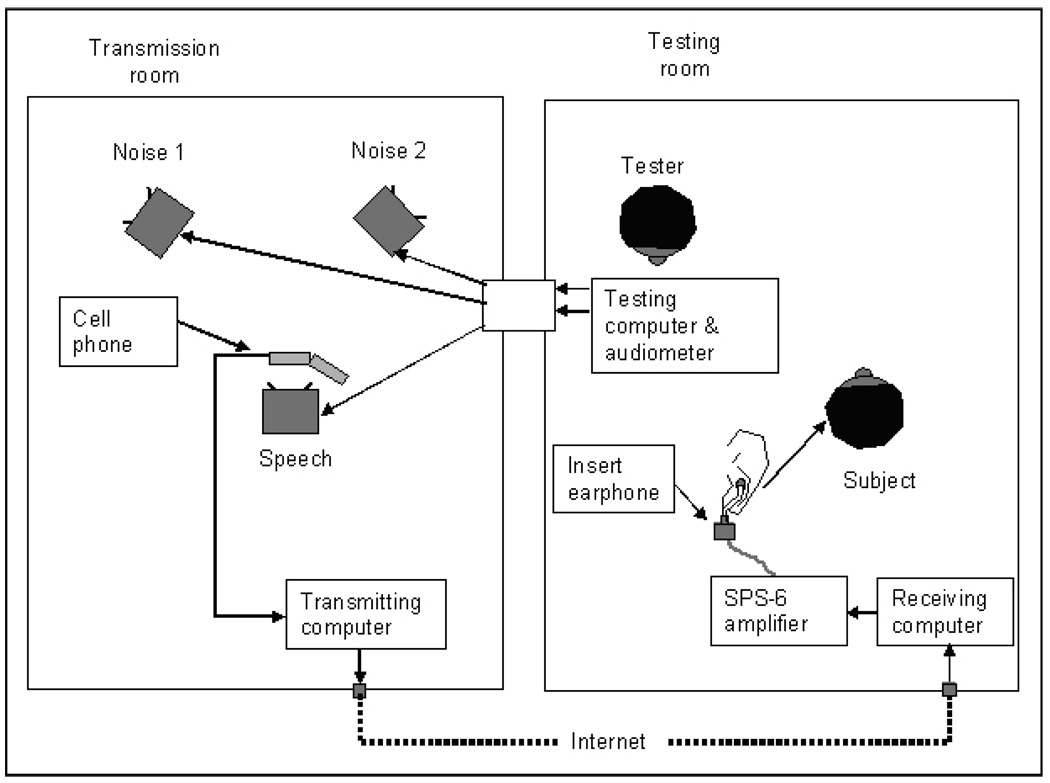
All testing was carried out at San Diego State University. The cellular-phone processing was implemented using two personal computers. Figure 3 illustrates the instrumentation set-up for transmitting and receiving the calls, and for speech-recognition testing.
Figure 3.
Instrumentation and room arrangement for testing and for placing and receiving calls.
Digitized speech stimuli (described under “Procedures”) were converted to analog form and played from a computer in the testing room (right panel, Figure 3), routed through the speech channel of an Interacoustics 70A audiometer, and delivered to a single-cone loudspeaker in the transmission room to represent the talker (left panel). For some conditions, noise was also played from the computer, routed through the second speech channel of the audiometer, and delivered to dual-cone loudspeakers in the transmission room placed 39 inches (approximately one meter) from each other and from the loudspeaker delivering the speech stimuli. All loudspeakers were powered by the internal amplifier of the audiometer. The dual-cone loudspeakers had additional internal amplification within the speakers. The output levels of the loudspeakers were calibrated using the linear setting of a Quest sound level meter (Model 155).
The speech stimuli from the single-cone loudspeaker were delivered to a microphone housed in a cellular-phone case which was positioned three inches (7.5 cm) from the loudspeaker at zero degrees azimuth. Throughout the paper, this input microphone will be referred to as the “cellular-phone microphone”. The microphone line was routed to the microphone input channel of an integrated 16-bit sound card on a Sony Vaio laptop computer (the transmitting computer). The input signal was encoded and sent to the receiving computer (Dell XPS200) in the adjacent room (testing room) using the voice-over internet protocol. This protocol is a standard method to send a digitally-coded speech signal over the internet. The output of the 16-bit integrated sound card on the receiving computer was routed to an external amplifier, and then delivered monaurally to the participant’s test ear through an insert earphone (Etymotic ER6i). The test ear was the ear the participants normally used when talking on the telephone.
Verification of amplification characteristics
During a preliminary visit, real-ear-to-coupler differences (RECD) were obtained using the AudioScan Verifit VF1. The RECD measures were obtained using the same insert earphone that was to be used for speech-recognition testing.
The simulated real-ear verification measures were completed in the hearing-aid test box using the individually-measured RECDs. Because the initial programming of the PC-based system was somewhat time consuming, simulated real-ear verification was used to reduce the initial session duration for the participants. During the verification process, the cellular phone system was programmed to approximate NAL-NL1 amplification targets for an input level of 75 dB SPL (Byrne et al., 2001). The SpeechMapping module of the Verifit was used to deliver a 75-dB-SPL-speech signal to the cellular-phone microphone which was placed in the test box in the measurement position. A 75-dB-SPL-input signal was chosen to approximate the level of speech at the microphone of a cellular phone during a cell-phone call. This choice was based on preliminary level measurements at the cell-phone mic (range 74–77 dB SPL) for two different talkers during a phone call. A call was initiated and the output of the system was measured through an HA-1 coupler attached to the Etymotic ER6i earphone at the output of the receiving computer. Custom written MATLAB software (v7.0) was used to verify that no digital clipping occurred.
Cellullar-phone gain settings in the eight channels were set in combination with the external amplifier to match the output as closely as possible to the targets. Amplification was set to provide linear amplification for input levels up to 80 dB SPL. Above 80 dB SPL, gains were set to give a compression ratio of approximately 2:1. Compression below 80 dB SPL was not considered useful for this application because a single moderately-high (75 dB SPL) input signal was used. The hearing-aid microphone effects incorporated in the Verifit software were subtracted from the simulated real-ear aided response (REAR) measures before comparing the measured output to the target output.
Separate adjustments were made to the frequency responses for the EVRC (narrowband) and SMV-WB (wide-band) cellular-phone encoding schemes. It was not necessary, however, to verify individual frequency responses using the SMV-NB encoder because the two narrowband encoding schemes (EVRC, SMV-NB) share the same amplification parameter files and therefore produce the same frequency responses. During the initial testing of the system using the same verification procedures described above, we confirmed that the spectra of speech played through the two narrow-band encoding schemes were the same.
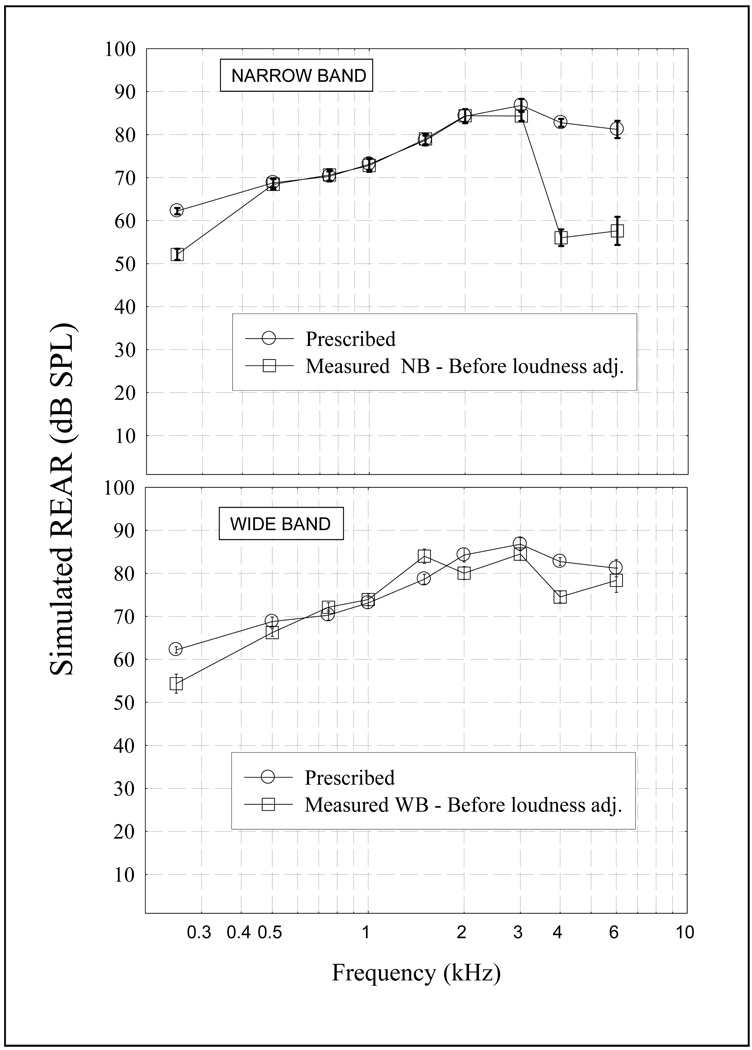
Figure 4 illustrates the group mean real-ear aided response targets and the group mean measured simulated real-ear measures. The response for the narrow-band encoder (EVRC) and the wide-band encoder (SMV-WB) are shown at top and bottom, respectively. The measured real-ear aided response for the narrow-band encoder reflects the expected roll-off above 3 kHz. Mean narrow-band responses were within 3 dB of targets between 0.5 and 3 kHz. Mean wide-band responses were within 5 dB of targets between 0.5 and 6 kHz with the exception of an 8 dB deviation at 4 kHz. It is important to note that these responses were obtained before adjustments were made during loudness testing (see below).
Figure 4.
Mean prescribed and simulated real-ear aided responses before loudness adjustments for a narrow-band (top) and wide-band encoder (bottom). The error bars denote ± 1 standard error.
Conditions
The study was carried out using a repeated-measures design in which tests were administered to each participant under all possible listening conditions. The individualized-amplification setting and standard setting were evaluated for each of the three cellular-phone encoding strategies in quiet and at a signal-to-noise ratio (SNR) of +5 dB, yielding a total of 12 test conditions (two amplification processing conditions × three encoding strategies × two listening conditions (quiet, noise)). A signal-to-noise ratio of +5 dB was chosen to represent a moderately-noisy listening environment typical of many real-world settings.
Procedures
Loudness measures
Loudness ratings and adjustments were completed prior to speech- recognition testing to ensure that the overall intensity level was set at listeners’ most comfortable loudness levels for both the individualized-amplification and the standard phone settings. Loudness adjustments were included because cellular-phone users are able to control the volume on commercially-available cellular phones. As noted earlier, however, cellular phones vary in the volume available to the listener. Therefore, some of the higher intensity levels chosen by participants for the standard phone setting in this study may overestimate the available volume on commercially-available cellular phone. Nevertheless, by adjusting the level to optimal loudness, we were able to examine the “best possible” volume setting using the standard cellular-phone response.
During loudness testing, digitized CUNY Sentences (Boothroyd et al., 1988) recorded by a female talker were played through the signal-cone loudspeaker in the transmission room at a level of 75 dB SPL and picked up by the cell-phone microphone after a call was initiated. The stimuli were calibrated by measuring the level of a calibration warble tone (scaled to the same RMS level as the speech) using a Quest sound-level meter (Model 155) positioned at the cell-phone microphone. Testing was carried out in two phases. During the first phase, participants were instructed to adjust a dial on the external amplifier until the speech sounded “comfortably loud”. A mask was placed over the dial markings so the participants could not see the levels. After each adjustment, the tester reset the level by turning the dial to a lower (and different) starting point. Participants adjusted the dial a total of three times. The purpose of phase one was to provide a starting point for phase two.
During the second phase of testing, the examiner controlled the intensity. Participants were asked to rate the speech using an 8-point scale ranging from “1” (“cannot hear”) to “8” (“uncomfortably loud”) (Hawkins et al., 1987; Cox and Gray, 2001). The goal was to find the level(s) that resulted in consistent ratings of “5 – comfortably loud”. The dial was initially set 10 dB below the lowest level corresponding to a rating of “comfortably loud” obtained when the participant adjusted the dial. The intensity was increased in 2-dB steps until a rating of “6 - loud, but ok” was obtained. This process was repeated two more times using randomly determined starting levels 2–4 dB higher or lower than the previous starting level. The final intensity level to be used for testing was the level at which two or more ratings of “5 - comfortably loud” were obtained. If a range of levels was rated as “5-comfortably loud”, the midpoint of the range was used. Additional measures were obtained for participants who did not rate the same level as comfortably loud at least twice during the three runs. Six separate loudness ratings were obtained in random order (three encoding strategies × two processing conditions (individualized amplification, standard).
Phoneme-recognition measures
The Computer-Assisted Speech-Perception Assessment (CASPA) software was used to assess phoneme recognition using monosyllabic words. The CASPA materials consist of digitized word lists, recorded by a female talker (Mackersie, et al., 2001). The ten-word lists consist of vowel-consonant-vowel words with one example of each of the same 30 phonemes in each list. Scores are based on the number of phonemes repeated correctly.
Phoneme recognition was measured in quiet and in noise using a 75-dB-SPL speech level delivered to the cell-phone microphone connected to the transmitting computer. Noise was delivered from two loudspeakers in the same room as the transmitting computer. The noise was non-correlated steady-state spectrally-matched noise presented at a level of 70 dB SPL (+ 5 dB signal-to-noise ratio) measured at the cell-phone microphone. Two 10-word lists were presented under each condition.
Testing was completed in two sessions. The same ear was used in both test sessions. In each session, phoneme-recognition testing was completed in either quiet or in noise. The session assignment for the listening condition (i.e. quiet, noise) was counterbalanced across the participants. Participants completed ratings for all conditions within each encoding scheme before continuing to the next encoding condition. The presentation order for the encoding conditions was counterbalanced across participants using a partial-Latin square design in which two of the three possible orders were assigned to two separate groups of five participants and one of the three possible orders was assigned the remaining four participants. Within a given encoding condition, participants completed ratings for the standard or individualized-amplification settings, alternating the order of amplification condition across participants.
Subjective ratings
Participants were asked to complete subjective ratings of concatenated CUNY Sentences played through the cellular-phone system using the standard setting and individualized-amplification setting. The talker was the same talker used to record the CASPA materials. Stimuli were played through the same computer and sound system used for the phoneme recognition testing. Ratings were made on dimensions of listening effort and overall sound quality using an integer scale with categorical anchors. The categorical anchors for listening effort were “tremendous effort” (1), “quite a lot of effort” (3), “moderate effort” (5), “slight effort” (7), and “very little effort” (9). The categorical anchors for overall sound quality were “very bad” (1), “rather bad” (3), “midway” (5), “rather good” (7), and “very good” (9). Participants indicated the ratings by marking the response on a numbered horizontal line annotated with the categorical anchors. The participants were encouraged to use values between the categorical anchors and to use the full scale if needed.
Subjective ratings were obtained for each of the three encoding strategies using the standard and individualized-amplification settings. The sentences were presented in quiet at 75 dB SPL and in spectrally-matched speech babble at a signal-to-noise ratio of +5 dB. The sentences and noise were delivered from the same loudspeakers as were the words used in the recognition task. Participants completed a total of four ratings on each quality dimension for each of the twelve conditions (two amplification settings × three encoders × two environments [quiet and noise]).
Participants completed ratings for all conditions within each encoding scheme before continuing to the next encoding condition. The presentation order for the encoding conditions was counterbalanced across participants using the same partial-Latin square design scheme described above. Within a given encoding condition, participants completed ratings for the standard or individualized-amplification settings, alternating the order of amplification condition across participants. Within a given amplification condition, participants completed ratings in quiet and in noise. Ratings obtained during session one were replicated in session two. Means were computed for the purposes of statistical analysis.
RESULTS
Phoneme recognition
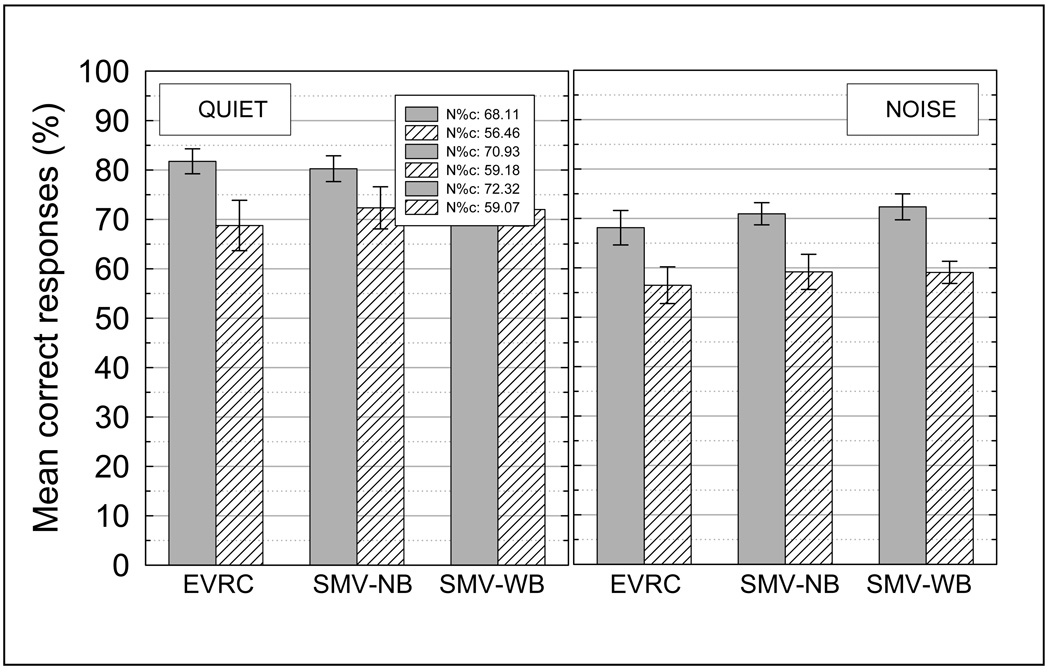
Mean phoneme-recognition scores for the individualized-amplification setting and standard cellular-phone setting are shown in Figure 5 for each of the three cellular-phone encoding strategies. Performance in quiet and in noise appear in the left and right panels, respectively. Mean phoneme-recognition scores were higher for the individualized-amplification setting than for the standard setting. No participant had lower scores for the individualized-amplification setting than for the standard setting. The mean scores for each of the three cellular -phone encoding strategies were within five percentage points of one another within each amplification condition.
Figure 5.
Mean phoneme recognition scores in quiet and in noise for the individualized-amplification setting and the standard setting for each of the three cellular phone encoding strategies. The error bars denote ± 1 standard error.
Percentage scores were transformed to rationalized arcsine units before statistical analysis in order to stabilize the error variance (Studebaker, 1985). A repeated-measures analysis of variance was completed using encoding strategy, amplification setting, and listening environment (quiet, noise) as factors. A significant main effect of amplification setting was observed (F(1,13) = 20.52, p < .001) reflecting the higher scores for the individualized-amplification setting. A significant main effect of listening environment was also observed (F(1,13) = 70.95, p < .0001) confirming the significance of the lower recognition scores in the presence of background noise. No other significant main effects or interactions were found at or below the .05 level of significance. There was no correlation between the amount of recognition benefit from the individualized-amplification setting and either hearing-loss slope between .5 and 4 kHz (r (13) = −0.04, p = .89) or pure-tone average (r (13) = 0.46, p = .11).
An effect-size calculation was completed for the significant amplification effect. The standardized effect (Es) was 1.216, indicative of a large effect size.
Subjective ratings
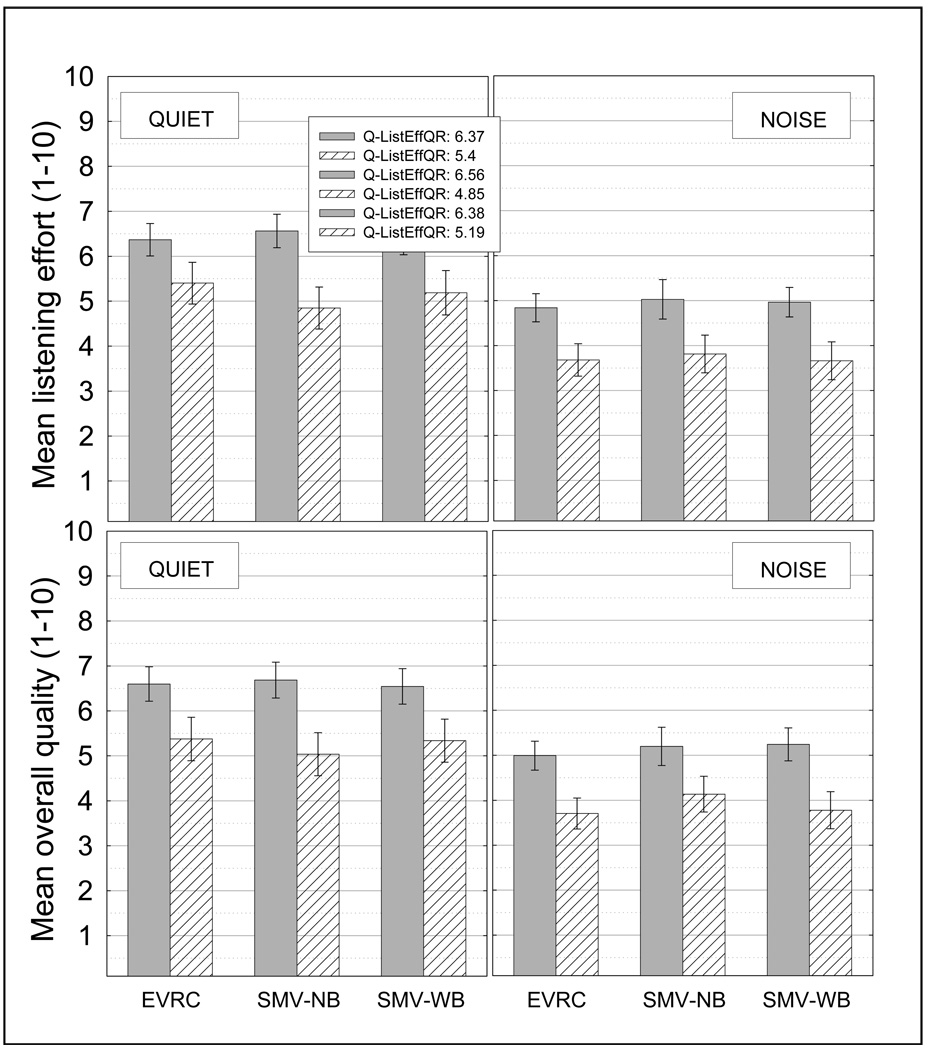
Mean ratings of listening effort and overall quality are shown in Figure 6 in the top and bottom panels, respectively. Recall that higher values on the listening-effort scale correspond to greater ease of listening whereas lower scores correspond to greater listening effort. Mean ratings were higher for the individualized-amplification setting than for the standard setting for both quality dimensions. However, subjective ratings were similar for the three different encoding strategies within a given listening condition.
Figure 6.
Mean ratings of listening effort and overall quality for the individualized-amplification setting and the standard setting for each of the three cellular phone encoding strategies. The error bars denote ± 1 standard error.
Repeated-measures analyses of variance using Greenhouse-Geisser corrections were completed separately for listening effort and overall quality (Greenhouse and Geisser, 1959). There was a significant main effect of amplification for both subjective dimensions (Listening effort: F(1,13) = 12.41, p < .01; Overall quality: F(1,13) = 10.79, p < .01). There was, however, no significant main effect of encoding (Listening effort: F(2,22) = 0.01, p > .05; Overall quality: F(2,22) = 0.13, p > .05). Expectedly, there was also a significant main effect of noise for both subjective dimensions (Listening effort: F(1,13) = 21.57, p < .01; Overall quality: F(1,13) = 20.58, p < .01). There were no significant interactions at or below the .05 level of significance for either listening effort or overall quality.
Effect-size calculations of the significant amplification effect were completed for both the listening effort and overall quality data. The standardized effect (Es) was 0.886 and 0.881 for the listening effort and overall quality ratings, respectively.
DISCUSSION
As predicted, a significant improvement in phoneme-recognition scores was observed with the individualized selective-amplification phone setting compared to the standard setting. Although the overall volumes for the individualized-amplification and standard settings were set to give similar (preferred) loudness levels, the individualized settings provided considerably more high-frequency gain (average = +13.2 dB above 1 kHz) than the standard response - a factor that was most likely responsible for the recognition advantage. This recognition advantage was realized despite the fact that a cellular-phone encoded speech signal is degraded relative to natural and hearing-aid-processed speech. The quality ratings were consistent with the phoneme-recognition results with higher ratings for the individualized-amplification settings than the standard settings for both listening effort and overall quality. This correspondence between quality ratings and recognition results across conditions in which recognition varies has been documented by previous investigators (e.g. Preminger and Van Tasell, 1995).
Contrary to predictions, scores for the wide-band encoding scheme were not higher than scores for the narrow-band encoders. Moreover, there is no evidence that the wide-band encoder reduces listening effort or has an advantage over other encoders in terms of overall sound quality. One possible explanation for this finding lies in the trade-offs needed to implement the wide-band speech encoding. As noted earlier, encoded speech often is not a true wide-band representation of the speech signal; but a modeled reconstruction of the signal. In order to maintain a low bit rate while increasing bandwidth, designers may make further sacrifices in signal fidelity. Signal fidelity is subject to loss because the encoding process only models the speech signal approximately. The lower the bit-rate, the lower the accuracy of the approximation will be.
It is important to note that the current study only examined one wide-band encoder. Evaluation of other wide-band encoding strategies may be needed. A comparative evaluation of narrow- and wide-band encoding will become feasible when the technologies become more mature and widely available in commercial cellular phones.
There are several practical considerations regarding future implementation of the cellular-phone technology used in the current study. First, further consideration is needed regarding the coupling between the cellular phone and the ear. Coupling via an ear bud or a Bluetooth device is feasible, but it is likely that some standardization will be required. Alternatively, conventional hand-held coupling between the phone and ear is likely to result in a loss of low frequencies that will need to be taken into account in the software. Secondly, the issue of programming will need to be addressed. Although it is feasible for an audiologist to provide the necessary hearing evaluation and real-ear measures to program the appropriate frequency response, it is unclear whether the end user would take advantage of these services. A possible solution would involve a combination of cellular-phone hardware and software that would enable a user to complete threshold measures and ear canal acoustic measures using the phone. Further work is needed to explore these issues before practical implementation can be realized.
The wide-dynamic range compression feature of the cellular phone hearing-aid function was not evaluated in the current study. The usefulness of this feature for cellular phone communication may be limited when the phone is used in the conventional manner (i.e. headset held to the mouth and ear) because of the relatively high input level of a talker’s voice at the cellular phone microphone. The WDRC feature may become beneficial, however, if a speaker-phone feature is used at some distance from the speaker’s mouth.
There are several factors that limit the generalizability of this study. First, the participants had a pure-tone average ranging from 25 to 53 dB HL with a range of configurations. It is unknown to what extent the results can be generalized to participants with greater hearing losses. It is unlikely, however, that people with greater hearing losses would be using the individualized-amplification feature of the cellular-phone technology used in this study because the technology is intended for people who do not wear hearing aids. Secondly, results were obtained in quiet and at one signal-to-noise ratio in steady-state noise. It is unknown to what extent the improvements would be maintained with poorer signal-to-noise ratios or a different type of noise. Finally, although the present findings support the feasibility of enhancing speech recognition over cellular phones by non-hearing aid users with hearing loss, the study did not incorporate true cellular-phone communication. Specifically, signals were transmitted over the internet rather than through the wireless channels normally used for cell-phone communication. Although it is not expected that the mode of transmission would affect the results, this possibility needs to be explored.
CONCLUSIONS
The incorporation of individualized selective cellular-phone amplification, used without hearing aids, can result in improved speech recognition by persons with hearing loss.
Improvements in recognition are paralleled by better subjective ratings of listening effort and overall sound quality.
These improvements are present in both quiet and noise and, in this study, were independent of cell-phone encoding strategy.
In this study, extending the bandwidth of the cellular -phone response via an available wide-band encoding strategy failed to provide measurable benefit for speech recognition or subjective ratings of listening effort and overall quality.
It is not known whether this last finding will generalize to other wide-band strategies.
Acknowledgements
Work supported by NIDCD 5R44DC006734-03
Glossary
- EVRC
enhanced variable rate coder
- IFIR
interpolated finite implulse response
- NAL-NL1
National Acoustics Laboratory nonlinear version 1
- SMV-WB
wide-band selectable mode vocoder
- SMV-NB
narrow-band selectable mode vocoder
- RECD
real-ear-to-coupler differences
- REAR
real-ear aided response
- WDRC
wide dynamic-range compression
References
- Boothroyd A, Hnath-Chisolm T, Hanin L, Kishon-Rabin L. Voice fundamental frequency as an auditory supplement to the speechreading of sentences. Ear Hear. 1988;9:306–312. doi: 10.1097/00003446-198812000-00006. [DOI] [PubMed] [Google Scholar]
- Byrne D. Hearing aid selection for the 1990s: where to? J Am Acad Audiol. 1996;7:377–395. [PubMed] [Google Scholar]
- Byrne C, Cotton S. Evaluation of the National Acoustic Laboratories' new hearing aid selection procedure. J and Hear Res. 1988;31:178–186. doi: 10.1044/jshr.3102.178. [DOI] [PubMed] [Google Scholar]
- Byrne D, Dillion H, Ching T, Katsch R, Keidser G. NAL-NL1 procedure for fitting nonlinear hearing aids: Characteristics and comparisons with other procedures. J Am Acad Audiol. 2001;12:37–51. [PubMed] [Google Scholar]
- Cox RM, Gray G. Verifying loudness perception after hearing aid fitting. Am J Audiol. 2001;10:91–98. doi: 10.1044/1059-0889(2001/009). [DOI] [PubMed] [Google Scholar]
- Greenhouse SW, Geisser S. On methods in the analysis of profile data. Psychometrika. 1959;24:95–112. [Google Scholar]
- Hawkins DB, Walden BE, Prosek RA. Description and validation of an LDL procedure designed to select SSPL90. Ear Hear. 1987;8:162–169. doi: 10.1097/00003446-198706000-00006. [DOI] [PubMed] [Google Scholar]
- Kochkin S. Marke Trak V. Why my hearing aids are in the drawer: The consumer's perspective. Hear J. 2000;53:34–42. [Google Scholar]
- Kochkin S. Marke Trak VII: Obstacles to adult non-user adoption of hearing aids. Hear J. 2007;60:24–50. [Google Scholar]
- Mackersie CL, Boothroyd A, Minniear D. Evaluation of a computer-assisted speech perception assessment test (CASPA) J Am Acad Audiol. 2001;13:38–49. [PubMed] [Google Scholar]
- Mackersie CL, Crocker TL, Davis RA. Limiting high-frequency hearing aid gain in listeners with and without suspected cochlear dead regions. J Am Acad Audiol. 2004;15:498–507. doi: 10.3766/jaaa.15.7.4. [DOI] [PubMed] [Google Scholar]
- Preminger JE, Van Tasell DJ. Measurement of speech quality as a tool to optimize the fitting of a hearing aid. J Speech Hear Res. 1995;38:726–736. doi: 10.1044/jshr.3803.726. [DOI] [PubMed] [Google Scholar]
- Skinner MW, Karstaedt MM, Miller JD. Amplification bandwidth and intelligibility of speech in quiet and noise for listeners with sensorineural hearing loss. Audiol. 1982;21:251–268. doi: 10.3109/00206098209072743. [DOI] [PubMed] [Google Scholar]
- Studebaker GA. A "rationalized" arcsine transform. J Speech Hear Res. 1985;28:455–462. doi: 10.1044/jshr.2803.455. [DOI] [PubMed] [Google Scholar]
- Studebaker GA. The effect of equating loudness on audibility-based hearing aid selection. J Am Acad Audiol. 1992;3:113–118. [PubMed] [Google Scholar]


