

Abstract
Background
Polymorphisms in CYP2B6 affect steady-state plasma concentrations of nevirapine and efavirenz. In many resource-limited countries, single-dose nevirapine has been widely prescribed to pregnant women at delivery to reduce mother-to-child transmission. We characterized relationships between genetic polymorphisms and the pharmacokinetics of single doses of nevirapine and efavirenz.
Methods
Plasma drug concentrations were determined over 13 days following a 200-mg oral dose of nevirapine administered to non-pregnant, HIV-negative African Americans. A 600-mg oral dose of efavirenz was subsequently administered and pharmacokinetic sampling repeated. Pharmacokinetic parameters were estimated using a non-compartmental approach. Primary analyses involved two CYP2B6 polymorphisms (516G>T and 983T>C) known to predict increased steady-state plasma nevirapine and efavirenz exposure. Exploratory analyses involved another 51 polymorphisms in CYP2B6, ABCB1, CYP3A4 and CYP3A5.
Results
Based on composite CYP2B6 516/983 genotype, the 34 participants comprised 10 extensive, 17 intermediate, and 7 slow metabolizer genotypes. Composite CYP2B6 516/983 genotype was significantly associated with plasma drug exposure and clearance for efavirenz but not for nevirapine. Exploratory analyses suggested possible associations between additional CYP2B6 polymorphisms and pharmacokinetics for nevirapine and efavirenz.
Conclusions
Selective pressure for drug-resistant HIV-1 following single-dose nevirapine may not differ substantially by CYP2B6 516/983 genotype. Additional polymorphisms, genes and populations warrant further study.
Keywords: efavirenz, nevirapine, CYP2B6, pharmacokinetics, HIV-1
Introduction
The non-nucleoside reverse transcriptase inhibitors (NNRTIs) nevirapine and efavirenz are widely prescribed in multidrug regimens to treat HIV-1 infection. Both drugs have long plasma half-lives [1,2] and low barriers to viral genetic resistance such that a single mutation in HIV-1 reverse transcriptase confers resistance [2]. Whereas use of efavirenz is strongly discouraged during the first trimester of pregnancy because of potential harm to the fetus [3], nevirapine is extensively used during pregnancy to prevent mother-to-child transmission. In resource-limited countries this typically involves administering a single 200 mg oral dose of nevirapine to the mother at the time of delivery, with or without additional antiretroviral agents [4]. Unfortunately, because of nevirapine's long half-life, low genetic barrier to resistance, and the rapid mutability of HIV-1 [5], even a single dose if given as monotherapy can select for NNRTI-resistant virus in the mother [6-8]. This compromises efficacy of subsequent NNRTI-containing multidrug regimens, particularly when initiated within six months after the single dose [9-11].
There is considerable inter-individual variability in disposition of antiretroviral agents, at least some of which is caused by polymorphisms in drug metabolism genes. Both nevirapine and efavirenz are metabolized primarily by cytochrome P450 (CYP) 2B6 [12-14]. A frequent CYP2B6 variant (516G>T) predicts decreased plasma efavirenz clearance and increased plasma efavirenz exposure at steady state [15-17]. A less frequent CYP2B6 polymorphism, 983C>T, also predicts increased plasma efavirenz exposure of a similar magnitude (although data is scant for 983 C/C homozygosity) [18-20]. More recent data establish that CYP2B6 516G>T and 983T>C are also associated with increased steady-state plasma nevirapine exposure [17,21,22]. Both CYP2B6 516T and 983C are more frequent among individuals of African ancestry than among Caucasians [15,16].
The present study characterized relationships between genetic polymorphisms and plasma pharmacokinetics of nevirapine and efavirenz following single doses administered to healthy, non-pregnant HIV-negative African Americans.
Material and Methods
Study Subjects and Design
This study enrolled African Americans, based solely on self-reported identity. Eligible participants were healthy, with acceptable screening hematology, chemistry studies, negative HIV serologies, and undetectable plasma HIV-1 RNA. Women of child bearing potential had negative pregnancy tests. Exclusion criteria included use of medications known or predicted to interact with hepatic cytochrome P450 isoforms. Human experimentation guidelines of the US Department of Health and Human Services were followed in the conduct of this research. All work was conducted in accordance with the Declaration of Helsinki. The study was approved by the Vanderbilt Institutional Review Board, and all participants provided written informed consent.
On day 0 each participant received a single 200-mg oral dose of nevirapine, followed by serial sampling for pharmacokinetics. At least 3 weeks after receiving nevirapine each participant then received a single 600-mg oral dose of efavirenz, followed by serial sampling for pharmacokinetics. Study drugs were administered by study personnel. The study was performed in the Vanderbilt General Clinic Research Center.
Drug Assays
Plasma samples for drug assays were obtained at 0.5, 1, 2, 4, 6, 8, and 12 hours after each dose, and on days 1 (24 hours), 2, 3, 5, 7, 9 and 13. Plasma was separated by centrifugation at 4°C and stored at -70°C. Nevirapine and efavirenz were quantified in the laboratory of Dr. Grant Wilkinson, with liquid-liquid extraction using cyclohexane followed by isocratic high performance liquid chromatography (HPLC). In each assay a 0.5 mL aliquot of plasma was spiked with a 10ug/mL solution of carbamazepine in MeOH which was used as the internal standard (50uL for efavirenz, 40uL for nevirapine). To this was added 500uL of saturated sodium borate (pH= approx. 9.5). Liquid-liquid extraction was achieved by shaking the sample for 15 minutes with 6 mL of cyclohexane. Samples were then centrifuged for 10 minutes and the upper organic layer separated and dried down at 40°C under a stream of nitrogen. The residue was reconstituted in 200 uL of mobile phase, and 50 uL of the extract was injected into an Ultrasphere C18 column of dimensions 25 cm × 4.6 mm, 5 μm (Beckman Coulter, Fullerton, CA) attached to a Brownlee C18 guard cartridge. The mobile phase used to assay efavirenz was a mixture of water/acetonitrile/diethylamine - 65/35/0.2 (v/v/v). The flow rate was maintained at 1.1 mL/min and UV detection of the peaks for efavirenz and carbamazepine was achieved at 269 nm, in a run time of about 11 minutes. For nevirapine a mobile phase of water/acetonitrile - 70/30 (v/v) at a flow rate of 1 mL/min was used, and UV detection of peaks for nevirapine and carbamazepine was achieved at 215 nm in a run time of about 16 minutes. Assays were linear over a concentration range of 50-5000 ng/mL. For the efavirenz method the r2 for calibration curves ranged from 0.9911 to 0.9994 (mean = 0.9970). For the nevirapine method the r2 for calibration curves ranged from 0.9918 to 0.9998 (mean = 0.9970). The CV for nevirapine and efavirenz in the assay range 500 ng/ml to 3000 ng/ml ranged from 4.1-11.8%.
Pharmacokinetic Parameter Estimates
Pharmacokinetic parameter estimates were determined using a non-compartmental approach (WinNonlin version 4.01, Pharsight Corp., Mountain View, CA). Calculated parameters were: area-under-the-curve (AUC), maximum plasma concentration (Cmax), time to Cmax (Tmax), oral clearance (CL/F), terminal apparent distribution volume (Vz/F), and elimination half-life (t1/2). The terminal elimination t1/2 was based on the slope of the regression line through at least the final 3 concentration-time points. AUC was determined using the linear/log trapezoidal method. Cmax and Tmax were taken directly from the observed concentration-time data. CL/F was calculated as dose/AUC. Vz/F was calculated as dose divided by the product of the elimination rate constant (λz) and AUC. T1/2 was calculated as ln(2)/λz. Pharmacokinetic parameters were determined by Dr. Edward Acosta, who was blinded to genotyping results. Protein binding-corrected 95% inhibitory concentration (pbIC95) values for nevirapine and efavirenz were provided by Monogram Bioscience (San Francisco, CA).
Statistical Methods
Pharmacokinetic parameters are presented as median and interquartile ranges [IQR]. Body mass index (BMI) was calculated as weight in kilograms divided by the square of the height in meters. Spearman correlation coefficient (rho) was used to assess for dose-response trends in bivariate relationships between continuous variables and genotype, and to determine the directionality of such relationships. For CYP2B6 516/983, genotype was coded as an ordered continuous variable with 1 denoting extensive, 2 intermediate, and 3 slow metabolizer. For other exploratory polymorphism analyses, 1 denoted homozygous, 2 denoted heterozygous, and 3 denoted the other homozygous genotype, ordered as A < C < G < T. Multiple linear regression models were used to test for effects of trend based on genotype as an ordered continuous variable and pharmacokinetic response parameters adjusted for body mass index and gender. For all multivariable models, regression residuals were examined graphically and sensitivity analysis was conducted using Box-Cox transformations of pharmacokinetic response variables to achieve normality of the residuals. Results were similar for analyses with untransformed outcome variables. Results from untransformed models are presented. All reported P values are unadjusted for multiple tests. All analyses used a 5% two-sided significance level and were performed with R version 2.6.2 (www.r-project.org) and SAS 9.1, (Cary, NC). Linkage disequilibrium plots (LD) and values were generated using Haploview (www.broad.mit.edu/mpg/haploview/). Hardy-Weinberg equilibrium was assessed using exact tests [23].
Characterization of Human Genetic Variants
Genomic DNA was extracted from whole blood. Genotyping of polymorphisms of primary interest (CYP2B6 516G>T [CYP2B6*6] and 983T>C [CYP2B6*18]) was accomplished with the ABI PRISM 7900 HT Sequence Detection System (Applied Biosystems, Inc., Foster City, CA). TaqMan™ assays were used to genotype CYP2B6 polymorphisms 516G>T (rs3745274, assay ID C_7817765_60) and 983T>C (rs28399499, assay ID C_60732328_10). Performance for CYP2B6 516G>T was improved by digesting genomic DNA with Xho1 before assay. Data were analyzed using the ABI Sequence Detection System version 2.1 software. Composite CYP2B6 genotypes, based on reported associations with steady-state efavirenz pharmacokinetics [18-20], were assigned as follows: extensive metabolizer, no variant allele at either position 516 or 983; intermediate metabolizer, a single variant allele at either position 516 or 983, but not both; slow metabolizer, two variant alleles (i.e. either 516 T/T, 983 C/C, or 516 G/T with 983 T/C). For exploratory analyses an additional 51 polymorphisms (46 in CYP2B6, 3 in ABCB1, 1 in CYP3A4 and 1 in CYP3A5) were assayed using MassARRAY® iPLEX Gold (Sequenom, Inc.). Our strategy for CYP2B6 Sequenom assay design was a follows. We tagged the entire CYP2B6 gene using SeattleSNPs (http://pga.gs.washington.edu/), including 5 kB in each 5′ and 3′ untranslated regions (UTR), using a cosmopolitan strategy across populations (Yoruba, Asian, African-American, European-American, and Hispanic) with a 5% allelic frequency cut-off, a 0.80 threshold for r2, 85% data convergence for tagging polymorphisms, and 70% data convergence for clustering. Additional polymorphisms of interest (but that were not extremely infrequent) were added based on previous reports [19,20]. We also added polymorphisms with at least 5% allelic frequency in 20 kB of the 5′ UTR identified using Ensembl Genome Browser (http://www.ensembl.org/index.html), as well as upstream polymorphisms possibly associated with CYP2B6 expression based on a previous report [24]. (Final Sequenom assay design available upon request.) Genotypes were confirmed by visual inspection of plots. Laboratory personnel with no knowledge of clinical data performed genotyping. All assays were run in duplicate, and were in complete agreement. No individual was excluded from participation based on genotype.
Results
Participant Characteristics
Thirty-four individuals underwent pharmacokinetic sampling. Median age was 24 years [IQR 21 - 33 years], median weight was 68.8 kg [IQR 61.5 - 87.8 kg], median BMI was 24 kg/m2 [IQR 23 - 31 kg/m2] and 26 (76%) were female. Genotype data for all polymorphisms assayed (rs number, gene position, chromosome position, genotype frequency, and minor allele frequency) are presented in Supplemental Materials. Based on composite CYP2B6 516G>T and 983T>C genotype (hereafter referred to as CYP2B6 516/983 genotype), seven individuals were predicted to be slow metabolizers (five homozygous for CYP2B6 516 T/T, two heterozygous for both 516 G/T and 983 T/C). No individuals were homozygous for CYP2B6 983 C/C. Seventeen were predicted to be intermediate metabolizers, of whom 16 (94%) were heterozygous for CYP2B6 516 G/T. Genotype groups did not differ significantly by age, sex, or BMI.
Nevirapine Pharmacokinetics
Plasma concentration-time profiles for nevirapine are presented in Figure 1. There was considerable interindividual variability in plasma nevirapine exposure over the 13 days following a single 200 mg dose. In all participants concentrations exceeded the nevirapine protein binding-corrected IC95 for wild-type HIV-1 (196.6 ng/mL) for at least 5 days. Summary nevirapine pharmacokinetic data for all study participants, and according to CYP2B6 516/983 genotype, are presented in Table 1. There was no significant relationship between CYP2B6 516/983 genotype and AUC0-312h, clearance, Cmax, half-life or volume of distribution for nevirapine. To assess the duration of selective pressure for drug-resistance that would be exerted on wild-type HIV-1 we calculated times until plasma nevirapine would fall to the protein binding-corrected IC95 for nevirapine. Again, CYP2B6 516/983 genotype did not predict a difference in time above protein binding-corrected IC95. Similarly, in analyses involving CYP2B6 516G>T and 983T>C separately there were no significant associations with nevirapine pharmacokinetics (data not shown).
Figure 1.

Plasma concentration-time curves for nevirapine and efavirenz. Each curve represents a different study participant. A pre-dose concentration of zero was assigned to all participants. Individuals with a composite CYP2B6 516/983 slow metabolizer genotype are highlighted by heavy black lines. Panel A: Nevirapine concentrations during the first 24 hours post-dose. Panel B: Nevirapine concentrations during the 13 days post-dose (semi-log scale). The horizontal dashed line indicates 196.6 ng/mL, the nevirapine protein binding-corrected IC95 (pcIC95) for wild-type HIV-1. Panel C: Efavirenz concentrations during the first 24 hours post-dose. Panel D: Efavirenz concentrations during the 13 days post-dose (semi-log scale). The horizontal dashed line indicates 54.7 ng/mL, the efavirenz protein binding-corrected IC95 for wild-type HIV-1.
Table 1.
Primary analysis of relationships between CYP2B6 516/983 genotype and pharmacokinetic parameters
|
CYP2B6 position 516/983 composite genotypea Median [interquartile range] |
|||||||
|---|---|---|---|---|---|---|---|
| Parameter | All (N = 34) | Extensive (n = 10) | Intermediate (n= 17) | Slow (n = 7) | Spearman's rhob |
unadjusted P valuec |
adjusted P valued |
| Nevirapine | |||||||
| AUC0-312h (mg*hr/L) | 143 [125-162] | 143 [129-148] | 139 [111-175] | 147 135-163 | 0.11 | 0.551 | 0.350 |
| Clearance (L/hr) | 1.29 [1.11-1.48] | 1.34 [1.21-1.38] | 1.28 [1.09-1.58] | 1.29 [1.17-1.36] | -0.06 | 0.735 | 0.551 |
| Time to IC95 (hrs) | 200 [177-228] | 217 [191-241] | 199 [175-212] | 195 [170-224] | -0.15 | 0.396 | 0.940 |
| Distribution volume (L) | 136 [101-198] | 142 [109-194] | 150 [115-208] | 118 [75-136] | -0.13 | 0.461 | 0.825 |
| Cmax (μg/L) | 1682 [1437-2135] | 1677 [1335-2080] | 1669 [1287-2056] | 1922 [1542-2524] | 0.17 | 0.346 | 0.577 |
| Half-life (hr) | 75 [54-104] | 80 [55-103] | 75 [59-126] | 73 [38-80] | -0.11 | 0.518 | 0.978 |
| Efavirenz | |||||||
| AUC0-312h (mg*hr/L) | 85 [63-107] | 68 [47-102] | 77 [63-99] | 123 [102-128] | 0.46 | 0.007 | 0.006 |
| Clearance (L/hr)e | 6.22 [4.67-8.38] | 7.57 [4.89-12.53] | 7.14 [5.47-8.38] | 4.09 [3.90-4.55] | -0.39 | 0.026 | 0.024 |
| Time to IC95 (hrs)e | 378 [283-455] | 355 [252-441] | 358 [281-424] | 494 [442-503] | 0.26 | 0.146 | 0.340 |
| Distribution volume (L)e | 1030 [811-1275] | 1103 [947-1305] | 1115 [838-1315] | 749 [642-920] | -0.37 | 0.039 | 0.134 |
| Cmax (μg/L) | 1864 [1469-2320] | 1642 [1469-1916] | 1878 [1376-2404] | 2344 [1780-2522] | 0.29 | 0.096 | 0.370 |
| Half-life (hr)e | 130 [85-142] | 126 [104-134] | 119 [81-147] | 136 [111-142] | 0.05 | 0.808 | 0.969 |
Composite CYP2B6 genotypes were as follows: extensive metabolizer, no variant allele at either position 516 or 983; intermediate metabolizer, a single variant allele at either position 516 or 983, but not both; slow metabolizer, two variant alleles (i.e. either 516 T/T, 983 C/C, or 516 G/T with 983 T/C).
Spearman rank correlation coefficient assessing monotonically increasing or decreasing trend by CYP2B6 genotype as an ordered continuous variable (extensive, intermediate, slow metabolizer).
P value corresponding to the Spearman rank coefficient test.
Multiple linear associations for pharmacokinetic parameters with CYP2B6 genotype as ordered continuous variable (1=slow, 2= intermediate, and 3=extensive metabolizer) after adjusting for body mass index and sex.
Two individuals (one slow metabolizer, one intermediate metabolizer) with multiple non-evaluable efavirenz assay timepoints did not contribute data to these parameters. Clearance and distribution volume parameters are apparent oral values.
Body mass index was inversely correlated with nevirapine Cmax (rho = -0.64, P < 0.0001), but did not correlate significantly with nevirapine clearance, half-life, AUC0-312h or volume of distribution (data not shown). In multivariable analyses that adjusted for BMI and sex there were still no associations between CYP2B6 516/983 genotype and pharmacokinetic parameters (Table 1).
Efavirenz Pharmacokinetics
Plasma concentration-time profiles for efavirenz among all study participants are presented in Figure 1. There was considerable interindividual variability in plasma efavirenz exposure over the 13 days following a single 600 mg dose. In all but one participant, concentrations exceeded the efavirenz protein binding-corrected IC95 (54.7 ng/mL) for at least 5 days.
Summary efavirenz pharmacokinetic data for all study participants, and according to CYP2B6 516/983 genotype, are presented in Table 1. In contrast to nevirapine, CYP2B6 genotype was associated with efavirenz pharmacokinetics. There was a relationship between CYP2B6 516/983 genotype and efavirenz plasma clearance, AUC0-312h, and volume of distribution, but not with time for plasma concentration to fall to the protein binding-corrected IC95 for efavirenz, half-life, or Cmax. In analyses involving each polymorphism separately there was a significant association between CYP2B6 516G>T and efavirenz AUC0-312h (rho= 0.45, P = 0.008), and with efavirenz clearance (rho= -0.39, P = 0.026). There were no other statistically significant associations with CYP2B6 516G>T.
Body mass index was directly correlated with efavirenz clearance (rho = 0.49, P = 0.0043) and volume of distribution (rho = 0.48, P = 0.0058), and inversely with AUC0-312h (rho= - 0.50, P = 0.0025). Body mass index did not correlate with efavirenz half-life, Cmax, or time to IC95 (data not shown). In multivariable analyses that adjusted for BMI and sex, CYP2B6 516/983 genotype remained significantly associated with efavirenz plasma clearance and AUC0-312h (Table 1).
Additional genetic polymorphisms
The lack of association between CYP2B6 516/983 genotype and nevirapine pharmacokinetics was unexpected. We therefore expanded genotyping to 51 additional polymorphisms (46 in CYP2B6, 3 in ABCB1, 1 in CYP3A4, 1 in CYP3A5) listed in Supplemental Materials. All polymorphisms were in Hardy-Weinberg equilibrium (P>0.05). There were no variant alleles detected for rs34619327. A linkage disequilibrium (LD) plot for CYP2B6 polymorphisms is provided in Figure 2. Relationships between polymorphisms and pharmacokinetic parameters for nevirapine are shown in Table 2. In these exploratory analyses, uncorrected for multiple comparisons, 12 CYP2B6 polymorphisms were associated with at least one nevirapine pharmacokinetic parameter (rho > 0.3 or < -0.3). These included five 5′ UTR and seven intronic polymorphisms, only one of which (rs892216) was in LD with CYP2B6 516G>T at r2 > 0.6 (Figure 2 and Table 2). There was no relationship between any polymorphism and BMI, and no ABCB1, CYP3A4, or CYP3A5 polymorphism was associated with nevirapine pharmacokinetic parameters.
Figure 2.
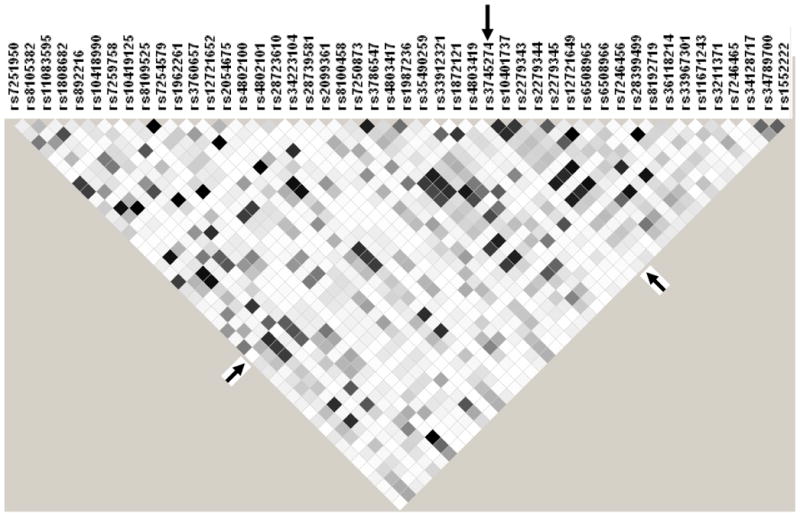
Linkage disequilibrium (LD) plot of CYP2B6 polymorphisms. Data from all 34 participants are included. Black, r2 = 1; shades of grey 0 < r2 < 1; white, r2 = 0. The plot was generated using Haploview software. The CYP2B6 516G>T (rs3745274) polymorphism is indicated by arrows.
Table 2.
Exploratory analysis of relationships between genetic polymorphisms and pharmacokinetic parameters
| nevirapine | efavirenz | ||||||||||||
|---|---|---|---|---|---|---|---|---|---|---|---|---|---|
| LD with 516G>Ta (r2) |
AUC0-312h (mg*hr/mL) |
Clearance (L/hr) |
Time to IC95 (hrs) |
Distribution volume (L) |
Cmax (ng/mL) |
Half- life (hr) |
AUC0-312h (mg*hr/mL) |
Clearance (L/hr) |
Time to IC95 (hrs) |
Distribution volume (L) |
Cmax (ng/mL) |
Half- life (hr) |
|
| CYP2B6b | rhoc | rho | rho | rho | rho | rho | rho | rho | rho | rho | rho | rho | |
| rs7251950 | 0.003 | 0.274 | -0.292 | 0.154 | -0.051 | -0.081 | 0.084 | 0.293 | -0.264 | 0.137 | -0.071 | 0.400 | 0.034 |
| rs8105382 | 0.292 | 0.481 | -0.341 | 0.134 | -0.198 | 0.187 | -0.019 | 0.465 | -0.453 | 0.443 | -0.117 | 0.471 | 0.264 |
| rs11083595 | 0.823 | -0.119 | -0.014 | 0.206 | 0.269 | -0.274 | 0.243 | -0.381 | 0.295 | -0.225 | 0.263 | -0.182 | -0.040 |
| rs892216 | 0.632 | 0.180 | 0.014 | -0.185 | -0.375 | 0.328 | -0.333 | 0.432 | -0.363 | 0.300 | -0.347 | 0.293 | 0.074 |
| rs8109525 | 0.019 | 0.335 | -0.327 | 0.243 | -0.112 | -0.101 | 0.050 | 0.231 | -0.248 | 0.263 | 0.024 | 0.257 | 0.224 |
| rs7254579 | 0.019 | -0.335 | 0.327 | -0.243 | 0.112 | 0.101 | -0.050 | -0.231 | 0.248 | -0.263 | -0.024 | -0.257 | -0.224 |
| rs1962261 | 0.121 | 0.191 | -0.217 | 0.033 | -0.013 | 0.059 | 0.105 | 0.375 | -0.380 | 0.307 | -0.080 | 0.178 | 0.183 |
| rs3760657 | 0.043 | 0.178 | -0.153 | 0.089 | -0.115 | -0.153 | -0.051 | 0.115 | 0.010 | 0.029 | 0.146 | 0.369 | 0.107 |
| rs12721652 | 0.313 | -0.452 | 0.325 | -0.109 | 0.182 | -0.149 | 0.010 | -0.414 | 0.375 | -0.361 | 0.149 | -0.443 | -0.191 |
| rs2054675 | 0.823 | -0.119 | -0.014 | 0.206 | 0.269 | -0.274 | 0.243 | -0.381 | 0.295 | -0.225 | 0.263 | -0.182 | -0.040 |
| rs4802100 | 0.043 | 0.178 | -0.153 | 0.089 | -0.115 | -0.153 | -0.051 | 0.115 | 0.010 | 0.029 | 0.146 | 0.369 | 0.107 |
| rs28739581 | 0.313 | 0.452 | -0.325 | 0.109 | -0.182 | 0.149 | -0.010 | 0.414 | -0.375 | 0.361 | -0.149 | 0.443 | 0.191 |
| rs8100458 | 0.019 | -0.322 | 0.292 | -0.208 | 0.167 | -0.022 | 0.018 | -0.245 | 0.288 | -0.319 | -0.127 | -0.304 | -0.271 |
| rs7250873 | 0.765 | 0.094 | -0.004 | -0.205 | -0.205 | 0.250 | -0.182 | 0.336 | -0.242 | 0.155 | -0.298 | 0.158 | -0.030 |
| rs3786547 | 0.884 | -0.141 | 0.014 | 0.196 | 0.270 | -0.292 | 0.234 | -0.419 | 0.325 | -0.237 | 0.313 | -0.184 | -0.038 |
| rs1987236 | 0.292 | -0.010 | -0.043 | 0.147 | 0.199 | -0.172 | 0.196 | -0.379 | 0.369 | -0.286 | 0.095 | -0.178 | -0.155 |
| rs35490259 | 0.135 | 0.599 | -0.414 | 0.215 | -0.375 | 0.311 | -0.144 | 0.433 | -0.410 | 0.460 | -0.217 | 0.336 | 0.310 |
| rs1872121 | 0.135 | 0.477 | -0.324 | 0.183 | -0.272 | 0.227 | -0.099 | 0.263 | -0.196 | 0.210 | -0.232 | 0.336 | 0.125 |
| rs3745274 | - | 0.198 | -0.089 | -0.104 | -0.243 | 0.204 | -0.188 | 0.447 | -0.392 | 0.335 | -0.273 | 0.315 | 0.147 |
| rs10401737 | 0.824 | -0.168 | 0.048 | 0.087 | 0.216 | -0.154 | 0.172 | -0.436 | 0.357 | -0.275 | 0.331 | -0.213 | -0.080 |
| rs2279343 | 0.831 | 0.064 | 0.013 | -0.153 | -0.132 | 0.134 | -0.104 | 0.381 | -0.269 | 0.159 | -0.275 | 0.287 | -0.033 |
| rs12721649 | 0.165 | 0.478 | -0.300 | 0.206 | -0.467 | 0.272 | -0.294 | 0.432 | -0.410 | 0.437 | -0.262 | 0.386 | 0.298 |
| rs7246456 | 0.884 | 0.117 | -0.012 | -0.170 | -0.216 | 0.197 | -0.181 | 0.415 | -0.317 | 0.222 | -0.286 | 0.278 | 0.030 |
| rs8192719 | 0.884 | 0.117 | -0.012 | -0.170 | -0.216 | 0.197 | -0.181 | 0.415 | -0.317 | 0.222 | -0.286 | 0.278 | 0.030 |
| rs36118214 | 0.198 | 0.478 | -0.332 | 0.193 | -0.433 | 0.228 | -0.249 | 0.413 | -0.346 | 0.338 | -0.392 | 0.362 | 0.185 |
| rs33967301 | 0.007 | -0.250 | 0.246 | -0.351 | -0.013 | 0.140 | -0.106 | -0.127 | 0.210 | -0.275 | 0.079 | -0.021 | -0.247 |
| rs1552222 | 0.065 | 0.042 | 0.024 | 0.078 | 0.048 | -0.174 | 0.036 | -0.168 | 0.162 | 0.020 | 0.399 | -0.024 | 0.156 |
| 516/983 composite | 0.11 | -0.06 | -0.15 | -0.13 | 0.17 | -0.11 | 0.46 | -0.39 | 0.26 | -0.37 | 0.29 | 0.05 | |
| CYP3A5 | |||||||||||||
| rs2740574 | 0.049 | -0.066 | 0.105 | -0.079 | -0.243 | -0.049 | -0.027 | 0.039 | 0.064 | 0.443 | 0.058 | 0.272 | |
The Table only includes polymorphisms with rho < -0.3 or >0.3 for at least one nevirapine or efavirenz parameter. Rho values for all other polymorphisms were ≥ -0.3 and ≤0.3.
The r2 measure of linkage disequilibrium (LD) between each CYP2B6 polymorphism and rs3745274 (516G>T) is shown.
Spearman rank correlation coefficient assessing monotonically increasing or decreasing trend by genotype as an ordered continuous variable. The signs (+ or -) for rho value are determined by assigning numbers to each base as follows: A = 1, C = 2, G = 3, T = 4. Shaded boxes indicates rho < -0.3 or >0.3.
We similarly explored associations with pharmacokinetic parameters for efavirenz (Table 2). In these exploratory analyses, 24 CYP2B6 polymorphisms in addition to 516G>T were associated with at least one efavirenz pharmacokinetic parameter (rho > 0.3 or < -0.3), nine of which were in LD with 516G>T at R2 > 0.6 (Figure 2 and Table 2). Among the genes other than CYP2B6, only a CYP3A5 polymorphism was associated with a single efavirenz pharmacokinetic parameter (volume of distribution).
Six CYP2B6 polymorphisms were concordantly correlated with AUC0-312h and/or clearance values for both nevirapine and efavirenz (rho > 0.3 or < -0.3), 12 were correlated for efavirenz but not nevirapine, and 4 were correlated for nevirapine but not efavirenz (Table 2).
Within-Individual Relationships between Nevirapine and Efavirenz Pharmacokinetics
This study provided a unique opportunity to assess within-subject relationships between nevirapine and efavirenz pharmacokinetics. There were significant correlations between AUC0-312h values for nevirapine and efavirenz (rho=0.50, P = 0.0027), and between clearance values (rho=0.37, P = 0.0396). There were no other significant correlations between corresponding pharmacokinetic parameters (Figure 3).
Figure 3.

Intraindividual relationships between pharmacokinetic parameters. Each data point represents a different study participant. Spearman correlation coefficients (rho) and P values are shown.
Safety and Tolerability
Participants tolerated the study medications without difficulty. There were no Grade 2 or greater adverse events, and no study participant experienced rash.
Discussion
Single doses of nevirapine have been widely prescribed to pregnant women in resource-limited countries to reduce mother-to-child transmission [4]. The most important finding from the present study is that frequent, functional CYP2B6 polymorphisms (516G>T and 983T>C) did not predict substantial differences in plasma drug exposure following a single 200-mg dose of nevirapine in non-pregnant, HIV-negative volunteers. This is contrary to our expectation that CYP2B6 slow metabolizer genotypes would predict delayed nevirapine clearance and increased nevirapine exposure following a single 200-mg dose. We based this expectation on the major role of CYP2B6 in nevirapine metabolism [12,13], and on reports that CYP2B6 516G>T and 983T>C were associated with increased steady-state nevirapine exposure among HIV-infected individuals [17,21,22]. We readily showed associations between CYP2B6 516/983 genotype, delayed plasma efavirenz clearance and increase plasma efavirenz exposure following a single 600-mg dose of efavirenz. This association with efavirenz was also expected based on previous reports describing steady-state efavirenz exposure [15-19]. In the present study, the clear association between CYP2B6 516/983 genotype and efavirenz pharmacokinetic parameters suggests that substantial associations with nevirapine pharmacokinetics, if present, should have been seen in these same individuals.
There are several possible explanations for the lack of association between pharmacokinetics following single-dose nevirapine and CYP2B6 516/983 genotype. Variants other than CYP2B6 516G>T and 983T>C might better describe pharmacokinetic variability after single-dose nevirapine. In this regard, exploratory analyses involving 51 additional polymorphisms in CYP2B6, ABCB1, CYP3A4 and CYP3A5 suggested possible associations between nevirapine pharmacokinetic parameters and additional CYP2B6 polymorphisms, only one of which was in LD with CYP2B6 516G>T. However, unless replicated in other studies, these latter associations must be considered hypothesis generating, and possibly the consequence of multiple comparisons [25]. We must emphasize that additional secondary pathways for nevirapine metabolism, such as CYP3A [12,13], may minimize the impact of CYP2B6 variants, whereas efavirenz is more exclusively metabolized through CYP2B6 [14]. This is consistent with the observation that the fold increase in drug concentration associated with CYP2B6 variants at steady state in HIV-positive individuals appears to be less for nevirapine [17,21] than for efavirenz [15-19]. In addition, nevirapine metabolism undergoes considerable auto-induction [12,26]. Differences that are not apparent following a single dose may become apparent with repeated dosing.
This study has implications for the global epidemiology of HIV drug resistance. A single dose of nevirapine administered at delivery followed by a single dose of nevirapine to the newborn reduces intrapartum vertical transmission by approximately three-fold. Unfortunately, a single dose can select for drug-resistant virus which compromises the mother's response to subsequent NNRTI-containing regimens [9,10]. Intraindividual variability in plasma clearance of nevirapine in this setting will affect selective pressure for drug-resistant HIV-1. A report from Cote d'Ivoire showed that, among 63 HIV-infected women, a higher median plasma nevirapine concentration in the mother 48 hours post-partum was associated with an increased likelihood of detecting nevirapine-resistant virus in the mother at 4 weeks post-partum [27]. Delayed nevirapine clearance associated with CYP2B6 genotype would have identified a genetically-defined slow metabolizer population at increased risk for HIV-1 resistance. In addition, because CYP2B6 slow metabolizer genotypes are most frequent among individuals of African ancestry [15,16], the impact would have disproportionately affected sub-Saharan Africa. There has been controversy regarding the relative merits of single-dose nevirapine (discussed elsewhere [11]). The present study suggests that CYP2B6 516/983 genotype need not fuel this controversy. The other candidate CYP2B6 polymorphisms suggested by our exploratory analyses warrant replication testing in other cohorts. Our findings do not negate the detrimental impact of single-dose monotherapy nevirapine on viral drug resistance, but rather reinforce the need for more contemporary regimens to prevent vertical transmission.
It has been suggested that among patients with virologic control on efavirenz-containing regimens who then discontinue all drugs in the regimen, CYP2B6 516G>T will predict more prolonged drug exposure and selective pressure for drug-resistant HIV-1. The primary evidence for this, however, comes largely from modeling of steady-state, on-treatment data among individuals who did not discontinue therapy [28]. The present study provides empiric support for this concept. The relevance of associations between the additional CYP2B6 polymorphisms identified herein, only some of which are in LD with CYP2B6 516G>T, and efavirenz metabolism is uncertain. As with nevirapine, unless replicated in other studies these associations must be considered spurious [25].
There were limitations to the present study. A larger sample size would have allowed a more precise definition of associations between CYP2B6 and pharmacokinetics. In addition, we did not study pregnant individuals, for whom single-dose nevirapine is most relevant. Pregnancy can alter drug metabolism through effects on volume of distribution, gastric motility, and hepatic drug metabolism. In a previous study involving nine pregnant women who received a single 200 mg dose of nevirapine at 38 weeks gestation followed by 72-hour pharmacokinetic sampling [29], median Cmax (1,865 ng/ml) was comparable to the present study (1,682 ng/ml), whereas median oral clearance was more rapid (24.9 mL/kg/hr and 17.6 mL/kg/hr, respectively). Nevirapine exposure in our study may have been somewhat greater that among 110 post-partum Thai women studied by sparse sampling [30]. We only studied African Americans, and it is conceivable that genetic predictors of nevirapine pharmacokinetics will differ in other populations. In this regard, nevirapine elimination in the present study may have been somewhat slower than among 44 non-pregnant Dutch women (median half-life 56.7 hr, range 25.6-164.1 hr) [31]. We cannot exclude the possibility that CYP induction by nevirapine had some effect on subsequent efavirenz pharmacokinetic profiles. In addition, genetic associations identified with single doses may differ at steady-state. Because we did not correct for multiple comparisons, many (if not all) of these novel associations may be spurious. Finally, although we characterized many CYP2B6 polymorphisms, we cannot exclude an effect of additional polymorphisms in CYP2B6 and/or other genes on nevirapine metabolism.
The AIDS pandemic is an immense challenge. Improved knowledge of relationships between human genetic variants and treatment responses may ultimately improve HIV treatment strategies for individuals and populations. The present study advances our understanding of the impact of human genetic variants among individuals who receive single doses of NNRTIs.
Supplementary Material
Acknowledgments
The authors are grateful to the persons who volunteered for this study. This study was supported in part by NIH grants MH071205 (DWH, AS, TG), AI058696 (EPA), GM31304 (GRW, UM, CMS), AI54999 (DWH, MF, GRW), and RR024975 (CTSA grant from NCRR/NIH). Cara Sutcliffe and Ping Mayo of the Vanderbilt University DNA Resources Core provided technical assistance for this work.
Funding: This study was supported in part by NIH grants MH071205 (DWH, AS, TG), AI071205 (DWH), AI058696 (EPA), GM31304 (UM, CMS, GRW), AI54999 (DWH, MF, GRW), and RR024975 (Vanderbilt CTSA grant from NCRR/NIH).
Footnotes
Potential conflicts of interest: David W. Haas has received research grants from Bavarian Nordic, Boehringer-Ingelheim, Bristol-Myers Squibb, Gilead Sciences, Merck, Tanox, and Tibotec. He is on scientific advisory boards for Glaxo Smith Kline and Tibotec.
Edward P. Acosta serves as a consultant for Bristol-Myers Squibb.
Michael Floyd is on speakers' bureaus for Pfizer, Wyeth, and King Pharmaceuticals.
Gail Mayo, Usha Menon, Tebeb Gebretsadik, Ayumi Shintani, C. Michael Stein, and Grant R. Wilkinson have no possible conflicts.
Reference List
- 1.Cheeseman SH, Hattox SE, McLaughlin MM, et al. Pharmacokinetics of nevirapine: initial single-rising-dose study in humans. Antimicrob Agents Chemother. 1993;37:178–82. doi: 10.1128/aac.37.2.178. [DOI] [PMC free article] [PubMed] [Google Scholar]
- 2.Bacheler LT, Anton ED, Kudish P, et al. Human immunodeficiency virus type 1 mutations selected in patients failing efavirenz combination therapy. Antimicrob Agents Chemother. 2000;44:2475–84. doi: 10.1128/aac.44.9.2475-2484.2000. [DOI] [PMC free article] [PubMed] [Google Scholar]
- 3.Bristol-Myers Squibb Company. Sustiva (efavirenz) prescribing information. Bristol-Myers Squibb Company; Princeton, NJ: [Google Scholar]
- 4.Jackson JB, Musoke P, Fleming T, et al. Intrapartum and neonatal single-dose nevirapine compared with zidovudine for prevention of mother-to-child transmission of HIV-1 in Kampala, Uganda: 18-month follow-up of the HIVNET 012 randomised trial. Lancet. 2003;362:859–68. doi: 10.1016/S0140-6736(03)14341-3. [DOI] [PubMed] [Google Scholar]
- 5.Wain-Hobson S. The fastest genome evolution ever described: HIV variation in situ. Current Opin Genetics Devel. 1993;3:878–83. doi: 10.1016/0959-437x(93)90008-d. [DOI] [PubMed] [Google Scholar]
- 6.Eshleman SH, Guay LA, Mwatha A, et al. Characterization of nevirapine resistance mutations in women with subtype A vs. D HIV-1 6-8 weeks after single-dose nevirapine (HIVNET 012) JAIDS. 2004;35:126–30. doi: 10.1097/00126334-200402010-00004. [DOI] [PubMed] [Google Scholar]
- 7.Flys T, Nissley DV, Claasen CW, et al. Sensitive drug-resistance assays reveal long-term persistence of HIV-1 variants with the K103N nevirapine (NVP) resistance mutation in some women and infants after the administration of single-dose NVP: HIVNET 012. J Infect Dis. 2005;192:24–9. doi: 10.1086/430742. [DOI] [PubMed] [Google Scholar]
- 8.Flys TS, Chen S, Jones DC, et al. Quantitative analysis of HIV-1 variants with the K103N resistance mutation after single-dose nevirapine in women with HIV-1 subtypes A, C, and D. JAIDS. 2006;42:610–3. doi: 10.1097/01.qai.0000221686.67810.20. [DOI] [PubMed] [Google Scholar]
- 9.Jourdain G, Ngo-Giang-Huong N, Le Coeur S, et al. Intrapartum exposure to nevirapine and subsequent maternal responses to nevirapine-based antiretroviral therapy. N Engl J Med. 2004;351:229–40. doi: 10.1056/NEJMoa041305. [DOI] [PubMed] [Google Scholar]
- 10.Lockman S, Shapiro RL, Smeaton LM, et al. Response to antiretroviral therapy after a single, peripartum dose of nevirapine. N Engl J Med. 2007;356:135–47. doi: 10.1056/NEJMoa062876. [DOI] [PubMed] [Google Scholar]
- 11.McIntyre JA. Controversies in the use of nevirapine for prevention of mother-to-child transmission of HIV. Expert Opin Pharmacother. 2006;7:677–85. doi: 10.1517/14656566.7.6.677. [DOI] [PubMed] [Google Scholar]
- 12.Riska P, Lamson M, MacGregor T, et al. Disposition and biotransformation of the antiretroviral drug nevirapine in humans. Drug Metab Disposit. 1999;27:895–901. [PubMed] [Google Scholar]
- 13.Erickson DA, Mather G, Trager WF, Levy RH, Keirns JJ. Characterization of the in vitro biotransformation of the HIV-1 reverse transcriptase inhibitor nevirapine by human hepatic cytochromes P-450. Drug Metab Disposit. 1999;27:1488–95. [PubMed] [Google Scholar]
- 14.Ward BA, Gorski JC, Jones DR, Hall SD, Flockhart DA, Desta Z. The cytochrome P450 2B6 (CYP2B6) is the main catalyst of efavirenz primary and secondary metabolism: implication for HIV/AIDS therapy and utility of efavirenz as a substrate marker of CYP2B6 catalytic activity. J Pharmacol Exp Ther. 2003;306:287–300. doi: 10.1124/jpet.103.049601. [DOI] [PubMed] [Google Scholar]
- 15.Haas DW, Ribaudo HJ, Kim RB, et al. Pharmacogenetics of efavirenz and central nervous system side effects: an Adult AIDS Clinical Trials Group study. AIDS. 2004;18:2391–400. [PubMed] [Google Scholar]
- 16.Haas DW, Smeaton LM, Shafer RW, et al. Pharmacogenetics of Long-Term Responses to Antiretroviral Regimens Containing Efavirenz and/or Nelfinavir: An Adult AIDS Clinical Trials Group Study. J Infect Dis. 2005;192:1931–42. doi: 10.1086/497610. [DOI] [PubMed] [Google Scholar]
- 17.Rotger M, Colombo S, Furrer H, et al. Influence of CYP2B6 polymorphism on plasma and intracellular concentrations and toxicity of efavirenz and nevirapine in HIV-infected patients. Pharmacogenetics Genomics. 2005;15:1–5. doi: 10.1097/01213011-200501000-00001. [DOI] [PubMed] [Google Scholar]
- 18.Wang J, Sonnerborg A, Rane A, et al. Identification of a novel specific CYP2B6 allele in Africans causing impaired metabolism of the HIV drug efavirenz. Pharmacogenet Genomics. 2006;16:191–8. doi: 10.1097/01.fpc.0000189797.03845.90. [DOI] [PubMed] [Google Scholar]
- 19.Rotger M, Tegude H, Colombo S, et al. Predictive value of known and novel alleles of CYP2B6 for efavirenz plasma concentrations in HIV-infected individuals. Clin Pharmacol Ther. 2007;81:557–566. doi: 10.1038/sj.clpt.6100072. [DOI] [PubMed] [Google Scholar]
- 20.Haas DW, Ribaudo H, Motsinger A, et al. Pharmacogenetics of Plasma Drug Exposure and Treatment Outcomes with Efavirenz (EFV)-Containing Regimens: An AIDS Clinical Trials Group (ACTG) Study. Program and Abstracts of the 15th Conference on Retroviruses and Opportunistic Infections (Boston); Alexandria, VA. 2008. [Abstract L-139] Published in. [Google Scholar]
- 21.Penzak SR, Kabuye G, Mugyenyi P, et al. Cytochrome P450 2B6 (CYP2B6) G516T influences nevirapine plasma concentrations in HIV-infected patients in Uganda. HIV Med. 2007;8:86–91. doi: 10.1111/j.1468-1293.2007.00432.x. [DOI] [PubMed] [Google Scholar]
- 22.Wyen C, Hendra H, Vogel M, et al. Impact of CYP2B6 983T>C polymorphism on non-nucleoside reverse transcriptase inhibitor plasma concentrations in HIV-infected patients. J Antimicrob Chemother. 2008;61:914–8. doi: 10.1093/jac/dkn029. [DOI] [PMC free article] [PubMed] [Google Scholar]
- 23.Wigginton JE, Cutler DJ, Abecasis GR. A note on exact tests of Hardy-Weinberg equilibrium. Am J Hum Genet. 2005;76:887–93. doi: 10.1086/429864. [DOI] [PMC free article] [PubMed] [Google Scholar]
- 24.Lamba V, Lamba J, Yasuda K, et al. Hepatic CYP2B6 Expression: Gender and Ethnic Differences and Relationship to CYP2B6 Genotype and CAR Expression. J Pharmacol Exp Ther. 2003;307:906–22. doi: 10.1124/jpet.103.054866. [DOI] [PubMed] [Google Scholar]
- 25.Ioannidis JP, Ntzani EE, Trikalinos TA, Contopoulos-Ioannidis DG. Replication validity of genetic association studies. Nat Genet. 2001;29:306–9. doi: 10.1038/ng749. [DOI] [PubMed] [Google Scholar]
- 26.Cheeseman SH, Havlir D, McLaughlin MM, et al. Phase I/II evaluation of nevirapine alone and in combination with zidovudine for infection with human immunodeficiency virus. JAIDS. 1995;8:141–51. [PubMed] [Google Scholar]
- 27.Chaix ML, Ekouevi DK, Peytavin G, et al. Impact of nevirapine (NVP) plasma concentration on selection of resistant virus in mothers who received single-dose NVP to prevent perinatal human immunodeficiency virus type 1 transmission and persistence of resistant virus in their infected children. Antimicrob Agents Chemother. 2007;51:896–901. doi: 10.1128/AAC.00910-06. [DOI] [PMC free article] [PubMed] [Google Scholar]
- 28.Ribaudo HJ, Haas DW, Tierney C, et al. Pharmacogenetics of plasma efavirenz exposure after treatment discontinuation: an Adult AIDS Clinical Trials Group Study. Clin Infect Dis. 2006;42:401–7. doi: 10.1086/499364. [DOI] [PubMed] [Google Scholar]
- 29.Mirochnick M, Siminski S, Fenton T, Lugo M, Sullivan JL. Nevirapine pharmacokinetics in pregnant women and in their infants after in utero exposure. Pediatr Infect Dis J. 2001;20:803–5. doi: 10.1097/00006454-200108000-00017. [DOI] [PubMed] [Google Scholar]
- 30.Cressey TR, Jourdain G, Lallemant MJ, et al. Persistence of nevirapine exposure during the postpartum period after intrapartum single-dose nevirapine in addition to zidovudine prophylaxis for the prevention of mother-to-child transmission of HIV-1. JAIDS. 2005;38:283–88. [PubMed] [Google Scholar]
- 31.Muro E, Droste JA, Hofstede HT, Bosch M, Dolmans W, Burger DM. Nevirapine plasma concentrations are still detectable after more than 2 weeks in the majority of women receiving single-dose nevirapine: implications for intervention studies. JAIDS. 2005;39:419–21. doi: 10.1097/01.qai.0000167154.37357.f9. [DOI] [PubMed] [Google Scholar]
Associated Data
This section collects any data citations, data availability statements, or supplementary materials included in this article.