Abstract
Adenosine is generated during tissue hypoxia and stress, which reduces inflammation by suppressing the activity of most immune cells. Among its various actions, adenosine suppresses the production of proinflammatory cytokines including tumor necrosis factor (TNF)-α, through the cAMP-elevating A2A adenosine receptor (AR) subtype. In this study, we examined the signaling mechanisms by which A2AAR activation inhibits TNF-α production in thioglycollate-elicited mouse peritoneal macrophages. Pretreating murine macrophages with the nonselective AR agonist adenosine-5′-N-ethylcarboxamide (NECA), the A2AAR agonist 2-[p-(2-carboxyethyl)phenethylamino]-5′-N-ethylcarboxamidoadenosine (CGS 21680), or the cAMP-elevating agent forskolin reduced TNF-α production in response to lipopolysaccharide (LPS) by greater than 60%. All of these agents increased cAMP production in macrophages and activated protein kinase A (PKA). However, we were surprised to find that treating macrophages with three different PKA inhibitors or small interfering RNA-mediated knockdown of the exchange protein activated by cAMP (Epac-1) failed to block the suppressive actions of NECA or forskolin on LPS-induced TNF-α release. Instead, okadaic acid was effective at low concentrations that selectively inhibit protein serine/threonine phosphatases. Subsequent studies showed that NECA and forskolin decreased LPS-induced steady-state TNF-α mRNA levels; this effect was due to a decreased rate of transcription based on assays examining the rate of generation of primary TNF-α transcripts. Treatment with NECA or forskolin did not interfere with LPS-induced translocation or DNA binding of the RelA/p65 subunit of nuclear factor-κB or phosphorylation of inhibitor of nuclear factor-κB-α, extracellular signal-regulated kinase 1/2, c-Jun NH2-terminal kinase, or p38 kinase. Our results suggest that AR activation inhibits LPS-induced TNF-α production by murine macrophages at the level of gene transcription through a unique cAMP-dependent, but PKA- and Epac-independent, signaling pathway involving protein phosphatase activity.
The purine nucleoside adenosine is released from metabolically stressed or damaged tissues, which serves as a negative feedback mechanism to limit inflammation by suppressing the actions of virtually all cells of the immune system (Haskó and Cronstein, 2004; Haskó et al., 2008). Adenosine is derived from the extracellular catalysis of adenine nucleotides secreted from activated immune cells by ecto-nucleotidases and from the intracellular catalysis and subsequent cellular transport from metabolically stressed cells (Haskó and Cronstein, 2004; Haskó et al., 2008). Among its many anti-inflammatory mechanisms, adenosine potently inhibits the production of various cytokines from numerous cell types including the central proinflammatory mediator tumor necrosis factor-α (TNF-α) (Haskó and Cronstein, 2004; Haskó et al., 2008).
All of the actions of adenosine are mediated via four adenosine receptor (AR) subtypes belonging to the superfamily of G protein-coupled receptors designated A1, A2A, A2B, and A3 (Fredholm et al., 2000). We have previously determined that the Gs protein-coupled A2AAR is the primary AR subtype responsible for mediating the effects of adenosine to inhibit lipopolysaccharide (LPS)-induced TNF-α production in mouse peritoneal macrophages (Kreckler et al., 2006). However, the mechanism of this inhibitory effect remains unknown. In this study, we provide evidence that A2AAR signaling inhibits LPS-induced TNF-α release from macrophages at the level of gene transcription through a cAMP-dependent but protein kinase A (PKA)- and exchange protein activated by cAMP (Epac)-independent signaling pathway that involves increased protein phosphatase activity.
Materials and Methods
Materials.
Hybond-C nitrocellulose membranes were obtained from GE Healthcare (Little Chalfont, Buckinghamshire, UK). Ro 20-1724 was obtained from BIOMOL International LP (Plymouth Meeting, PA). All protease inhibitors, H89, rolipram, SQ 22536, Bay 11-7082, Triton X-100, and forskolin were from Sigma-Aldrich (St. Louis, MO). The PhosphoPlus CREB (Ser133) Antibody Kit was purchased from Cell Signaling Technology, Inc. (Danvers, MA). Protein kinase A inhibitor (PKI14–22) 14–22 amide, 8-bromo-cAMP, 2′,5′-dideoxyadenosine, 8-CPT-2′-O-Me-cAMP, and okadaic acid were from Calbiochem (La Jolla, CA). Anti-Epac-1 (A-5) and anti-Epac-2 (H-220) were obtained from Santa Cruz Biotechnology, Inc. (Santa Cruz, CA). Western Lightning Chemiluminescence Reagent Plus was from PerkinElmer Life and Analytical Sciences (Waltham, MA). CL-XPosure Film was from Pierce Chemical (Rockford, IL). Lipofectamine2000 Reagent and Opti-MEM were from Invitrogen (Carlsbad, CA). RPMI 1640 medium, TRIzol reagent, and ThermoScript RT-PCR kits were purchased from Invitrogen Life Technologies (Carlsbad, CA). Custom primers were ordered from Operon Biotechnologies (Huntsville, AL).
Isolation of Thioglycollate-Elicited Mouse Peritoneal Macrophages.
Macrophages were isolated from the peritoneal cavity of wild-type C57BL/6J mice, as described previously (Kreckler et al., 2006). Mice were given intraperitoneal injections of 2% sterile thioglycollate (2 ml). After 4 days, peritoneal cells collected by lavage were seeded onto 24-well plates in RPMI 1640 medium with 10% calf serum and gentamicin (50 μg/ml) for 4 h to allow the macrophages to adhere to the plates. Nonadherent cells were subsequently removed by washing with RPMI 1640 medium, and the adherent macrophages were refed with RPMI 1640 medium with 10% calf serum and gentamicin. Macrophages were used for experiments immediately after isolation.
TNF-α Release Assays.
Macrophages were stimulated with 10 μg/ml LPS for the times indicated after which the supernatant was collected for measurement of TNF-α by enzyme-linked immunosorbent assay (ELISA) (BD Biosciences, San Jose, CA). Subsequently, the cells were lysed with 0.4 N NaOH and assayed for total protein content by the Bradford assay (Bradford, 1976). TNF-α released was expressed as picograms per milligram of protein or as a percentage of the maximal TNF-α released from vehicle-treated control cells.
cAMP Assays.
Freshly isolated macrophages were detached from cell culture plates, resuspended in Dulbecco's modified Eagle's medium with 25 mM HEPES, pH 7.4, 1 unit/ml adenosine deaminase, and 20 μM Ro 20-1724, and transferred to polypropylene tubes (50,000 cells/tube). Cells were incubated with ligands for 15 min at 37°C after which the assays were terminated by the addition of 500 μl of 0.15 N HCl. cAMP in the acid extract was determined by radioimmunoassay (GE Healthcare).
Western Immunoblotting to Detect Total and Phosphorylated CREB.
Western immunoblotting was used to detect total and phosphorylated CREB using the PhosphoPlus CREB antibody kit, which contains the rabbit anti-phospho-CREB monoclonal antibody 87G3 that detects CREB and activating transcription factor-1 only when it is phosphorylated at serine-133 and the rabbit anti-CREB monoclonal antibody 48H2 that detects total CREB protein. Peritoneal macrophages were washed with ice-cold phosphate-buffered saline followed by lysis in Triton X-100 lysis buffer consisting of 50 mM Tris-HCl, pH 7.5, 100 mM NaCl, 50 mM NaF, 5 mM EDTA, 1% v/v Triton X-100, 40 mM β-glycerophosphate, 40 mM para-nitrophenylphosphate, 200 μM sodium orthovanadate, 100 μM phenylmethylsulfonyl fluoride, 1 μg/ml leupeptin, 1 μg/ml pepstatin A, and 1 μg/ml aprotinin (Gao et al., 2001). Lysates were clarified by centrifugation (5 min at 16,000g). Twenty to50 μg of protein was denatured with 5× Laemmli sample buffer (62.5 mM Tris-HCl, pH 6.8, 10% glycerol, 2% SDS, 20% β-mercaptoethanol, and 0.0025% bromphenol blue) and boiled (5 min at 95°) before separation by standard 10% SDS-polyacrylamide gel electrophoresis.
Proteins were electrophoretically transferred to nitrocellulose, which was then placed in a blocking solution of 5% dry milk in Tris-buffered saline (20 mM Tris and 150 mM NaCl, pH 7.4) with 0.1% Tween 20 (TBS-T) at room temperature for 1 h. Efficient protein transfer and equal loading was confirmed in quantitative experiments by densitometric measurement of photocopies of membranes dyed with the reversible Ponceau stain, as described previously (Ping et al., 1999). Immunoblots were not used for quantification if loading varied by more than 10%. After three 5-min washes with TBS-T, membranes were placed in a primary antibody solution appropriately diluted (1:1000) in 5% dry milk in TBS-T at 4°C overnight. Subsequently, membranes were washed three times with TBS-T and incubated with secondary antibody in 5% dry milk in TBS-T for 1 h at room temperature. Proteins were visualized with chemiluminescence followed by exposure to film. When required, blots were stripped by incubating in 62.5 mM Tris-HCl, 2% SDS, and 100 mM β-mercaptoethanol. Results were quantified using densitometry with National Institutes of Health software (Scion Corporation, Frederick, MD).
Standard RT-PCR and Western Immunoblotting to Detect Epac-1 and Epac-2 Expression in Murine Macrophages.
For RT-PCR assays, total RNA was isolated from macrophages using TRIzol reagent. Subsequently, 1 μg of macrophage RNA was reverse-transcribed to cDNA using a mixture of random and oligo(dT) primers according to the manufacturer's protocol. Primers were designed for Epac-1 (forward, 5′-GCTCTTTGAACCACACAGCA-3′; reverse, 5′-GAGGGGTTCCTCCTGGTTAG-3′) and Epac-2 (forward, 5′-GGCTGGGTCTTTGGATGTTA-3′; reverse, 5′-GAATAGGCTGACGCTTCTGG-3′) using Primer3 design software (Biology Workbench 3.2). PCR amplification was performed in a Robocycler 40 (Stratagene, La Jolla, CA) thermocycler for 30 cycles of 1 min at 95°C, 1 min at 58°C, and 1 min at 72°C. The amplification products were analyzed by agarose gel electrophoresis and visualized by ethidium bromide staining. Western immunoblotting of macrophage cell lysates was performed as described previously using anti-Epac-1 (1:1000) and anti-Epac-2 (1:750) antibodies.
Epac-1 Knockdown Using siRNA.
A predesigned siGENOME SMART pool (Dharmacon RNA Technologies, Lafayette, CO) consisting of a mixture of four siRNA sequences corresponding to mouse Epac-1 (Rapgef3) was transfected into mouse peritoneal macrophages by electroporation. In brief, 5 to 8 × 10⁵ cells were resuspended in 500 μl of RPMI 1640 medium, mixed with Epac-1 siRNA, transferred to a sterile cuvette with a 0.4-cm electrode gap, and then subjected to a single electric pulse (250 V; 500 μF capacitance) using an Electro Cell Manipulator 600 electroporater (BTX Instrument Division, Holliston, MA). The electroporated cells were transferred to complete growth media (RPMI 1640 medium with 10% calf serum and 50 μg/ml gentamicin) and plated onto 24-well cell culture plates. The cells were allowed to adhere for 4 h in a humidified 37°C incubator, after which the macrophages were washed twice with RPMI 1640 medium, and the complete medium was replaced. Preliminary studies were conducted with fluorescently labeled siRNA (siGLO; Dharmacon RNA Technologies) and a positive control siRNA (laminin A/C; Dharmacon RNA Technologies) to determine transfection efficiency (∼90%) and feasibility of protein knockdown in primary macrophages.
Real-Time RT-PCR.
RNA isolation and the reverse transcription reaction were performed as described above. Primers were designed for amplifying total TNF-α mRNA transcripts (forward, 5′-GCACCACCATCAAGGACTCA-3′; reverse, 5′-TCGGAGGCTCCAGTGAATTCG-3′) (Schroeter et al., 2003), primary unspliced TNF-α transcripts (forward, 5′-GTACTGGCATGTGTATGTCA-3′; reverse, TGGTTGAGGGAATCATT-3′) (Murray, 2005), and Epac-1 (forward, GTTGCACGAGGGAGATGACT-3′; reverse, 5′-AAGACCACTTTGCCGTGTTC-3′, created using Beacon Design software from Bio-Rad Laboratories, Hercules, CA). PCR amplification in SYBR Green SuperMix was performed using an iCycler iQ (Bio-Rad Laboratories) for 40 cycles of 25 s at 95°C followed by 45 s at an optimized annealing temperature for each specific primer pair. The cycle threshold, determined as the initial increase in fluorescence above background, was ascertained for each sample. Melt curves were performed upon completion of the cycling protocol, and the samples were assessed by gel electrophoresis to assure that nonspecific products were absent. For quantification of message, a relative change in expression was calculated using the method described by Pfaffl (2001).
RelA/p65 DNA Binding Assays.
Macrophages (2 × 10⁷) were plated onto 150-mm tissue culture dishes and serum-starved overnight before use. The next day after drug treatments for the times indicated, DNA binding activity of the RelA/p65 subunit of NF-κB in nuclear extracts (Nuclear Extraction Kit; Active Motif Inc., Carlsbad, CA) was assessed using an ELISA-based assay system (TransAM; Active Motif), whereby nuclear extracts were incubated in 96-well plates coated with oligonucleotides containing a consensus NF-κB binding sequence. After washing, an anti-RelA/p65 antibody was added, followed by incubation with horseradish peroxidase-conjugated secondary antibody, allowing for colorimetric quantification using a microplate reader (ELx800 system; BioTek Instruments, Winooski, VT).
Detection of Phosphorylated ERK1/2, JNK, p38, and IκBα.
Approximately 3 × 10⁶ macrophages were plated per 35-mm tissue culture dish and serum-starved overnight before use. The next day after drug treatments, cell lysates were prepared using the Bio-Plex Cell Lysis Kit (Bio-Rad Laboratories), as directed. Total protein content in the lysates (Bradford, 1976) was adjusted to a concentration of 900 μg/ml and stored at −20°C until the assays were performed. Phospho-ERK1/2 (Thr202/Tyr204, Thr185/Tyr187), phospho-JNK (Thr183/Tyr185), phospho-p38 mitogen-activated protein (MAP) kinase (Thr180/Tyr182), and phospho-IκB-α (Ser32/Ser36) levels were measured simultaneously in each sample using a multiplex bead array with the Bio-Plex100 System and associated software (Bio-Rad Laboratories). Data are expressed as fluorescence intensity.
Results
Activation of ARs Increases cAMP Production and Activates PKA in Mouse Peritoneal Macrophages.
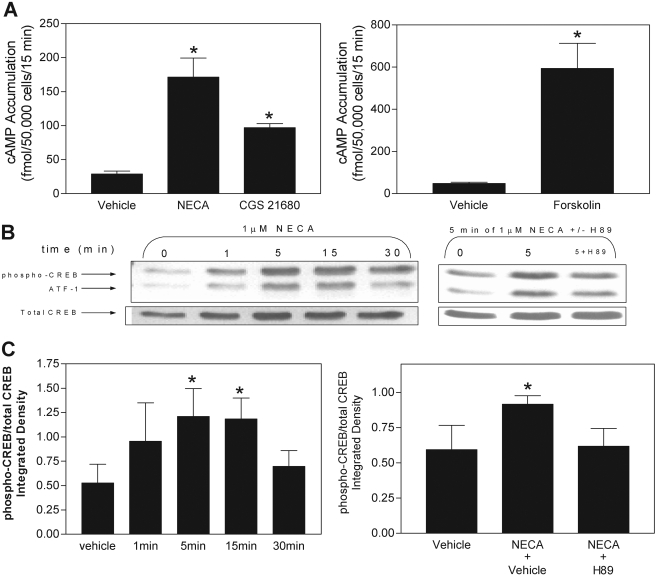
We initially examined whether activation of ARs increases cAMP production in murine macrophages. As shown in Fig. 1A, treatment with the nonselective AR agonist NECA (1 μM), the A2AAR selective agonist CGS 21680 (1 μM), or the direct adenylyl cyclase activator forskolin (50 μM) increased cAMP accumulation in macrophages from a basal level of 27.1 ± 4.8 to 171.4 ± 28.1, 97.2 ± 5.7, and 594.0 ± 119.1 fmol/50,000 cells/15 min, respectively. The increase in cAMP produced by NECA (1 μM) or CGS 21680 (1 μM; data not shown) resulted in activation of PKA as determined by phosphorylation of CREB at serine-133 (Fig. 1, B and C). NECA-induced phosphorylation of CREB was blocked by the PKA inhibitor H89 (10 μM), confirming that increased CREB phosphorylation induced by NECA was via PKA.
Fig. 1.
Effect of the nonselective AR agonist NECA, the A2AAR-selctive agonist CGS 21680, and the direct adenylyl cyclase activator forskolin on cAMP accumulation and phosphorylation of CREB in murine macrophages. A, macrophages were stimulated with either 1 μM NECA, 1 μM CGS 21680, or 50 μM forskolin in the presence of the phosphodiesterase inhibitor Ro 20-1754 (20 μM) for 15 min, and cAMP accumulation in acid extracts was determined by radioimmunoassay. B and C, macrophages were stimulated with 1 μM NECA for the times indicated either in the presence or absence of vehicle or the PKA inhibitor H89 (10 μM) before preparation of detergent-soluble extracts. Samples were equalized for protein content and were subjected to SDS-PAGE electrophoresis for immunoblotting with anti-phospho-CREB antibodies, as described under Materials and Methods. B, representative immunoblots. C, consolidated data from four independent experiments. *, p < 0.05 versus the baseline or vehicle-treated groups by one-way ANOVA or Student's t test, as appropriate. n = 3 to 5.
NECA Inhibits LPS-Induced TNF-α Release from Macrophages via a Signaling Pathway That Is PKA-Independent.
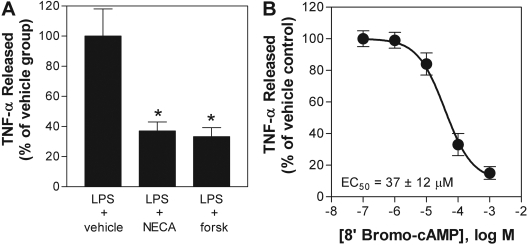
As shown previously (Kreckler et al., 2006), pretreating macrophages for 30 min with the nonselective agonist NECA (1 μM) led to a marked reduction in LPS-induced TNF-α production from murine macrophages (Fig. 2). This inhibitory effect was mimicked by treating the cells with the direct adenylyl cyclase activator forskolin (50 μM) or the cell-permeable cAMP agonist 8′-bromo-cAMP (Fig. 2). These results, combined with the observation that NECA increases cAMP production (Fig. 1), imply that activation of A2ARs inhibits TNF-α production in macrophages through a cAMP-mediated pathway.
Fig. 2.
NECA, forskolin, and 8′-bromo-cAMP inhibit LPS-induced TNF-α release from murine macrophages. Macrophages were pretreated for 30 min with vehicle, 1 μM NECA (A), 50 μM forskolin (A), or increasing concentrations of 8′-bromo-cAMP (B) before stimulation with LPS (10 μg/ml). The concentration of TNF-α was measured in cell culture media 4 h after stimulation with LPS. The data are presented as a percentage of TNF-α released compared with that for the vehicle-treated group. Absolute values for data shown in A were basal, 26 ± 7 pg/mg protein, LPS + vehicle-treated group, 13,364 ± 2405 pg/mg protein; LPS + NECA-treated group, 4944 ± 935 pg/mg protein; and LPS + forskolin (forsk)-treated group, 4450 ± 801 pg/mg protein. *, p < 0.05 versus vehicle-treated group by one-way ANOVA. n = 6 to 10.
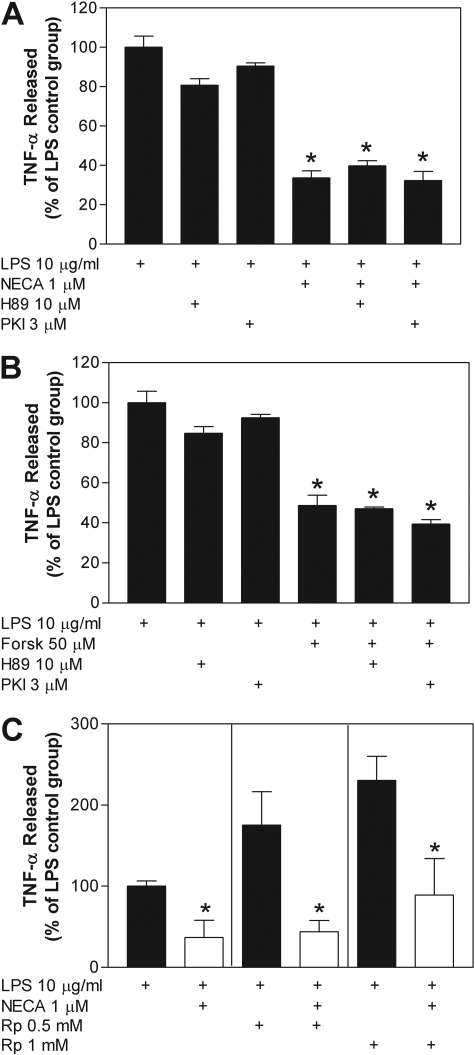
We subsequently examined whether the inhibitory effects of NECA are due to activation of PKA. For these studies, we examined the ability of the PKA inhibitors H89 and myristolylated PKI14–22 peptide to abrogate the ability of NECA and forskolin to inhibit TNF-α production. H89, which inhibits the catalytic site of PKA by blocking the ATP binding site, was used at a concentration of 10 μM as shown in Fig. 1 to inhibit PKA-induced phosphorylation of CREB and PKI14–22 was used at a concentration of 3 μM (Ydrenius et al., 2000; Skeberdis et al., 2006). PKI14–22 is a myristolylated 8-amino acid fragment of the PKA inhibitor protein that exclusively blocks the catalytic activity of PKA. PKI14–22 is routinely used in vitro at concentrations as low as 0.3 μM (Skeberdis et al., 2006) and up to 3 to 10 μM (Ydrenius et al., 2000). As shown in Fig. 3, pretreating cells with either of the PKA inhibitors did not block the ability of NECA or forskolin to inhibit LPS-induced TNF-α release. It is noteworthy that neither H89 nor PKI14–22 affected LPS-induced TNF-α release when given alone. Similar negative results were obtained using Rp-8-Br-cAMPS (0.5–1 mM), a PKA blocker that functions by antagonizing binding of cAMP to the regulatory subunit of PKA (Fig. 3). Although treatment with Rp-8-Br-cAMPS tended to increase LPS-induced TNF-α release, NECA continued to produce a robust inhibitory effect similar in magnitude (∼60–70%) to that produced in control experiments (Fig. 3).
Fig. 3.
Pharmacological blockade of PKA does not inhibit the ability of NECA or forskolin to inhibit LPS-induced TNF-α release from macrophages. Macrophages were pretreated for 30 min with 1 μM NECA (A and C) or 50 μM forskolin (B) before stimulation with LPS (10 μg/ml) in the presence or absence of H89 (10 μM) (A and B), PKI14–22 (PKI; 3 μM) (A and B), or Rp-8-Br-cAMPS (Rp; 0.5 or 1 mM) (C). Cells were pretreated with the antagonists 1 h before additional of LPS. The concentration of TNF-α was measured in cell culture media 4 h after stimulation with LPS. The data are presented as a percentage of TNF-α released compared with the LPS-stimulated control group. *, p < 0.05 versus vehicle-treated group by one-way ANOVA or Student's t test, as appropriate. n = 6 to 10.
NECA Inhibits LPS-Induced TNF-α Release from Macrophages via a Signaling Pathway That Is Also Epac-Independent.
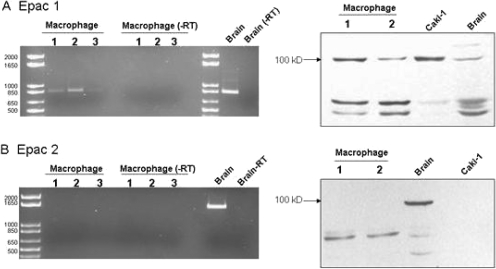
PKA has long been thought to be the primary effector of cAMP in eukaryotic cells. However, Epac has recently been discovered to also function as a target for cAMP (de Rooij et al., 1998; Bos, 2006; Roscioni et al., 2008). Epac is a guanine nucleotide exchange protein for the small GTPases Rap1 and Rap2 and has been shown to control a number of cellular processes previously attributed to PKA. Two isoforms of Epac have been identified and designated Epac-1 and Epac-2. Epac-1 is considered to be ubiquitously expressed, whereas Epac-2 has been identified in brain and pancreatic β-cells where it may be involved in insulin secretion (de Rooij et al., 1998; Bos, 2006; Roscioni et al., 2008). Considering that we found no role for PKA signaling in our studies, we shifted focus to the potential involvement of Epac. Initially, we assessed the presence of Epac-1 and -2 in mouse peritoneal macrophages by Western immunoblotting and RT-PCR. As demonstrated in Fig. 4, only Epac-1 was expressed in these cells.
Fig. 4.
Detection of Epac-1 (A), but not Epac-2 (B), in murine macrophages by RT-PCR (left) and Western immunoblotting (right). RT-PCR reactions conducted with and without reverse transcriptase (−RT) were electrophoresed through 1% agarose gels containing ethidium bromide. Reactions were performed with total RNA isolated from three different macrophage isolations (lanes 1–3) and with mouse brain tissue as a positive control. Expected band sizes were 868 base pairs for Epac-1 and 1742 for Epac-2. Western blot analysis was performed with protein lysates from macrophages (lanes 1 and 2) and from mouse brain and Caki-1 cells as positive controls. Epac-1 and Epac-2 migrate as ∼110-kilobase proteins.
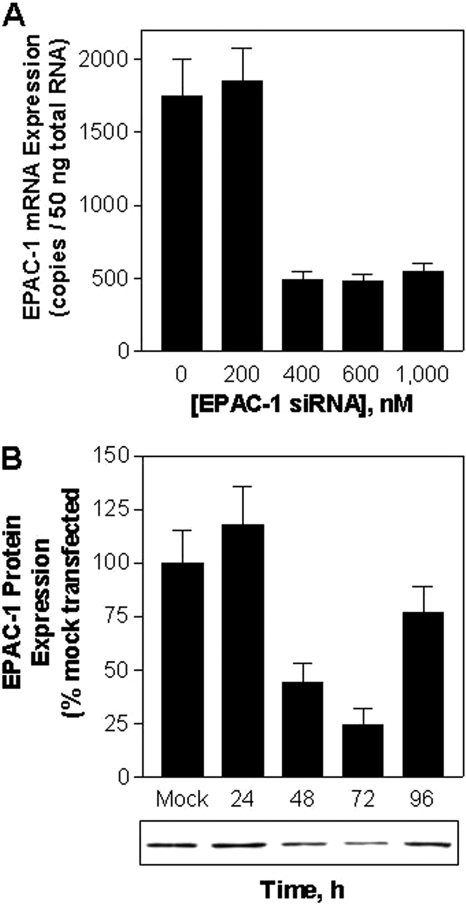
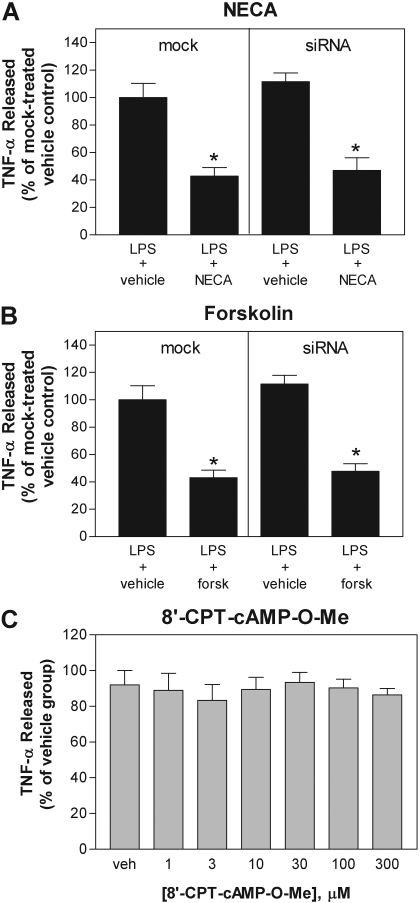
Because no pharmacological antagonists of Epac are currently available, we next investigated whether knockdown of Epac-1 expression in macrophages using siRNA technology reduces the ability of NECA or forskolin to inhibit LPS-induced TNF-α release. In preliminary studies, we established by Western immunoblotting and real-time RT-PCR that expression of Epac-1 was optimally reduced by ∼75% 72 h after electroporation with 400 nM anti-Epac-1 siRNA (Fig. 5). As shown, both NECA (1 μM) and forskolin (50 μM) continued to efficiently inhibit LPS-induced TNF-α production in cells transfected with Epac-1 siRNA compared with mock-transfected cells (Fig. 6, A and B). Extensive knockdown of Epac-1 (69 ± 5%) was confirmed by Western blotting of cell lysates for Epac-1 in parallel studies. siRNA knockdown of Epac-1 also did not interfere with the ability of the A2AAR agonist CGS 21680 (100 nM) to inhibit LPS-induced TNF-α production (data not shown).
Fig. 5.
Optimization of Epac-1 knockdown with anti-Epac-1 siRNA in murine macrophages. A, measurement of Epac-1 mRNA by RT-PCR normalized to 18S 48 h after electroporation with increasing concentrations of anti-Epac-1 siRNA. n = 3. B, measurement of Epac-1 protein expression by Western immunoblotting at the times indicated after electroporation with 400 nM anti-Epac-1 siRNA. n = 3.
Fig. 6.
Epac-1 is not involved in mediating the inhibitory actions of NECA or forskolin on LPS-induced TNF-α release. A and B, treatments with NECA and forskolin (forsk) continue to inhibit LPS-induced TNF-α release from macrophages after siRNA-mediated knockdown of Epac-1. C, treatment with the Epac agonist 8′-CPT-cAMP-O-Me failed to inhibit LPS-induced TNF-α release. For the siRNA studies, macrophages subjected 72 h earlier to transfection with 400 nM anti-Epac-1 siRNA (siRNA) or mock transfection were pretreated with NECA (1 μM) or forskolin (50 μM) 30 min before stimulation with LPS (10 μg/ml). For studies with the Epac agonist, macrophages were pretreated for 30 min with increasing concentrations of 8′-CPT-cAMP-O-Me before simulation with LPS (10 μg/ml). In all studies, the concentration of TNF-α was measured in cell culture media 4 h after stimulation with LPS. The data are presented as a percentage of TNF-α released compared with that for the LPS-stimulated control group. *, p < 0.05 versus vehicle-treated group by Student's t test. n = 4 to 6.
To further test a potential signaling role for Epac, we examined the ability of the Epac-selective agonist 8′-CPT-cAMP-O-Me to inhibit LPS-induced TNF-α release from macrophages. 8′-CPT-cAMP-O-Me is a nonhydrolyzable cAMP analog that activates Epac with greater potency than PKA (Enserink et al., 2002). Previous studies have shown that concentrations of 8′-CPT-cAMP-O-Me as low as 1–10 μM effectively activate Epac in studies using cultured cells (Enserink et al., 2002). In our experiments, we found that pretreating macrophages with up to 300 μM 8′-CPT-cAMP-O-Me failed to appreciably inhibit LPS-induced TNF-α production (Fig. 6C). These results coupled with the negative results obtained in the siRNA knockdown experiments strongly indicate that Epac signaling, like that of PKA, is not involved in mediating the inhibition of LPS-induced TNF-α release provided by either AR stimulation or direct cAMP elevation.
Suppression of TNF-α Release by NECA Is Blocked by Okadaic Acid.
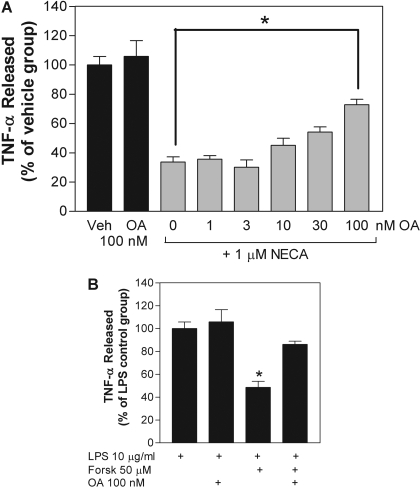
We next investigated the potential involvement of protein phosphatases using the serine/threonine protein phosphatase inhibitor okadaic acid. As demonstrated in Fig. 7A, okadaic acid concentration dependently antagonized the inhibitory effect of NECA on LPS-induced TNF-α release, becoming evident at a concentration of 10 nM. Okadaic acid (100 nM) also antagonized the inhibitory effect of forskolin on LPS-induced TNF-α release (Fig. 7B).
Fig. 7.
Okadaic acid inhibits the ability of NECA and forskolin to inhibit LPS-induced TNF-α release from macrophages. Macrophages were pretreated for 30 min with either vehicle (Veh), NECA (1 μM) (A), or forskolin (Forsk; 50 μM) (B) in the presence or absence of okadaic acid (OA) at the concentrations indicated. The concentration of TNF-α was measured in cell culture media 4 h after stimulation with LPS. The data are presented as a percentage of TNF-α released compared with that for the LPS-stimulated control group. *, p < 0.05 versus control group by one-way ANOVA. n = 6 to 14.
NECA Inhibits LPS-Induced TNF-α Gene Transcription.
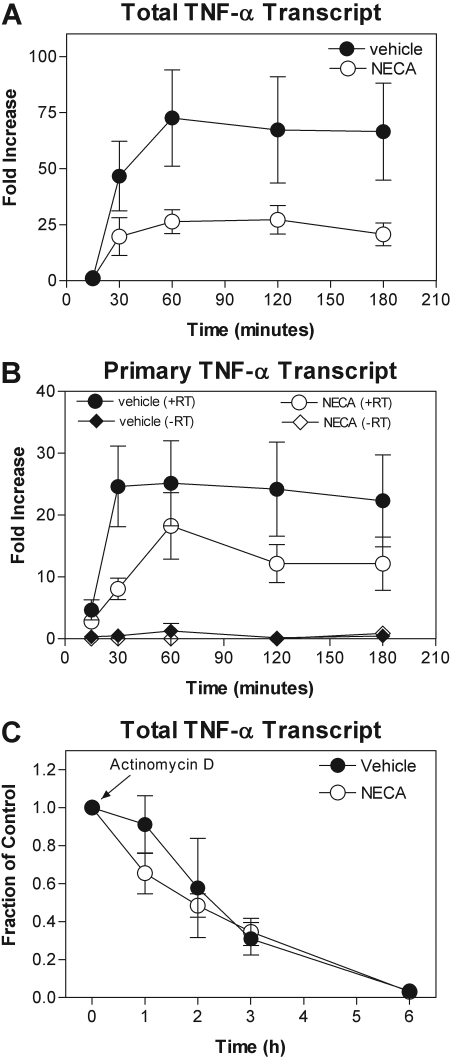
Stimulation of Toll-like receptors by LPS activates NF-κB and MAP kinase signaling pathways via complex upstream signaling events, which coordinate the increase in TNF-α gene transcription via nuclear translocation and DNA binding of the transcription factor NF-κB (Krishnan et al., 2007). Activation of MAP kinases, particularly p38 kinase, further increases proinflammatory gene expression through post-transcriptional mechanisms that promote RNA stability by destabilizing AU-rich elements in the 3′ untranslated region (Dean et al., 2004; Fotheringham et al., 2004b; Krishnan et al., 2007). We therefore examined whether AR activation in macrophages inhibits LPS-induced transcription of the TNF-α gene and/or decreases mRNA stability. To begin, we used real-time PCR with primers designed to detect changes in steady-state levels of total TNF-α mRNA (i.e., primary, partially spliced, and fully processed transcripts) using primers directed to a translated region of the gene. As shown in Fig. 8A, treatment with LPS (10 μg/ml) increased steady-state total TNF-α mRNA levels as early as 30 min after LPS stimulation, peaking at ∼75-fold above baseline after 1 h and persisting for at least 3 h. Pretreatment with NECA (1 μM) inhibited the LPS-induced increase in steady-state TNF-α mRNA by greater than 50% (Fig. 7A), indicating that AR activation either inhibits generation of new transcript (i.e., gene transcription) or increases the rate of decay of TNF-α mRNA (i.e., RNA stability). To examine the first possibility (i.e., transcription), we used an approach recently described by Murray (2005) in which the rate of formation of newly transcribed unspliced or partially spliced TNF-α transcripts is estimated by real-time PCR with primers directed to an intronic region. The second possibility (RNA stability) was tested by measuring the rate of decay of total TNF-α mRNA after pharmacological blockade of transcription. For this assay, macrophages pretreated with vehicle or NECA (1 μM) were activated by LPS to induce gene expression (30 min), and then total TNF-α mRNA was measured by real-time PCR at various times after treatment with actinomycin D (5 μg/ml). As shown, NECA markedly reduced the rate of formation of primary TNF-α transcripts (Fig. 8B) but did not alter the rate of decay of total TNF-α mRNA (Fig. 8C). These results therefore indicate that AR activation inhibits LPS-induced TNF-α gene transcription in macrophages but does not alter TNF-α mRNA stability. Likewise, forskolin inhibited the LPS-induced increase in both total and primary TNF-α transcripts by 59 ± 17 and 68 ± 7%, respectively, without altering TNF-α mRNA stability (data not shown).
Fig. 8.
Treatment with NECA inhibits LPS-induced TNF-α gene transcription in murine macrophages but does not alter TNF-α mRNA stability. A and B, murine macrophages were pretreated with vehicle or 1 μM NECA before stimulation with LPS (10 μg/ml), after which the production of total (A) and primary unspliced (B) TNF-α mRNA was measured by quantitative RT-PCR, as described under Materials and Methods. Treatment with NECA inhibits LPS-induced formation of total and primary TNF-α transcripts, indicating an effect on the rate of transcription. C, macrophages were pretreated with vehicle or NECA (1 μM) for 30 min before stimulating with LPS (10 μg/ml). The rate of decay of mature TNF-α transcripts was determined after the addition of actinomycin D (5 μg/ml). Treatment with NECA does not alter TNF-α mRNA stability. n = 6 to 8.
NECA Does Not Alter LPS-Induced Activation of NF-κB or MAP Kinases.
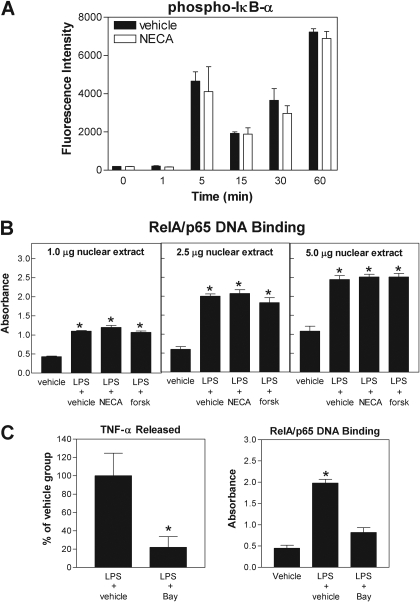
We finally examined whether AR activation influences phosphorylation of the inhibitory subunit of NF-κB (IκB-α) and DNA binding of the RelA/p65 subunit of NF-κB. Phosphorylation of IκB-α in cell lysates was assessed using the Bio-Plex system, and RelA/p65 DNA binding activity was assessed in nuclear extracts using a sensitive ELISA-based assay. Stimulation with LPS induced a rapid increase in the phosphorylated form of IκB-α as well as a rapid increase in RelA/p65 DNA binding in nuclear extracts (Fig. 9, A and B), demonstrating that LPS treatment activates NF-κB signaling. However, pretreating cells with either NECA (1 μM) or forskolin (50 μM) had no effect on either of these parameters (Fig. 9, A and B). LPS-induced production of TNF-α by macrophages was confirmed to be dependent on NF-κB signaling, based on the observation that treatment with the inhibitor Bay 11-7082 inhibited the production of TNF-α by macrophages as well as DNA binding of RelA/p65 in nuclear extracts (Fig. 9C). Using the Bio-Plex assay, we also found that phosphorylation of p38, JNK, and ERK1/2 was increased with LPS (10 μg/ml) stimulation, but that pretreatment with NECA (1 μM) had no inhibitory effect on any of these molecules (Fig. 10). Thus, although AR activation inhibits TNF-α gene transcription, it functions by a mechanism that is independent of general activation (nuclear translocation and DNA binding) of NF-κB or MAP kinase signaling.
Fig. 9.
Treatment with NECA or forskolin does not inhibit LPS-induced IκB-α phosphorylation or RelA/p65 DNA binding. A and B, macrophages were pretreated with NECA (1 μM) or forskolin (forsk; 50 μM) before stimulation with LPS (10 μg/ml). IκB-α phosphorylation (Ser32/Ser36) was determined in cell lysates at the times indicated using the Bio-Plex system and RelA/p65 DNA binding to nuclear extracts (1–5 μg) was determined 1 h after stimulation with LPS by ELISA, as described under Materials and Methods. Control experiments are shown in C, where it is shown that blockade of NF-κB with BAY 11-7082 (Bay; 10 μM) inhibits LPS-induced TNF-α release from macrophages as well as RelA/p65 DNA binding. *, p < 0.05 versus control group by one-way ANOVA. n = 4 to 6.
Fig. 10.
Treatment with NECA does not inhibit LPS-induced activation of Erk1/2, p38, or JNK. Macrophages were pretreated with NECA (1 μM) for 30 min before stimulation with LPS (10 μg/ml). Protein phosphorylation was determined in cell lysates collected at the times indicated using the Bio-Plex assay. n = 4 to 6.
Discussion
It is generally believed that A2AAR activation inhibits the expression of TNF-α and other proinflammatory mediators by elevating the intracellular concentration of cAMP, which subsequently inhibits NF-κB activity and thereby gene transcription through a signaling mechanism involving PKA (Neumann et al., 1995; Bshesh et al., 2002; Sitkovsky, 2003; Lukashev et al., 2004). This scenario correlates with the well known suppressive actions of cAMP elevation and PKA activation in immune cells. However, in the present investigation, we found that the inhibitory actions of A2AAR activation on LPS-induced TNF-α expression in murine macrophages is independent of PKA activity as well as the alternative cAMP effector protein Epac and does not involve general inhibition (nuclear translocation and DNA binding) of NF-κB. Rather, we identified a unique signaling pathway that seems to involve activation of a serine/threonine protein phosphatase sensitive to blockade by okadaic acid that results in inhibition of TNF-α production at the level of gene transcription.
In our studies of the A2AAR, we obtained similar results directly elevating the intracellular concentration of cAMP using the adenylyl cyclase activator forskolin. We found that treatment with forskolin effectively inhibited LPS-induced TNF-α production, which was not blocked by PKA inhibitors or by knocking down Epac. Moreover, the inhibition of TNF-α gene transcription was similar with forskolin and A2AAR activation. These results provide strong evidence that the suppressive effects of A2AAR activation required elevation of cAMP and not the involvement of cAMP-independent signaling mechanisms. In an attempt to further confirm this conclusion, we conducted additional experiments designed to determine whether inhibition of cAMP production using two different adenylyl cyclase inhibitors (SQ 22536 and MDL-12,330A) inhibited A2AAR-mediated inhibition of TNF-α release. It is unfortunate that both of these agents were toxic to primary murine macrophages at the concentrations (100–500 μM) required to effectively inhibit the enzyme (data not shown).
Our conclusion that A2AAR signaling functions independently of PKA is based on the use of three different pharmacological inhibitors: H89, PKI14–22, and Rp-8-Br-cAMPS. Each of these compounds inhibits PKA activity by binding to different sites on the enzyme complex. Although the selectivity of H89 for PKA is moderate, it is well established as an effective inhibitor of PKA at the concentrations used in the present investigation (10 μM). Moreover, we demonstrated that treatment with H89 effectively inhibited CREB phosphorylation in response to A2AAR activation. Negative results obtained in assays using Rp-8-Br-cAMPS excluded the possibility that the mechanism involves signaling via the regulatory subunits of PKA independent of actions of the catalytic subunits.
Epac emerged as a potential mediator in our studies because we found that Epac-1 is abundantly expressed in murine macrophages. Moreover, Scheibner et al. (2009) have suggested that the A2AAR signals through Epac in murine macrophages to inhibit TNF-α expression induced by extracellular matrix components. However, our results show that the A2AAR also does not signal to inhibit LPS-induced TNF-α release via Epac based on 1) lack of an effect of siRNA-mediated knockdown of Epac-1 and 2) lack of an inhibitory action of the Epac agonist 8-CPT-2′-O-Me-cAMP even at concentrations as high as 300 μM. Previous studies have shown that 8-CPT-2′-O-Me-cAMP selectively activates Epac at concentrations between 1 and 10 μM (Enserink et al., 2002) and potentially as low as 1 nM (Scheibner et al., 2009). We attempted to confirm that 8-CPT-2′-O-Me-cAMP was able to activate Epac in our studies by measuring Rap1 activation using a pulldown assay (Enserink et al., 2002; Lorenowicz et al., 2006). This approach was not possible with the limited number of peritoneal macrophages that we were able to obtain from adult mice. As an alternative approach, we determined that exposure to 8-CPT-2′-O-Me-cAMP induced CREB phosphorylation at a concentration of 1 mM (data not shown). Considering that 8-CPT-2′-O-Me-cAMP is much more potent at activating Epac than PKA is (Enserink et al., 2002), this observation provides strong evidence that 8-CPT-2′-O-Me-cAMP was able to penetrate into macrophages and effectively activate Epac within the concentration range (1–300 μM) examined in our investigation.
Two previous studies have implicated phosphatase activation in mediating suppressive signaling by the A2AAR in immune cells. In human monocytes, Fotherington et al. (2004a) reported that okadaic acid inhibited TNF-α production in response to the human immunodeficiency virus-1 protein tat. In human neutrophils, Revan et al. (1996) reported that the protein phosphatase inhibitor calyculin A blocked the suppressive effect of A2AAR activation on stimulated superoxide production. In both of these studies (Revan et al., 1996; Fotheringham et al., 2004a), the inhibitory actions of A2AAR activation were independent of signaling through PKA. We therefore examined the effectiveness of okadaic acid in our model system. Similar to these previous studies, we found that okadaic acid effectively inhibited the suppressive actions of A2AAR activation at concentrations between 10 and 100 nM. Because okadaic acid inhibits protein serine/threonine phosphatase PP2A at subnanomolar concentrations (0.1–1 nM) and PP1 at 10- to 100-fold higher concentrations (Peirce et al., 1999), our results suggest involvement of PP1. Our results also imply that activation of the A2AAR increased protein phosphatase activity due to cAMP elevation, because treating macrophages with okadaic acid also inhibited the ability of forskolin to inhibit LPS-induced TNF-α release.
Several previous studies have shown that stimulating the A2AAR inhibits activation of NF-κB, albeit by various different mechanisms. Activation of the A2AAR was originally reported by Majumbar and Aggarwal (2003) to inhibit TNF-α-induced DNA binding and transcriptional activation of NF-κB in several different myeloid, lymphoid, and epithelial cell lines but not to alter its ability to translocate into the nucleus. In contrast, Sands et al. (2004) demonstrated that A2AAR activation inhibited nuclear translocation induced by a combination of interferon-γ, LPS, and TNF-α in both human umbilical vein endothelial cells and C6 glioma cells. In C6 cells, A2AAR activation inhibited IκB-α-induced phosphorylation, whereas in human umbilical vein endothelial cells A2AAR activation inhibited NF-κB translocation independently of any effect on IκB-α phosphorylation/degradation (Sands et al., 2004). Others have reported variable effects of A2AAR activation on NF-κB activity, depending on the cell type and the stimulating agent (Bshesh et al., 2002; Németh et al., 2003; Lukashev et al., 2004; Minguet et al., 2005). Indeed, in the original study by Majumbar and Aggarwal (2003), A2AAR activation had no inhibitory effect on NF-κB activity when LPS was used as the activating agent rather than TNF-α. Considering that the A2AAR appears to signal by alternative mechanisms in murine macrophages, we examined whether stimulation of the A2AAR inhibits activation of NF-κB in our assays. We initially confirmed that A2AAR activation functions to inhibit TNF-α gene transcription in macrophages using the novel approach to measure the rate of production of primary unspliced TNF-α mRNA (Murray, 2005) and ruled out potential effects on mRNA stability. We subsequently assessed the effect of A2AAR activation on NF-κB activation using an enzyme-linked immunosorbent-based assay to measure DNA binding activity of RelA/p65 in nuclear extracts. This assay is comparable to an electromobility “′supershift” assay for RelA/p65 DNA binding but with much greater sensitivity. We found that activation of the A2AAR had no effect on LPS-induced DNA binding in nuclear extracts, and, by inference, on nuclear translocation of RelA/p65. We also found in our Bio-Plex assay that activation of the A2AAR does not interfere with LPS-induced phosphorylation of IκB-α, further supporting a lack of an effect on nuclear translocation. Thus, stimulation of the A2AAR in murine macrophages does not interfere with TNF-α gene transcription in response to LPS by general inhibition of NF-κB, i.e., nuclear translocation and DNA binding.
A lack of an effect on NF-κB is difficult to explain, because A2AAR activation inhibits the expression of multiple different NF-κB regulated genes in macrophages in addition to TNF-α (Németh et al., 2003). Thus, A2AAR activation is likely to inhibit NF-κB regulated genes in macrophages through indirect mechanisms. One possibility is that the A2AAR signals to interfere with chromatin remodeling that allows access of transcriptional machinery to NF-κB-driven genes, perhaps by recruiting histone deacetylases (Ashburner et al., 2001; Ghosh and Karin, 2002). Alternatively, A2AAR signaling may ultimately inhibit transcriptional activity of NF-κB without interfering with nuclear translocation and DNA binding. Upon nuclear translocation, RalA/p65 is phosphorylated at several different residues (Ser276, Ser311, Ser529, and Ser536, among others), which is required for maximal transcriptional activity (Chen and Greene, 2004). Thus, A2AAR activation may inhibit phosphorylation of RelA/p65, potentially through activation of a protein phosphatase. Finally, A2AAR activation may interfere with the assembly of accessory proteins necessary for NF-κB-mediated transcription, such as CREB-binding protein and/or p300 (Jang et al., 2004; Ma et al., 2005; Granja et al., 2006). Notably, we were not able to determine whether activation of the A2AAR inhibited transcriptional activity of NF-κB because nonproliferating primary murine macrophages are not amenable to reporter gene assays.
In conclusion, this study demonstrates that the A2AAR inhibits LPS-induced TNF-α release in murine macrophages through a unique signaling mechanism involving cAMP elevation that is PKA- and Epac-independent, but seems to involve activation of a protein phosphatase and inhibition of gene transcription. The results of our studies highlight the fact that adenosine and A2AAR activation inhibits inflammatory cell functions by complex signaling mechanisms that vary among different cell types.
This work was supported in part by the National Institutes of Health National Heart, Lung, and Blood Institute [Grants R01-HL60051, R01-HL077707]; and by the American Heart Association [Grant 0315274Z].
Article, publication date, and citation information can be found at http://jpet.aspetjournals.org.
doi:10.1124/jpet.109.157651
- TNF-α
- tumor necrosis factor-α
- AR
- adenosine receptor
- LPS
- lipopolysaccharide
- PKA
- protein kinase A
- Epac
- exchange protein activated by cAMP
- Ro 20-1724
- 4-[(3-butoxy-4-methoxyphenyl)-methyl]-2-imidazolidinone
- SQ 22536
- 9-(tetrahydro-2-furanyl)-9H-purin-6-amine
- H89
- N-[2-(4-bromocinnamylamino)ethyl]-5-isoquinoline
- Bay 11-7082
- (E)-3-(4-methylphenylsulfonyl)-2-propenetrile
- CREB
- cAMP response element-binding protein
- PKI14–22
- PKA14–22 inhibitory peptide
- 8-CPT-2′-O-Me-cAMP
- 8-chlorophenylthio-2′-O-methyladenosine-cAMP
- RT
- reverse transcription
- PCR
- polymerase chain reaction
- ELISA
- enzyme-linked immunosorbent assay
- siRNA
- small interfering RNA
- NF-κB
- nuclear factor κB
- ERK
- extracellular signal-regulated kinase
- JNK
- c-Jun N-terminal kinase
- IκB
- inhibitor of nuclear factor-κB
- MAP
- mitogen-activated protein
- ANOVA
- analysis of variance
- NECA
- adenosine-5′-N-ethylcarboxamide
- CGS 21680
- 2-[p-(2-carboxyethyl)phenethylamino]-5′-N-ethylcarboxamidoadenosine
- Rp-9-Br-cAMPS
- (Rp)8-bromoadenosine cyclic 3′:5′-monophosphorothioate
- MDL-12,330A
- cis-N-[2-phenylcyclopentyl]-azacyclotridec-1-en-2-amine.
References
- Ashburner BP, Westerheide SD, Baldwin AS., Jr (2001) The p65 (RelA) subunit of NF-κB interacts with the histone deacetylase (HDAC) corepressors HDAC1 and HDAC2 to negatively regulate gene expression. Mol Cell Biol 21:7065–7077 [DOI] [PMC free article] [PubMed] [Google Scholar]
- Bos JL. (2006) Epac proteins: multi-purpose cAMP targets. Trends Biochem Sci 31:680–686 [DOI] [PubMed] [Google Scholar]
- Bradford MM. (1976) A rapid and sensitive method for the quantitation of microgram quantities of protein utilizing the principle of protein-dye binding. Anal Biochem 72:248–254 [DOI] [PubMed] [Google Scholar]
- Bshesh K, Zhao B, Spight D, Biaggioni I, Feokistov I, Denenberg A, Wong HR, Shanley TP. (2002) The A2A receptor mediates an endogenous regulatory pathway of cytokine expression in THP-1 cells. J Leukoc Biol 72:1027–1036 [PubMed] [Google Scholar]
- Chen LF, Greene WC. (2004) Shaping the nuclear action of NF-κB. Nat Rev Mol Cell Biol 5:392–401 [DOI] [PubMed] [Google Scholar]
- de Rooij J, Zwartkruis FJ, Verheijen MH, Cool RH, Nijman SM, Wittinghofer A, Bos JL. (1998) Epac is a Rap1 guanine-nucleotide-exchange factor directly activated by cyclic AMP. Nature 396:474–477 [DOI] [PubMed] [Google Scholar]
- Dean JL, Sully G, Clark AR, Saklatvala J. (2004) The involvement of AU-rich element-binding proteins in p38 mitogen-activated protein kinase pathway-mediated mRNA stabilisation. Cell Signal 16:1113–1121 [DOI] [PubMed] [Google Scholar]
- Enserink JM, Christensen AE, de Rooij J, van Triest M, Schwede F, Genieser HG, Døskeland SO, Blank JL, Bos JL. (2002) A novel Epac-specific cAMP analogue demonstrates independent regulation of Rap1 and ERK. Nat Cell Biol 4:901–906 [DOI] [PubMed] [Google Scholar]
- Fotheringham J, Mayne M, Holden C, Nath A, Geiger JD. (2004a) Adenosine receptors control HIV-1 Tat-induced inflammatory responses through protein phosphatase. Virology 327:186–195 [DOI] [PubMed] [Google Scholar]
- Fotheringham JA, Mayne MB, Grant JA, Geiger JD. (2004b) Activation of adenosine receptors inhibits tumor necrosis factor-α release by decreasing TNF-α mRNA stability and p38 activity. Eur J Pharmacol 497:87–95 [DOI] [PubMed] [Google Scholar]
- Fredholm BB, Arslan G, Halldner L, Kull B, Schulte G, Wasserman W. (2000) Structure and function of adenosine receptors and their genes. Naunyn Schmiedebergs Arch Pharmacol 362:364–374 [DOI] [PubMed] [Google Scholar]
- Gao Z, Li BS, Day YJ, Linden J. (2001) A3 adenosine receptor activation triggers phosphorylation of protein kinase B and protects rat basophilic leukemia 2H3 mast cells from apoptosis. Mol Pharmacol 59:76–82 [DOI] [PubMed] [Google Scholar]
- Ghosh S, Karin M. (2002) Missing pieces in the NF-κB puzzle. Cell 109 ( Suppl): S81–S96 [DOI] [PubMed] [Google Scholar]
- Granja AG, Nogal ML, Hurtado C, Del Aguila C, Carrascosa AL, Salas ML, Fresno M, Revilla Y. (2006) The viral protein A238L inhibits TNF-α expression through a CBP/p300 transcriptional coactivators pathway. J Immunol 176:451–462 [DOI] [PubMed] [Google Scholar]
- Haskó G, Cronstein BN. (2004) Adenosine: an endogenous regulator of innate immunity. Trends Immunol 25:33–39 [DOI] [PubMed] [Google Scholar]
- Haskó G, Linden J, Cronstein B, Pacher P. (2008) Adenosine receptors: therapeutic aspects for inflammatory and immune diseases. Nat Rev Drug Discov 7:759–770 [DOI] [PMC free article] [PubMed] [Google Scholar]
- Jang HD, Yoon K, Shin YJ, Kim J, Lee SY. (2004) PIAS3 suppresses NF-κB-mediated transcription by interacting with the p65/RelA subunit. J Biol Chem 279:24873–24880 [DOI] [PubMed] [Google Scholar]
- Kreckler LM, Wan TC, Ge ZD, Auchampach JA. (2006) Adenosine inhibits tumor necrosis factor-α release from mouse peritoneal macrophages via A2A and A2B but not the A3 adenosine receptor. J Pharmacol Exp Ther 317:172–180 [DOI] [PubMed] [Google Scholar]
- Krishnan J, Selvarajoo K, Tsuchiya M, Lee G, Choi S. (2007) Toll-like receptor signal transduction. Exp Mol Med 39:421–438 [DOI] [PubMed] [Google Scholar]
- Lorenowicz MJ, van Gils J, de Boer M, Hordijk PL, Fernandez-Borja M. (2006) Epac1-Rap1 signaling regulates monocyte adhesion and chemotaxis. J Leukoc Biol 80:1542–1552 [DOI] [PubMed] [Google Scholar]
- Lukashev D, Ohta A, Apasov S, Chen JF, Sitkovsky M. (2004) Cutting edge: Physiologic attenuation of proinflammatory transcription by the Gs protein-coupled A2A adenosine receptor in vivo. J Immunol 173:21–24 [DOI] [PubMed] [Google Scholar]
- Ma Z, Chang MJ, Shah RC, Benveniste EN. (2005) Interferon-γ-activated STAT-1α suppresses MMP-9 gene transcription by sequestration of the coactivators CBP/p300. J Leukoc Biol 78:515–523 [DOI] [PubMed] [Google Scholar]
- Majumdar S, Aggarwal BB. (2003) Adenosine suppresses activation of nuclear factor-κB selectively induced by tumor necrosis factor in different cell types. Oncogene 22:1206–1218 [DOI] [PubMed] [Google Scholar]
- Minguet S, Huber M, Rosenkranz L, Schamel WW, Reth M, Brummer T. (2005) Adenosine and cAMP are potent inhibitors of the NF-κB pathway downstream of immunoreceptors. Eur J Immunol 35:31–41 [DOI] [PubMed] [Google Scholar]
- Murray PJ. (2005) The primary mechanism of the IL-10-regulated antiinflammatory response is to selectively inhibit transcription. Proc Natl Acad Sci U S A 102:8686–8691 [DOI] [PMC free article] [PubMed] [Google Scholar]
- Németh ZH, Leibovich SJ, Deitch EA, Vizi ES, Szabó C, Hasko G. (2003) cDNA microarray analysis reveals a nuclear factor-κB-independent regulation of macrophage function by adenosine. J Pharmacol Exp Ther 306:1042–1049 [DOI] [PubMed] [Google Scholar]
- Neumann M, Grieshammer T, Chuvpilo S, Kneitz B, Lohoff M, Schimpl A, Franza BR, Jr, Serfling E. (1995) RelA/p65 is a molecular target for the immunosuppressive action of protein kinase A. EMBO J 14:1991–2004 [DOI] [PMC free article] [PubMed] [Google Scholar]
- Peirce MJ, Munday MR, Peachell PT. (1999) Role of protein phosphatases in the regulation of human mast cell and basophil function. Am J Physiol 277:C1021–C1028 [DOI] [PubMed] [Google Scholar]
- Pfaffl MW. (2001) A new mathematical model for relative quantification in real-time RT-PCR. Nucleic Acids Res 29:e45. [DOI] [PMC free article] [PubMed] [Google Scholar]
- Ping P, Zhang J, Cao X, Li RC, Kong D, Tang XL, Qiu Y, Manchikalapudi S, Auchampach JA, Black RG, et al. ( 1999) PKC-dependent activation of p44/p42 MAPKs during myocardial ischemia-reperfusion in conscious rabbits. Am J Physiol 276:H1468–H1481 [DOI] [PubMed] [Google Scholar]
- Revan S, Montesinos MC, Naime D, Landau S, Cronstein BN. (1996) Adenosine A2 receptor occupancy regulates stimulated neutrophil function via activation of a serine/threonine protein phosphatase. J Biol Chem 271:17114–17118 [DOI] [PubMed] [Google Scholar]
- Roscioni SS, Elzinga CR, Schmidt M. (2008) Epac: effectors and biological functions. Naunyn Schmiedebergs Arch Pharmacol 377:345–357 [DOI] [PubMed] [Google Scholar]
- Sands WA, Martin AF, Strong EW, Palmer TM. (2004) Specific inhibition of nuclear factor-κB-dependent inflammatory responses by cell type-specific mechanisms upon A2A adenosine receptor gene transfer. Mol Pharmacol 66:1147–1159 [DOI] [PubMed] [Google Scholar]
- Scheibner KA, Boodoo S, Collins S, Black KE, Chan-Li Y, Zarek P, Powell JD, Horton MR. (2009) The adenosine A2a receptor inhibits matrix-induced inflammation in a novel fashion. Am J Respir Cell Mol Biol 40:251–259 [DOI] [PMC free article] [PubMed] [Google Scholar]
- Schroeter M, Küry P, Jander S. (2003) Inflammatory gene expression in focal cortical brain ischemia: differences between rats and mice. Brain Res Mol Brain Res 117:1–7 [DOI] [PubMed] [Google Scholar]
- Sitkovsky MV. (2003) Use of the A2A adenosine receptor as a physiological immunosuppressor and to engineer inflammation in vivo. Biochem Pharmacol 65:493–501 [DOI] [PubMed] [Google Scholar]
- Skeberdis VA, Chevaleyre V, Lau CG, Goldberg JH, Pettit DL, Suadicani SO, Lin Y, Bennett MV, Yuste R, Castillo PE, et al. ( 2006) Protein kinase A regulates calcium permeability of NMDA receptors. Nat Neurosci 9:501–510 [DOI] [PubMed] [Google Scholar]
- Ydrenius L, Majeed M, Rasmusson BJ, Stendahl O, Särndahl E. (2000) Activation of cAMP-dependent protein kinase is necessary for actin rearrangements in human neutrophils during phagocytosis. J Leukoc Biol 67:520–528 [DOI] [PubMed] [Google Scholar]


