Abstract
Study Design
Longitudinal radiographic study of patients with progressive idiopathic scoliosis.
Objective
To determine the relative contributions of vertebral and disc wedging to the increase in Cobb angle during 3 phases of adolescent skeletal growth and maturation.
Summary of Background Data
Both disc wedging and vertebral body wedging are found in progressive scoliosis, but their relative contribution to curve progression over time is unknown. Which occurs first is important for understanding how scoliosis progresses and for developing methods to halt progression. Previous studies have not properly identified maturity and provide conflicting results.
Methods
Eighteen girls were followed through their adolescent growth spurt with serial spine and hand skeletal age radiographs. Each Cobb angle was divided into disc wedge angles and vertebral wedge angles. The corresponding hand radiographs provided a measure of maturity level, the Digital Skeletal Age (DSA). The disc versus bone contributions to the Cobb angle were then compared during 3 growth phases: prior to the growth spurt, during the growth spurt and after the growth spurt. Significance of relative changes was assessed with the Wilcoxon two-sided mean rank test.
Results
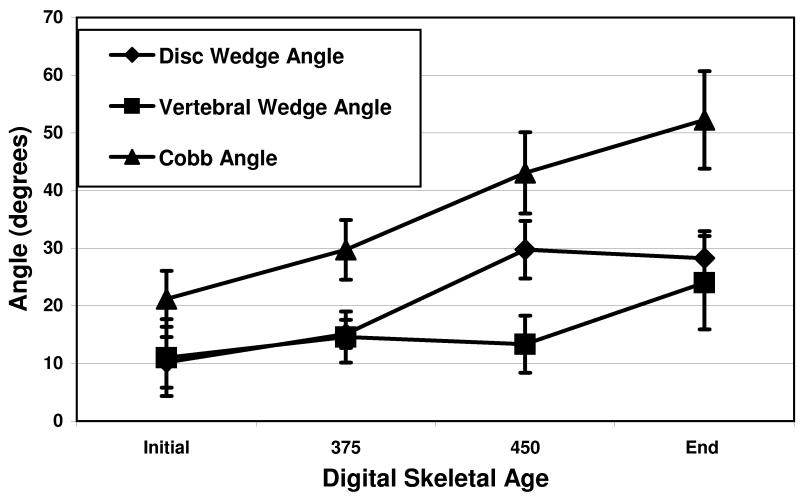
Prior to the growth spurt, there was no difference in relative contributions of the disc and the bone (3° vs 0°, p=0.38) to curve progression. During the growth spurt, the mean disc component progressed significantly more than that of the vertebrae (15° vs 0°, p=0.0002). This reversed following the growth spurt with the vertebral component progressing more than the disc (10° vs 0°, p=0.01).
Conclusion
Adolescent idiopathic scoliosis initially increases through disc wedging during the rapid growth spurt with progressive vertebral wedging occurring later.
INTRODUCTION
Scoliosis progression during the adolescent growth spurt is poorly understood. Various investigators have attempted to identify the specific etiology of curve progression, but the results have been inconclusive. Part of this is because reliable comparison of patients at the same stage of curve progression has been impossible. The high correlation of the digital skeletal age (DSA) with the curve acceleration phase (CAP) in adolescent idiopathic scoliosis provides an opportunity to make appropriate comparisons between patients.1 Although both discs and vertebrae deform in progressive scoliosis, the relative contribution of each to Cobb angle progression has not been demonstrated. It is thought that both the discs and vertebrae become increasingly wedged as a result of asymmetrical loading and asymmetrical growth.2,3
In this study patients with adolescent idiopathic scoliosis (AIS) at a similar maturity level were compared during their adolescent growth spurt to identify whether the Cobb angle progresses through the vertebra or through the intervertebral disc. Changes primarily in the vertebra, measured as vertebral wedging, imply that growth inhibition on the concavity of the curve is the primary cause for scoliosis progression. Changes primarily in the disc, measured as disc wedging, imply that an unknown process in the soft tissue is the primary cause for scoliosis progression. The aim of this study was to determine whether the contributions of disc and vertebral wedging to the progression of scoliosis differed prior to, during and after the growth spurt.
MATERIALS AND METHODS
This study population was the same as that in the study of Sanders, et al1 in which a cohort of 22 girls with AIS was followed through their growth spurt with serial PA spine radiographs, serial skeletal age radiographs, and a number of clinical and biochemical markers of maturation obtained every six months. Patients were braced according to accepted criteria and instructed to wear the brace 23 hours per day. Bracing was initiated for curves with a Cobb angle of 25 degrees or more or a Cobb angle of 20-24 degrees with documented 5 degrees progression in patients with a Risser sign of 2 or less. The curve type for each patient was classified according to a modified Lenke classification.4 (Table 1) Of the original cohort, 18 subjects had sufficient progression to warrant inclusion in this current study. Only curves with more than ten degrees of progression were included.
Table 1.
Distribution of Type of Scoliosis Curves (Lenke4 classification)
| Type 1 | Type 2 | Type 3 | Type 4 | Type 5 | Type 6 | |
|---|---|---|---|---|---|---|
| Number | 6 | 2 | 4 | 1 | 4 | 1 |
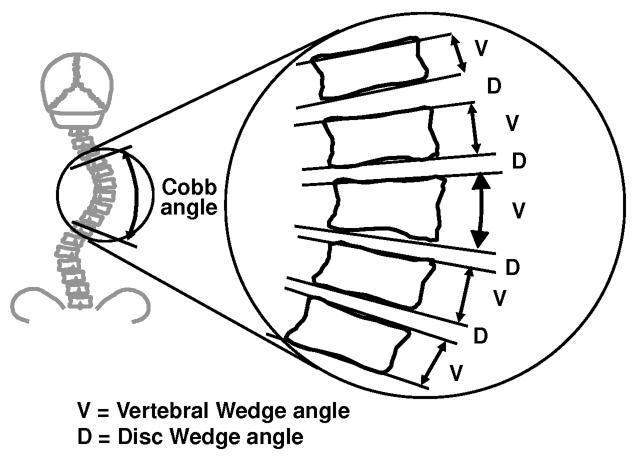
Each spine radiograph was digitized and saved as a digital image file. An operator used custom software5 to record the positions of two points on each of the superior and inferior vertebral endplates of each vertebral body from T1 to L5 for each spine radiograph. The relative inclinations of lines passing through these points provided a measurement of the vertebral wedge angle and disc wedge angle for each level (Figure 1). The reliability of the measurement technique was evaluated by examining data from a previous study6 of inter- and intra-observer reliability, using the same computer-assisted radiographic measurement. The tilt angles of the vertebral endplates were measure with a mean overall standard deviation of 1.6 degrees (values ranged from 1.45 to 1.9 degrees for 4 observers). The inter-observer variability of the Cobb angles (angle between maximally tilted endplates) was 1.6 degrees. The total Cobb angle for a major curve was the sum of the disc wedge angles and vertebral wedge angles for the levels of that curve. For each patient the total Cobb angle, total disc wedge angle and total vertebral wedge angle were graphed against the digital skeletal age (DSA).1 The time axis of these graphs was divided into three phases corresponding to the three main stages of growth: pre-curve acceleration phase, curve acceleration phase (CAP), and post-curve acceleration phase. Four DSA measurements were selected to define the 3 phases of growth: less than 375, 375, 450 and greater than 450. DSA less than 375 was considered the pre-curve acceleration phase. DSA from 375 to 450 was considered the curve acceleration phase (CAP). DSA greater than 450 was considered the post-curve acceleration phase.1 The values of disc and vertebral wedge angles were averaged for each maturity point and compared to each other.
Statistical analysis by two sample, two sided Wilcoxon rank-sum test was used to compare the changes on the relative amount of disc and vertebral wedging between each of the 4 maturity points. All statistical analyses were done by using the R programming language (R Foundation for Statistical Computing, Vienna, Austria).
RESULTS
An average of 8.1 +/− 2.5 spine radiographs was obtained per patient. The average initial Cobb angle was 25.6 +/− 10.7 degrees (range 11.6-46.5) and the average final Cobb angle was 53.3 +/− 16.1 degrees (range 28.4 – 82.3). The average curve progression was 27.7 degrees (range 11.1 – 61.9). The initial average age was 10.8 +/− 1.4 years and the average final age was 14.5 +/− 0.8 years. Average follow-up time was 3.7 +/− 1.3 years.
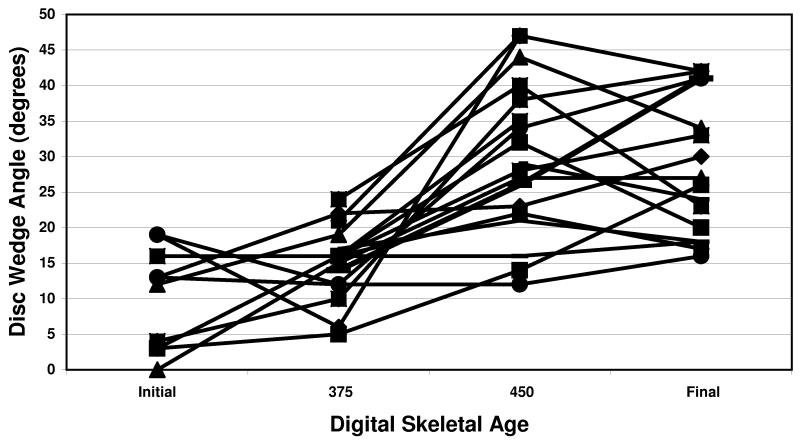
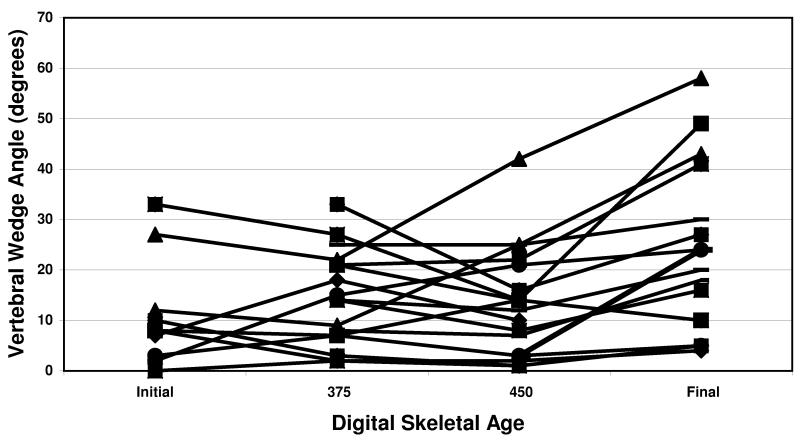
The results of disc wedging and vertebral wedging compared to DSA for all patients are shown in figures 2 and 3, respectively. For disc wedge angles, the average change pre-CAP (before DSA 375) was 3 degrees. CAP average change (from DSA 375 to 450) was 15 degrees. Post-CAP (after DSA 450) average change was 0 degrees. For the vertebral wedge angles, the average change pre-CAP was 0 degrees. CAP average change was 0 degrees. Post-CAP average change was 10 degrees. The difference in disc and vertebral wedging contributions to curve progression were significant during CAP (p=0.0002) and after CAP (p=0.01). p-values in parentheses were obtained from Wilcoxon rank-sum test comparing the two subgroups.
Disc wedge angle increases were greatest during the rapid curve progression in the CAP, while vertebral wedge angle increased primarily after the CAP. This pattern of early curve progression through the disc, and later curve progression occurring in the vertebra is evident in the percent of Cobb angle values for the cohort of patients, as shown in Figure 2. Figure 4 is the graphic representation of the significant differences between disc and vertebral wedging during the 3 maturity phases.
DISCUSSION
In this population of patients with progressive AIS, it was found that spinal deformity begins with changes in the intervertebral discs during the most rapid phase of growth. Vertebral changes occured after the discs have deformed and growth decreases. Thus the anatomic location where Cobb angle progression occurred differed by maturity level. It changed from a process occurring primarily located at the intervertebral disc prior to and during the growth spurt to a process occurring primarily at the vertebral bodies after the growth spurt.
This study focused on the development of wedging deformity by means of a longitudinal study design with a cohort of patients with progressive scoliosis. Most prior studies of vertebral and disc wedging has been cross sectional and has not been able to stratify by maturity appropriately. In prior radiographic studies, Perdriolle3 reported that there was a greater proportion of disc wedging in smaller curves than in larger curves, and Xiong et al.7 reported that both structures were wedged in curve less than 30 degrees. Repeated radiographic measurements patients with progressive scoliosis by Stokes and Aronsson8 indicated that the relative contributions of the discs and vertebrae were unchanged. However in that study maturity markers were not used to identify when or if the subject was in the rapid growth phase that usually accompanies curve progression. Grivas et al.9 measured radiographs of 70 patients with scoliosis in a cross-sectional study. Similar to our findings, vertebral wedging was found to increase after the Cobb angle increased. Importantly, the disc wedge angle was the radiographic parameter most closely associated with curve progression, again consistent with our findings. However, only the apex and the levels immediately above and below the apex were measured, and maturity markers were not used. In MRI studies, increasing scoliosis has been associated with displacement of the nucleus pulposus towards the convex side.10,11
It has been suggested that the while idiopathic scoliosis is probably initiated by unknown extra-spinal factors,12 the progression of the deformity, once it reaches a certain magnitude, occurs primarily through the action of asymmetrical forces on growing bone and soft issue.2 If this is true, then the mechanism by which curve progression occurs in the vertebrae and discs appears to be substantially different. This is consistent with the different mechanisms of growth and remodeling that occur in bone and soft tissue. Most successful non-human models of scoliosis progression have created a tether, which spontaneously produces the disc changes. These studies have then concentrated on the bone deformity, emphasizing the Heuter-Volkman effect. In the present study the Cobb angle for the major curve was divided into its vertebral and disc components with results implying that the bony changes are secondary and that initial progression occurs through the soft tissues as reflected by early changes in disc wedging.
A separate model of scoliosis progression is based on anterior bone overgrowth compared to the posterior column as proposed by Roaf13 and Somerville14. In a study supporting this mechanism, Guo et al14 found the anterior column substantially longer than the posterior column on a cross-sectional study compared to non-scoliotic controls. They proposed that the primary mechanism of scoliosis progression is an uncoupling of the anterior enchondral ossification from the posterior element growth. However, their study did not control for maturity, and a posterior lateral tether could create the same bony finding by later growth inhibition on the posterior concavity.
The strengths of this present study include its longitudinal design, measurement of vertebral and disc wedge angles for the entire major curve and measuring progression of Cobb angles in scoliosis as it relates to maturity. Its limitations include the relatively small sample size and analysis limited to the two dimensions of the coronal deformity using plain radiographs. Since the patients were treated with braces during curve progression, the finding of this study may not accurately reflect the natural history of untreated scoliosis. However, the current standard of treatment is to brace the patients studied in this study.
The findings of the present study may help to explain the mechanism of scoliosis progression during skeletal growth. The longitudinal growth in the vertebrae occurs almost exclusively from the vertebral endplates.16 Soft tissue grows in apposition, probably in response to tension but there is very little increase in height of intervertebral discs during adolescent growth.17 The finding of intervertebral disc deformation occurring first, followed later by asymmetrical vertebral growth, suggests that the disc tissue on the convex side may be placed under relative tension, thus stimulating its growth or remodeling, especially in the early stages of curve progression. Soft tissues on the convexity then grow at a relatively more rapid rate than the concavity crating a functional concave tether. Since these soft tissues in the thoracic spine are primarily posterior, this accounts for the typical thoracic lordoscoliosis.
Our study demonstrates that the intervertebral disc is the primary anatomic site of rapid Cobb angle progression during the early growth spurt in patients with adolescent idiopathic scoliosis. After the growth spurt the vertebral body is the primary anatomic site of Cobb angle progression in patients with adolescent idiopathic scoliosis. This implies that treatments designed to correct vertebral deformity, such as staples or tethers, may not be acting in the appropriate phase of growth for maximum effectiveness.
Key Points.
Progression of scoliosis as measured by the Cobb angle does not distinguish between the contributions of disc and vertebral wedging.
Using digital skeletal age as a measure of skeletal maturity, the wedging of intervertebral discs made the largest contribution to the scoliosis progression in the interval just prior to and during the curve acceleration phase, while vertebral wedging was the predominant source of curve progression thereafter.
This study implies that the source of early rapid scoliosis progression is the surrounding tissues rather than concave vertebral endplate growth inhibition.
Mini-Abstract.
Disc and vertebral wedging are found in progressive scoliosis, but their contribution to curve progression is unknown. The contribution of the disc and vertebrae to Cobb angle progression was assessed while controlling for maturity. During the growth spurt curves progressed through disc wedging, which was followed by vertebral wedging.
Table 2.
Average disc wedge angle and vertebral wedge angle as a percent of Cobb angle at 4 points of DSA . Note the large change in the disc wedge angle contribution from DSA 375 to 450, which is also the CAP. Significant vertebral changes occur after DSA of 450 only.
| Digital Skeletal Age |
Cobb Angle Percentage |
Disc Wedge Angle (Percent of Cobb Angle) |
Vertebra Wedge Angle (Percent of Cobb Angle) |
|---|---|---|---|
| Pre 375 | 100 | 51.9 | 48.1 |
| 375 | 100 | 54.1 | 45.9 |
| 450 | 100 | 71.2 | 28.8 |
| Post 450 | 100 | 57.6 | 42.4 |
Acknowledgements
IAFS supported by NIH R01AR 053132 JOS supported by a grant from the Scoliosis Research Society IRB review and approval obtained
REFERENCES
- 1.Sanders JO, Browne RH, McConnell SJ, et al. Maturity assessment and curve progression in girls with idiopathic scoliosis. J Bone Joint Surg Am. 2007;89(1):64–73. doi: 10.2106/JBJS.F.00067. [DOI] [PubMed] [Google Scholar]
- 2.Roaf R. Vertebral growth and its mechanical control. J Bone Joint Surg Br. 1960;42:40–59. doi: 10.1302/0301-620X.42B1.40. [DOI] [PubMed] [Google Scholar]
- 3.Perdriolle R. La scoliose: Son étude tridimensionnelle. Maloine SA; Paris: 1979. [Google Scholar]
- 4.Lenke LG, Betz RR, Harms J, et al. Adolescent idiopathic scoliosis: A new classification to determine extent of spinal arthrodesis. J Bone Joint Surg Am. 2001;83-A:1169–1181. [PubMed] [Google Scholar]
- 5.Stokes IAF, Aronsson DD. Identifying sources of variability in scoliosis classification using a rule-based automated algorithm. Spine. 2002;27(24):2801–2805. doi: 10.1097/00007632-200212150-00014. [DOI] [PubMed] [Google Scholar]
- 6.Stokes IAF, Aronsson DD. Computer-assisted algorithms improve reliability of King classification and Cobb angle measurement of scoliosis. Spine. 2006;31(6):665–670. doi: 10.1097/01.brs.0000203708.49972.ab. [DOI] [PubMed] [Google Scholar]
- 7.Xiong B, Sevastik JA, Hedlund R, et al. Radiographic changes at the coronal plane in early scoliosis. Spine. 1994;19(2):159–64. doi: 10.1097/00007632-199401001-00008. [DOI] [PubMed] [Google Scholar]
- 8.Stokes IAF, Aronsson DD. Disc and vertebral wedging in patients with progressive scoliosis. J Spinal Disorders. 2001;14(4):317–322. doi: 10.1097/00002517-200108000-00006. [DOI] [PubMed] [Google Scholar]
- 9.Grivas TB, Vasiliadis E, Malakasis M, et al. Intervertebral disc biomechanics in the pathogenesis of idiopathic scoliosis. Stud Health Technol Inform. 2006;123:80–83. [PubMed] [Google Scholar]
- 10.Toyama Y. An experimental study on the pathology and role of intervertebral discs in the progression and correction of scoliotic deformity. Nippon Seikeigeka Gakkai Zasshi. 1988;62(8):777–89. [PubMed] [Google Scholar]
- 11.Perie D, Curnier D, de Gauzy JS. Correlation between nucleus zone migration within scoliotic intervertebral discs and mechanical properties distribution within scoliotic vertebrae. Magn Reson Imaging. 2003;21(9):949–53. doi: 10.1016/s0730-725x(03)00216-9. [DOI] [PubMed] [Google Scholar]
- 12.Enneking WF, Harrington PR. Pathological changes in scoliosis. J Bone Joint Surg Am. 1969;51-A:165–175. [PubMed] [Google Scholar]
- 13.Roaf R. The basic anatomy of scoliosis. J Bone Joint Surg Br. 1966;48B:786–92. [PubMed] [Google Scholar]
- 14.Somerville EW. Rotational lordosis: the development of the single curve. J Bone Joint Surg Br. 1952;34B:421–7. doi: 10.1302/0301-620X.34B3.421. [DOI] [PubMed] [Google Scholar]
- 15.Guo X, Chau W-W, Chan Y-L, et al. Relative anterior spinal overgrowth in adolescent idiopathic scoliosis: Results of disproportionate enchondral membranous bone growth. J Bone Joint Surg Br. 2003;85B(7):1026–1031. doi: 10.1302/0301-620x.85b7.14046. [DOI] [PubMed] [Google Scholar]
- 16.Dickson RA, Deacon P. Spinal growth. J Bone Joint Surg Br. 1987;69(5):690–2. doi: 10.1302/0301-620X.69B5.3680325. [DOI] [PubMed] [Google Scholar]
- 17.Stokes IAF, Windisch L. Vertebral height growth predominates over intervertebral disc height growth in the adolescent spine. Spine. 2006;31(14):1600–4. doi: 10.1097/01.brs.0000222008.15750.1f. [DOI] [PMC free article] [PubMed] [Google Scholar]


