

Abstract
Rationale
Abnormal tryptophan metabolism catalyzed by indoleamine 2,3-dioxygenase (IDO) may play a prominent role in tumor immuno-resistance in many tumor types, including lung tumors. The goal of this study was to evaluate in vivo kinetics of [11C]methyl-L-tryptophan (AMT), a positron emission tomography (PET) tracer for tryptophan metabolism, in human lung tumors.
Methods
Using dynamic PET/CT scanning with AMT, tracer transport and metabolic rates were evaluated in 18 lesions of 10 patients. The kinetic values were compared between tumors and unaffected lung tissue, tested against a simplified analytic approach requiring no arterial blood sampling, and correlated with standard uptake values (SUVs) obtained from 2-deoxy-2-[18F]fluoro-D-gluose (FDG) PET/CT scans.
Results
Most non-small cell lung cancers (NSCLCs) showed prolonged retention of AMT but three other lesions (two benign lesions and a rectal cancer metastasis) and unaffected lung tissue showed no such retention. Transport and metabolic rates of AMT were substantially higher in NSCLCs than in the other tumors and unaffected lung tissue. A simplified analytic approach provided an excellent estimate of transport rates but only suboptimal approximation of tryptophan metabolic rates. FDG SUVs showed a positive correlation with AMT uptake, suggesting higher tryptophan transport and metabolism in tumors with higher proliferation rates.
Conclusions
Prolonged retention of AMT in NSCLCs suggests high metabolic rates of tryptophan in these tumors. AMT PET/CT may be a clinically useful molecular imaging method for personalized cancer treatment by identifying and monitoring patients who have increased tumor tryptophan metabolism and are potentially sensitive to immuno-pharmacotherapy with IDO inhibitors.
Keywords: lung tumors, positron emission tomography, tryptophan, metabolism, 2-deoxy-2-[18F]fluoro-D-glucose
INTRODUCTION
Tryptophan is an essential amino acid required for biosynthesis of proteins, serotonin and melatonin in the brain and other tissues (1). In mammals, however, most of the tryptophan derived from the diet is metabolized via the kynurenine pathway (2). Abnormal tryptophan oxidation along this pathway is an important mechanism for modulation of tumor cell proliferation and immuno-resistance, mainly via the initial and rate-limiting step catalyzed by indoleamine 2,3-dioxygenase (IDO) (3,4). Induction of IDO leads to local tryptophan depletion thus inhibiting cell growth in some malignant tumors (5,6). On the other hand, enhanced IDO activity in tumors may also exert a potent immunosuppressive effect by blocking T-lymphocyte proliferation, thus diminishing T cell mediated tumor rejection (3,4,7). Thus, manipulation of tryptophan metabolism via the kynurenine pathway may have important implications in tumor pharmacotherapy. However, it is not always clear whether IDO activity should be enhanced or inhibited to suppress tumor growth in specific tumors.
Recent studies have consistently shown high expression of IDO in a variety of human tumors, including lung tumors (3, 8–14). Several of these studies demonstrated that high expression of IDO was associated with reduced survival (9–11, 14). In vivo detection of abnormal tryptophan transport and metabolism via the kynurenine pathway could be an important tool to identify patients amenable to immunotherapy targeting tryptophan metabolism in tumors and to monitor therapeutic effects. The positron emission tomography (PET) radiotracer [11C]methyl-L-tryptophan (AMT) is well suited for such studies since AMT is not a substrate for protein synthesis (15) but can be metabolized by IDO due to the low substrate specificity of this enzyme (16). Our previous studies detected high concentration of quinolinic acid, a metabolite of the kynurenine pathway, in resected tubers showing increased AMT uptake on PET in children with tuberous sclerosis (17). In our recent studies of brain tumors, increased AMT uptake associated with expression of IDO was found in human gliomas and glio-neuronal tumors on PET (12,18).
The purpose of the present study was to explore the clinical use of AMT PET in extra-cerebral tumors. We selected thoracic tumors for this pilot study for three main reasons: 1. Lung tumors express IDO (9, 13). 2. Dynamic AMT PET imaging of such tumors can conveniently include the heart in the field of view, thus allowing us to obtain arterial blood input function from the left ventricle of the heart for a full kinetic analysis. 3. Lung tissue shows low background for AMT transport and metabolism. The overall goal of this study was to establish the feasibility of AMT PET imaging for detecting altered tryptophan metabolism in extracerebral (primary and metastatic thoracic) tumors. Specific goals of the study were: 1. To explore if AMT PET detects increased transport and/or metabolic rate in lung tumors, as compared to unaffected lung tissue, and if different tumor types show different AMT transport/metabolic rates. 2. To determine whether estimation of AMT transport and metabolic rates could be achieved without arterial blood sampling, using a simplified graphical approach (19). 3. To determine the relationship between AMT kinetic values and 2-deoxy-2-[18F]fluoro-D-glucose (FDG) uptake values in tumors from patients who underwent both FDG and AMT PET scans.
MATERIALS AND METHODS
Subjects
Ten patients (6 men, mean age: 55 years, see Table 1) with a diagnosis of a lung or mediastinal tumor underwent AMT PET/CT scanning. The tumors were diagnosed by a clinical CT scan and surgical histology. Eight patients also underwent a clinical FDG PET/CT scan in our center. Of the 10 patients, 8 had a recent diagnosis of a lung or mediastinal tumor, while two had an earlier diagnosis of lung cancer, but showed progression after chemoradiotherapy (performed at least 6 months before the AMT PET/CT). Tumor histology showed non-small cell lung cancer (NSCLC) in seven, a metastatic adenocarcinoma (from a colorectal cancer) in one and a benign lesion (hamartoma, thymic cyst) in two. Five patients with NSCLC had multiple tumors. AMT and FDG PET scans were done within 1 month (6–31 days; mean: 18 days) in all 7 cases with a malignant tumor and within 9 weeks in the patient (#2) with the benign lung lesion. The study was approved by the Human Investigation Committee at Wayne State University, and a written informed consent was obtained from each participant before the AMT PET/CT scan.
Table 1.
Clinical data, histology diagnosis and 2-deoxy-2-[18F]fluoro-D-glucose (FDG) as well as [11C]methyl-L-tryptophan (AMT) PET standard uptake values measured in each lesion of the 10 patients
| No. | Sex/Age (yrs) | Diagnosis | Previous therapy (before AMT) | Time between FDG/AMT PET | Lesion number | SUV FDG | SUV AMT |
|---|---|---|---|---|---|---|---|
| #1 | F/54 | Thymic cyst | none | FDG PET not done | 1 | - | 0.5 |
| #2 | M/39 | Hamartoma | none | 54days (FDG later) | 1 | 0.9 | 0.7 |
| #3 | M/66 | Metastasis (rectal cancer) | none | 11days | 1 | 2.8 | 1.3 |
| #4 | M/58 | NSCLC [scc] | Chemoth. (2weeks)* | 1 month | 1 | 15.7 | 2.5 |
| #5 | F/58 | NSCLC [pd] | Radio+Chemotherapy (> 6 months)** | 1 month | 1 | 8.0 | 5.5 |
| 2 | 6.8 | 4.4 | |||||
| #6 | F/56 | NSCLC [lcc] | Radio+Chemoth (> 6months)** | 7 days | 1 | 5.5 | 2.4 |
| 2 | 2.8 | 2.7 | |||||
| 3 | 3.0 | 2.6 | |||||
| 4 | 2.7 | 1.6 | |||||
| 5 | 2.7 | 2.7 | |||||
| #7 | M/79 | NSCLC [acc] | none | 6 days | 1 | 2.8 | 1.2 |
| #8 | M/49 | NSCLC [scc] | none | 11 days | 1 | 7.3 | 2.1 |
| 2 | 3.3 | 1.7 | |||||
| #9 | F/47 | NSCLC [acc] | none | FDG PET not done | 1 | - | 3.2 |
| 2 | - | 3.0 | |||||
| #10 | M/46 | NSCLC [pd] | none | 28 days | 1 | 4.7 | 1.9 |
| 2 | 1.6 | 0.8 |
NSCLC = non-small cell lung cancer; tumors are consecutively numbered in patients with multiple lesions
scc: squamous cell carcinoma; lcc: large cell carcinoma; acc: adenocarcinoma; pd: poorly differentiated carcinoma
therapy started after FDG PET but 2 weeks before AMT PET scan
therapy was finished more than 6 months before AMT PET scan
PET data acquisition
PET imaging was performed using a GE Discovery STE PET/CT scanner (GE Medical Systems, Milwaukee, WI). All data were acquired in high-resolution 3D mode and reconstructed using a 3D iterative algorithm.
The FDG tracer was synthesized according to the method of Hamacher et al (20). Patients were fasted for at least four hours prior to the FDG PET study and the tracer (0.143 mCi/kg) was injected intravenously. Following a 60-minute uptake period, the patients were positioned in the PET/CT scanner in supine position and a low-intensity scout CT scan (120 keV, 10 mA) was acquired. Based on the scout scan the axial field-of-view for the scan was selected, usually from the neck to the pelvis, and a low-dose helical CT scan (120 keV, 100mA) was acquired for attenuation correction and anatomical localization. At 60 minutes post injection, a whole body FDG PET scan was acquired encompassing multiple bed positions (4 minutes/bed position).
The AMT tracer was produced by a synthesis module designed and built in-house as previously described (21). Patients were fasted for six hours prior to the AMT PET studies to ensure stable plasma tryptophan and large neutral amino acid levels during the study. Initially, a venous line was established for administration of the AMT tracer (0.4 mCi/kg). The patients were then positioned in the PET/CT scanner in supine position and a low-intensity scout CT scan was acquired. Based on information about the location of lung nodules obtained from the previously acquired FDG scan, one bed position was selected at the level of the lungs/myocardium and a low-dose CT scan was acquired for attenuation correction. Coinciding with tracer injection, a 60 min dynamic scan (12 × 10s, 3 × 60s, 3 × 300s, 4 × 600s) was initiated. The reconstructed isotropic spatial resolution of the dynamic AMT study was ~7 mm at FWHM.
Image data processing and analysis
Non-invasive determination of the arterial blood input function using dynamic PET imaging of the left ventricle was obtained using an approach developed previously (22, 23). In this approach, a small region of interest (ROI) at the center of the left ventricle is used to derive a time-activity curve, which represents the arterial blood input function. Lung tumors were visually identified based on CT and FDG PET (where available) images by one experienced observer in all planes showing the tumor. Regions were then drawn manually on the CT images and then copied to all time-frames of the dynamic sequence to obtain regional time-activity curves. Control regions of similar size were also drawn in apparently unaffected lung tissue, far from the tumor, on the contralateral side (in patients with unilateral tumors). Semi-quantitative analysis of FDG and summed AMT images (40 – 60 minutes post-injection) was performed using the mean standard uptake value (SUV). The SUV calculation relates tracer concentration in tissue to the dose injected and the subject's mass: SUV= tissue concentration in ROI [uCi/cc]/injected dose per weight [mCi/kg].
Compartmental modeling and identifiability analysis
Tracer kinetics of AMT in tumor tissue was assessed using a three-compartment model (Figure 1) characterized by the parameter vector K1 − k4, blood volume (BV) and shift parameter (SFT). The rate constant K1 (ml/g/min) represents the forward and k2 (min−1) represents the reverse combined transport of AMT across the blood vessel, interstitial space and cell membrane into the cell cytoplasm where it constitutes the free compartment (Cf). Irreversible enzymatic conversion of AMT to its metabolite(s) and accumulation in the metabolic compartment (Cm) is characterized by the metabolic rate constant k3 (min−1). Finally the rate constant k4 (min−1) characterizes the reverse transport of AMT metabolites across the cell interstitial space and blood vessel back into the blood pool (Figure 1).
Figure 1.
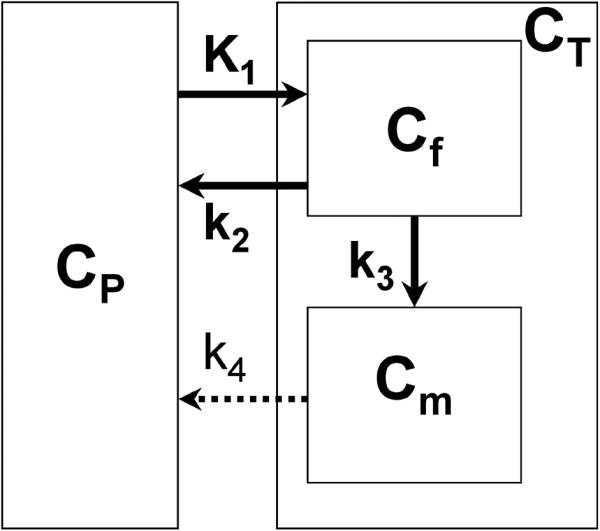
Three-compartment model for α[11C]methyl-L-tryptophan (AMT) kinetics in lung tumor, using first-order rate constants (17). The transport rate constant K1 and the outflow rate constant k2 describe the exchange of AMT between vascular space (CP) and the cell cytoplasm where it constitutes the free compartment (Cf). Irreversible enzymatic conversion of AMT to its metabolite(s) (in the metabolic pool Cm) is characterized by the metabolic rate constant k3. Efflux of AMT metabolites from the metabolic compartment can be represented by rate constant k4. Although, theoretically, AMT metabolites could move from the metabolic pool (Cm) to both the free compartment (Cf) and the vascular space (CP), the applied kinetic modeling included efflux of the tracer metabolites from the entire tissue compartment. The dotted arrow represents the fact that k4 was poorly identifiable in the full model and was eventually set to zero (see Results); thus, the final analysis included only three kinetic rate constants (K1, k2 and k3).
For analysis of parameter identifiability, the structure of the linearized model in the neighborhood of the computed solution was used. A singular value decomposition of the parameter sensitivity matrix (Xij = dfi/dpj, where fi(pj) is the tissue model function at time i dependent on the parameter vector pj) was computed yielding the condition number (CN) of the model (22). The CN of a model with orthonormal parameters is unity, hence CN equals 1 in the ideal case. It was determined empirically (24) that weak dependencies are associated with CN below 10, whereas strong dependencies are associated with CN larger than 20.
Simplified analysis using the Patlak graphical method
In the case of unidirectional uptake of the tracer into the metabolic compartment (i.e for k4 = 0) and after dynamic equilibrium is reached, the unidirectional uptake rate constant K (=K1k3/(k2+k3)) (units of ml/g/min) can be determined using a linear approach first described by Patlak et al. (19).
| (1) |
with CT(t) representing tissue concentration derived from PET imaging and Cp(t) representing the plasma tracer concentration. Furthermore, the rate constant k3 characterizes the enzymatic conversion of AMT, and VD (= K1/(k2+k3)) represents the volume of distribution of the tracer in the free precursor pool (Cf). Finally, the factor ε (= k2/(k2+k3)) takes into account the time lag of the free precursor pool relative to the changing plasma tracer concentration. Upon reaching dynamic equilibrium (dCf/dt = 0; Cf(t) = VD Cp(t)), equation (1) describes a line with slope k3VD and intercept εVD. In case of irreversible uptake, the slope parameter (k3VD) corresponds to the previously described unidirectional uptake rate constant K and the intercept parameter equals to εVD. Finally the ratio between slope and intercept allows estimation of the k3 parameter (k3'= k3/ε).
Statistical Analysis
To determine which kinetic parameter is most influential for determination of the unidirectional uptake rate constant K, a multiple regression analysis was performed. Individual parameters were stepwise included and the associated r2 change in the linear model was used as a measure of importance for a particular parameter. Moreover, bivariate correlations between variables were assessed using Pearson's r value. Statistical significance was assessed at p = 0.05.
RESULTS
Identifiability of compartmental model parameters
Figure 2A shows a representative plane depicting tracer accumulation in a non-small cell lung cancer (NSCLC) tissue of a patient (patient #6, 2-NSCLC, see Table 2) together with the corresponding time-activity curves. The figure indicates very good contrast between AMT tracer accumulation in tumor tissue and surrounding lung tissue. The slight decrease of tracer concentration in tumor tissue at late time-points indicates the presence of reverse transport (efflux) of the AMT tracer from tumor tissue, which can be taken into account in the applied compartmental model through incorporation of a k4 parameter. Although application of the full three-compartment model (K1 − k4) improved the data fit, it also resulted in poor identifiability of the overall parameter vector rendering the obtained set of parameter values instable and highly dependent on noise. The average condition number (CN) for the full three-compartment model was determined as 22.6 ± 6.9 and decreased to 6.3 ± 1.4 when the k4 parameter was set explicitly to 0. The reduced three-compartment model (K1 − k3) proved to be well conditioned yielding robust estimates of the parameter vector. A detailed analysis of the two models showed a highly significant correlation among parameters k2, k3 and k4 (p < 0.001 for all bivariate correlations) in the full model which resulted in an overestimation of both k2 and k3 parameters. In contrast, in the reduced model, no significant correlation was determined between the rate constants k2 and k3 (p = 0.54), K1 and k3 (p=0.12), or K1 and k2 (p=0.06). Based on this identifiability analysis, the reduced three-compartment model (K1 − k3) was chosen for analysis of all tumor tissue time-activity curves.
Figure 2.


A. Images of AMT tracer uptake between 40 – 60 minutes post injection (left) in patient #1 (see Table 2) with a benign cyst. There is a very low accumulation of the tracer in the cyst, with activity being lower than normal lung tissue at all time points.
B. Images of AMT tracer uptake between 40 – 60 minutes post injection (left) in patient #6 (see Table 2) with non-small cell lung cancer with multiple local metastases. The images show high accumulation in tumor tissue (2-NSCLC in Table 2) and an excellent contrast between tumor and lung tissue. ROIs were defined for tumor nodules (white arrows) and lung tissue (black arrows). The corresponding tumor time-activity curve (right) indicates rapid initial uptake of AMT followed by a slight decrease at late time-points. The curve fit applying the reduced compartmental model (k4 = 0) is shown as a solid line whereas the full compartmental model is displayed as a broken line. In addition, a two-compartmental model fit is shown for lung tissue.
C. Representative image of AMT tracer uptake between 40 – 60 minutes post injection (left) in patient #10, 2-NSCLC (see Table 2). Two tumor sites were identified in this patient based on CT and FDG which both were believed to represent NSCLC. The first tumor (1-NSCLC, Table 2) showed time-activity curves similar to Figure 2B as well as a high FDG SUV. In contrast, the second site (orange arrow) showed relatively low uptake. Inspection of the corresponding time-activity curve showed high initial uptake with subsequent plateau followed by tracer washout. Neither the full nor the reduced (shown) three-compartment model fit the data well; however, parameter identifiability was much improved using the reduced model (CN 5.3 vs. 21.8).
Table 2.
Individual parameter estimates derived from the reduced compartmental model
| Patient | Lesion | K1 (ml/g/min) | k2 (min−1) | k3 (min−1) | K (ml/g/min) | Patlak slope |
|---|---|---|---|---|---|---|
| #1 | thymic cyst | 0.012 | 0.092 | 0.019 | 0.0021 | 0.0017 |
| #2 | hamartoma | 0.098 | 0.292 | 0.006 | 0.0019 | 0.0016 |
| #3 | metastasis | 0.098 | 0.279 | 0.006 | 0.0020 | 0.0007 |
| #4 | NSCLC* | 0.170 | 0.179 | 0.008 | 0.0070 | 0.0051 |
| #5 | 1-NSCLC | 0.287 | 0.195 | 0.017 | 0.0236 | 0.0108 |
| 2-NSCLC | 0187 | 0.170 | 0.022 | 0.0213 | 0.0074 | |
| #6 | 1-NSCLC | 0.073 | 0.067 | 0.010 | 0.0096 | 0.0088 |
| 2-NSCLC | 0.128 | 0.131 | 0.015 | 0.0129 | 0.0107 | |
| 3-NSCLC | 0.104 | 0.105 | 0.014 | 0.0125 | 0.0095 | |
| 4-NSCLC | 0.064 | 0.117 | 0.017 | 0.0082 | 0.0043 | |
| 5-NSCLC | 0.063 | 0.036 | 0.006 | 0.0092 | 0.0035 | |
| #7 | NSCLC** | 0.082 | 0.210 | 0.008 | 0.0031 | 0.0030 |
| #8 | 1-NSCLC | 0.176 | 0.131 | 0.011 | 0.0134 | 0.0074 |
| 2-NSCLC* | 0.275 | 0.211 | 0.004 | 0.0053 | 0.0058 | |
| #9 | 1-NSCLC | 0.242 | 0.213 | 0.037 | 0.0359 | 0.0180 |
| 2-NSCLC | 0.184 | 0.151 | 0.026 | 0.0266 | 0.0152 | |
| #10 | 1-NSCLC | 0.114 | 0.070 | 0.011 | 0.0145 | 0.0078 |
| 2-NSCLC** | 0.151 | 0.201 | 0.010 | 0.0075 | 0.0034 | |
| Mean SD | NSCLC | 0.153 | 0.146 | 0.014 | 0.0140 | 0.0081 |
| 0.073 | 0.058 | 0.008 | 0.0091 | 0.0043 | ||
| Unaffected LUNGS | ||||||
| Mean SD | 0.036 | 0.208 | - | - | - | |
| 0.014 | 0.047 | - | - | - | ||
High initial uptake, subsequent tracer washout
Small tumor size (volume ~ 0.8cm3), possible image distortions due to partial volume effect
AMT kinetics in lung tumors
Individual rate constants (K1, k2 and k3) were fitted to dynamic time-activity curves obtained from tumor tissue and the unidirectional uptake rate for AMT (K) was calculated (Table 2). AMT tracer accumulation in non-NSCLC tumors (patients #1 – #3, Table 1) was lower than for lung tissue (Figure 2A) yielding very low K values (0.0019 − 0.0021 ml/g/min) for these lesions (Table 2). This value was more than ten times lower than values obtained for some of the NSCLC tumors with the highest uptake values.
In NSCLC tumors, two main types of time-activity curves were observed. Most NSCLCs showed continuous accumulation of the tracer (Figure 2B), while in a few NSCLCs (patient #4, patient #8 2-NSCLC and #10 2-NSCLC) an initial accumulation phase with subsequent washout (Figure 2C) was observed, resulting in intermediate K values (Table 2). In one patient with NSCLC (patient #7) the calculated tracer uptake was also relatively low although the shape of the curve was similar to that observed in other NSCLC cases with high washout. The likely cause for the observed low tracer uptake may be partial volume effects due to the small size of the tumor (~ 0.8 cm3) as measured on the CT image. The average size of all other NSCLC tumors was 3.1 ± 1.6 cm3 (range 1.2 – 7.3 cm3).
A multiple regression analysis including K1 and k3 as predictors and the unidirectional uptake rate constsnat (K) as outcome showed the k3 parameter to be the main predictor of K (r2 change 0.55 for k3 but only 0.05 for K1). Consequently, K derived from the reduced compartmental model showed a highly significant correlation with the k3 parameter (p < 0.001, Figure 3A) and a significant, but less prominent correlation with the K1 parameter (p = 0.01), indicating that accumulation of the AMT tracer in tumor tissue is primarily due to metabolic conversion. In addition, a significant correlation was determined between the unidirectional uptake rat (K) and the SUV for AMT (p < 0.001, Figure 3B) suggesting that a semi-quantitative measure can be used to estimate metabolic conversion of AMT.
Figure 3.

Correlation between the unidirectional uptake rate (K) derived from the reduced compartmental model (k4 = 0) and either the k3 parameter (A) or the standard uptake value (SUV) for AMT (B). Tumors obtained from different patients are marked by different symbols. The k3 parameter was highly correlated with K indicating that metabolic conversion is the dominant factor in AMT tracer uptake in tumors. Moreover, the K was also significantly correlated with the SUV for AMT suggesting that this semi-quantitative value can provide an estimate of the magnitude of metabolic conversion.
AMT kinetics in unaffected lung tissue
Visual inspection of lung tissue time-activity curves showed continuous washout of AMT tracer (Figure 2A–C) in most patients with little evidence of metabolic retention (except for one subject, see below). Based on this observation lung tissue time-activity curves were fitted with a two-compartmental model (K1, k2) with parameter k3 set explicitly to 0. The two-compartmental model fitted the curves well and yielded an excellent identifiability of the parameter vector (CN = 3.6 ± 0.3).
The K1 parameter characterizing unidirectional transport of AMT into tissue was found to be significantly lower in lung tissue (0.037 ± 0.013 ml/g/min) as compared to NSCLC tumors (0.153 ± 0.074 ml/g/min, p = 0.001). Moreover, both these values were higher than previously determined in normal brain tissue (0.014 ± 0.003, [25]), consistent with a lack of a blood-tissue barrier, such as the blood-brain barrier in the brain. In one patient (patient #5) visual inspection of lung tissue time-activity curves suggested possible metabolic retention of AMT, thus we applied both a two- and three-compartment model to this patient's lung tissue curve. The condition number (4.6 vs. 5.3) as well as the K1 parameter (0.071 vs. 0.076 ml/g/min) for both models was similar with a lower k2 parameter determined for the two-compartmental model (0.271 vs. 0.367 min−1) and a relatively large value for the k3 parameter (0.010 min−1) resulting in a K value similar to that obtained in non-NSCLC tumors (0.0021 ml/g/min).
Simplified analysis of kinetic data
In the absence of arterial blood sampling, complete time-activity curves for the blood input function and the lung tumor can be only obtained when both the left ventricle of the heart and the tumor are in the field-of-view of the scanner. In order to determine whether a simplified analysis not requiring arterial sampling during the initial tracer uptake period could be used to determine K values, we applied the Patlak graphical analysis approach to data from 40 – 60 min post-injection. The comparison of K values in tumors obtained from the reduced compartmental model and those derived from the simplified Patlak analysis showed an excellent correlation (Pearson's r = 0.83, p = 0.001, Figure 4A), although K values derived using the Patlak graphical analysis were biased towards lower values. The epsilon factor equal to the expression k2/(k2+k3) derived from compartmental modeling was determined as 0.97 ± 0.01 for lung tissue and 0.92 ± 0.05 for tumor tissue. As this factor is close to unity, the volume of distribution (VD) of AMT in tissue can be approximated by the intercept derived from the Patlak graphical analysis. Figure 4B shows the correlation between VD values derived from compartmental analysis (=K1/(k2+k3)) and the Patlak intercept. Although absolute values of VD were slightly overestimated using the Patlak approach, we found an excellent correlation between these two measures (Pearson's r = 0.77, p < 0.001).
Figure 4.

(A) Correlation of K values derived from the reduced compartmental fit and the Patlak graphical analysis. Pearson's r was determined as 0.83 indicating an excellent correlation between these two measures. Tumors obtained from different patients are marked by different symbols. (B) An excellent correlation was also determined between the volume of distribution (VD) determined using the compartmental fit and the Patlak graphical analysis.
The k3 parameter can also be estimated from the Patlak graphical analysis as the quotient between the slope and intercept of the linear fit. Following removal of a highly influential point, the correlation between the k3 parameter derived from the reduced compartmental fit and that calculated from the Patlak graphical analysis was found to be not significant (r = 0.46, p = 0.07). The lack of correlation is likely the result of uncertainty associated with the quotient of the slope and intercept parameters.
Comparison between AMT and FDG SUVs
We found a significant correlation between the FDG SUV and AMT SUVs (r=0.73, p = 0.004), with the AMT SUV being in general about half of the FDG SUV. Moreover, the FDG SUVs were highly correlated with K for AMT (p = 0.001) and to a lesser degree with both the K1 (p = 0.02) and k3 (p = 0.04) parameters. A multiple regression analysis showed that only K for AMT was a significant independent predictor of FDG SUV.
DISCUSSION
This study demonstrates the feasibility of quantifying transport and metabolic rates of tryptophan tracer AMT in lung tumors. We have also shown preliminary evidence for higher unidirectional uptake of this PET tracer in non-small cell lung cancers (NSCLCs), as compared to non-tumorous lung tissue and non-NSCLC tumors, including benign lesions. Since AMT can be metabolized by IDO via the kynurenine pathway, it is likely that high AMT metabolic rates reflect increased tryptophan metabolism by this pathway in NSCLCs, although the exact metabolic rates for tryptophan itself cannot be calculated as the correction factor (lumped constant) between AMT and tryptophan is not known. A simplified analysis of the kinetic data, using the Patlak graphical approach with venous blood sampling, showed that while the unidirectional uptake rate constant (K) as well as the tissue tracer distribution volume (VD) are accurately estimated by the Patlak approach, evaluation of metabolic conversion alone (characterized by the k3 parameter) is suboptimal, especially in the middle of the value range. As a result, compartmental modeling is highly desirable if an accurate measurement of AMT metabolic rates is required. This AMT PET study in lung tumors suggests that this imaging method may also be useful in other extra-cerebral tumors with abnormal tryptophan metabolism.
Our study demonstrates a positive correlation between FDG SUV and AMT SUV values, although FDG SUV was best predicted by the unidirectional uptake rate constant. FDG SUV is a strong predictor of proliferative activity in non-small cell lung cancers (NSCLCs) (26,27). The relationship between FDG SUV and AMT kinetic values suggests that lung tumors with higher proliferative activity have higher transport rates and higher metabolism of tryptophan, likely via the kynurenine pathway. High AMT transport could be due to increased vascularity and the presence of newly formed vessels with increased permeability. A similar effect was seen in malignant gliomas, where signs of an impaired blood-brain-barrier were associated with high volume of distribution (VD) values for AMT (18). High AMT transport can also reflect an upregulation of the transport system that supplies tryptophan for protein synthesis and also for IDO. Tryptophan influx into cells is supported by the plasma membrane transport system-L, which is responsible for the transport of large neutral amino acids including several essential amino acids such as tryptophan [see review of Verrey [28]). The neutral amino acid transporter LAT-1 (29) is highly expressed in almost all studied tumor cell lines and tumor types, playing an important role in allowing cell growth (30,31). A recent study showed in a large cohort (n=321) of patients with NSCLC that expression of LAT-1 has a strong prognostic value for metastatic disease and the 5-year survival rate (32). Interestingly, 1-methyl-tryptophan, a potent competitive inhibitor of IDO, which is being tested as an anti-cancer agent to break tumor immuno-resistance, is also an inhibitor of L-tryptophan transport (33). AMT PET could identify tumors with high LAT-1 expression as well as high IDO activity and also monitor the effect of IDO inhibitors on tryptophan transport and metabolism.
The findings of the current study show some intriguing differences between lung tumors and brain tumors in terms of AMT kinetics. Our recent studies in brain tumors have demonstrated higher transport rates but lower metabolic rates of AMT in high-grade as compared to low-grade tumors (12, 18). Grade III-IV gliomas with high Ki-67 expression showed relatively low k3 values estimated by the Patlak approach, and this was associated with limited IDO expression mostly confined to endothelial cells. In contrast, low-grade brain tumors showed widespread IDO expression, consistent with high metabolic rates of AMT. Widespread expression of IDO in low-grade brain tumors may play a role in limiting proliferative activity via local tryptophan depletion while creating a tumor environment allowing long-term immune escape. In the present study, it was not possible to compare AMT kinetic variables across tumor grades or between various tumor types statistically. Nevertheless, both transport and metabolic rates were high in NSCLCs, consistent with a massive presence of IDO and the LAT-1 transporter as shown by previous studies (3,9,13,32). This finding supports the notion that NSCLCs could be a good target for IDO inhibitors, and AMT PET could inform such trials. Other extracerebral malignancies, known to express IDO and/or LAT-1, could be tested for a similar use of dynamic PET scanning with AMT.
Our data show that AMT kinetics was not homogeneous even within the NSCLC group: a few lesions showed a time activity curve with an early peak followed by a decline in activity within a few minutes after tracer injection, although retention was higher than that in corresponding lung tissue. Also, different tracer kinetics for each tumor could be seen even within a patient with multiple NSCLC lesions. Further AMT PET studies with a larger sample and comparisons with tissue findings, including measures of LAT transporters, IDO or metabolites of the kynurenine pathway, could determine the underlying mechanisms of these differences in uptake. It should be also noted that AMT PET time-activity curves often showed evidence of late efflux of the tracer and/or its metabolite(s) from the tumor tissue (see Figure 2a). Although we did not calculate efflux rates, the signs of tracer efflux, which was particularly prominent and early in three cases of NSCLC (see Figure 2C), raise the possibility of an effect of drug efflux transporters, which can contribute to drug resistance in a wide variety of malignancies, including lung cancers (34). How these transporters would affect retention of AMT in tumor tissue, deserves further studies. Finally, a recent study demonstrated that tryptophan influx into cancer cells is tightly coupled with the efflux of kynurenine metabolites (35). This exchange process, carried out by LAT transporters, facilitates tryptophan flux toward IDO-producing cells and protects these cells from kynurenine accumulation thus diminishing the apoptotic effect of kynurenines. Considering this process, it is likely that tryptophan transport into IDO expressing cells (estimated by K1 on AMT PET) and metabolite efflux (estimated by k4) are inter-related; therefore, calculation of K1 (transport rate) and k3 (metabolic rate) in the simplified model provides an accurate characterization of kinetic movement of tryptophan in tumor tissue; determination of k4 may not yield substantial additional information in most cases while greatly diminishing the identifiability of the other parameters.
In conclusion, this initial study with dynamic PET/CT scanning and non-invasively derived arterial blood input function in lung tumors demonstrates increased transport and metabolism of the tryptophan tracer AMT in non-small cell lung cancers, in which high AMT kinetic values are seen in tumors with high proliferative activity as suggested by high glucose uptake. Since abnormal tumor tryptophan metabolism via the kynurenine pathway is strongly implicated in tumor immuno-resistance, AMT PET/CT may be a clinically useful molecular imaging method to identify patients for pharmacologic targeting of tryptophan metabolism and to monitor treatment effects during emerging clinical trials with inhibitors of IDO and other therapeutic approaches targeting tryptophan transport and/or metabolism. PET scanning of AMT kinetics could be also useful to further study whether increased IDO can facilitate or inhibit tumor growth in various extracerebral tumors.
ACKNOWLEDGEMENT
This project has been funded in part with Federal Funds from the National Cancer Institute, National Institutes of Health, under Contract No. NO1-CO-12400. The content of this publication does not necessarily reflect the views or policies of the Department of Health and Human Services, nor does mention of trade names, commercial products, or organizations imply endorsement by the U.S. Government. The study was also supported by a grant from the National Cancer Institute (#CA-12341, to Csaba Juhasz). The authors thank Galina Rabkin, CNMT, Angela Wigeluk, CNMT, and Mei-li Lee, MS, for their technical assistance in performing the PET studies.
References
- 1.Peters JC. Tryptophan nutrition and metabolism: an overview. Adv Exp Med Biol. 1991;294:345–358. doi: 10.1007/978-1-4684-5952-4_32. [DOI] [PubMed] [Google Scholar]
- 2.Schwarcz R, Pellicciari R. Manipulation of brain kynurenines: glial targets, neuronal effects, and clinical opportunities. J Pharmacol Exp Ther. 2002;303:1–10. doi: 10.1124/jpet.102.034439. [DOI] [PubMed] [Google Scholar]
- 3.Uyttenhove C, Pilotte L, Theate I, et al. Evidence for a tumoral immune resistance mechanism based on tryptophan degradation by indoleamine 2,3-dioxygenase. Nat Med. 2003;9:1269–1274. doi: 10.1038/nm934. [DOI] [PubMed] [Google Scholar]
- 4.Munn DH, Mellor AL. IDO and tolerance to tumors. Trends Mol Med. 2004;10:15–18. doi: 10.1016/j.molmed.2003.11.003. [DOI] [PubMed] [Google Scholar]
- 5.Ozaki Y, Edelstein MP, Duch DS. Induction of indoleamine 2,3-dioxygenase: a mechanism of the antitumor activity of interferon gamma. Proc Natl Acad Sci U S A. 1988;85:1242–1246. doi: 10.1073/pnas.85.4.1242. [DOI] [PMC free article] [PubMed] [Google Scholar]
- 6.Mellor AL, Munn DH. Tryptophan catabolism and T-cell tolerance: immunosuppression by starvation? Immunol Today. 1999;20:469–473. doi: 10.1016/s0167-5699(99)01520-0. [DOI] [PubMed] [Google Scholar]
- 7.Friberg M, Jennings R, Alsarraj M, et al. Indoleamine 2,3-dioxygenase contributes to tumor cell evasion of T cell-mediated rejection. Int J Cancer. 2002;101:151–155. doi: 10.1002/ijc.10645. [DOI] [PubMed] [Google Scholar]
- 8.Travers MT, Gow IF, Barber MC, Thomson J, Shennan DB. Indoleamine 2,3-dioxygenase activity and L-tryptophan transport in human breast cancer cells. Biochim Biophys Acta. 2004;1661:106–112. doi: 10.1016/j.bbamem.2003.12.004. [DOI] [PubMed] [Google Scholar]
- 9.Astigiano S, Morandi B, Costa R, et al. Eosinophil granulocytes account for indoleamine 2,3-dioxygenase-mediated immune escape in human non-small cell lung cancer. Neoplasia. 2005;7:390–396. doi: 10.1593/neo.04658. [DOI] [PMC free article] [PubMed] [Google Scholar]
- 10.Okamoto A, Nikaido T, Ochiai K, et al. Indoleamine 2,3-dioxygenase serves as a marker of poor prognosis in gene expression profiles of serous ovarian cancer cells. Clin Cancer Res. 2005;11:6030–6039. doi: 10.1158/1078-0432.CCR-04-2671. [DOI] [PubMed] [Google Scholar]
- 11.Brandacher G, Perathoner A, Ladurner R, et al. Prognostic value of indoleamine 2,3-dioxygenase expression in colorectal cancer: effect on tumor-infiltrating T cells. Clin Cancer Res. 2006;12:1144–1151. doi: 10.1158/1078-0432.CCR-05-1966. [DOI] [PubMed] [Google Scholar]
- 12.Batista CE, Juhász C, Kupsky WJ, et al. Tryptophan metabolism in brain tumors associated with epilepsy: imaging and immunohistochemistry analysis of low and high-grade tumors. Annual Meeting of the American Epilepsy Society; Philadelphia, PA. December 2007; abstract. Program No. 3.073. [Google Scholar]
- 13.Karanikas V, Zamanakou M, Kerenidi T, et al. Indoleamine 2,3-dioxygenase (IDO) expression in lung cancer. Cancer Biol Ther. 2007;6:1258–1262. doi: 10.4161/cbt.6.8.4446. [DOI] [PubMed] [Google Scholar]
- 14.Ino K, Yamamoto E, Shibata K, et al. Inverse correlation between tumoral indoleamine 2,3-dioxygenase expression and tumor-infiltrating lymphocytes in endometrial cancer: its association with disease progression and survival. Clin Cancer Res. 2008;14:2310–2317. doi: 10.1158/1078-0432.CCR-07-4144. [DOI] [PubMed] [Google Scholar]
- 15.Tohyama Y, Takahashi S, Merid MF, Watanabe A, Diksic M. The inhibition of tryptophan hydroxylase, not protein synthesis, reduces the brain trapping of alpha-methyl-L-tryptophan: an autoradiographic study. Neurochem Int. 2002;40:603–610. doi: 10.1016/s0197-0186(01)00132-2. [DOI] [PubMed] [Google Scholar]
- 16.Shimizu T, Nomiyama S, Hirata F, Hayaishi O. Indoleamine 2,3-dioxygenase. Purification and some properties. J Biol Chem. 1978;253:4700–4706. [PubMed] [Google Scholar]
- 17.Chugani DC, Muzik O. [C-11]Methyl-L-tryptophan PET maps brain serotonin synthesis and kynurenine pathway metabolism. J Cereb Blood Flow Metab. 2000;20:2–9. doi: 10.1097/00004647-200001000-00002. [DOI] [PubMed] [Google Scholar]
- 18.Juhász C, Chugani DC, Muzik O, et al. In vivo uptake and metabolism of α-[11C]methyl-L-tryptophan in human brain tumors. J Cereb Blood Flow Metab. 2006;26:345–357. doi: 10.1038/sj.jcbfm.9600199. [DOI] [PubMed] [Google Scholar]
- 19.Patlak CS, Blasberg RG, Fenstermacher JD. Graphical evaluation of blood-to-brain transfer constants from multiple-time uptake data. J Cereb Blood Flow Metab. 1983;3:1–7. doi: 10.1038/jcbfm.1983.1. [DOI] [PubMed] [Google Scholar]
- 20.Hamacher K, Coennen HH, Stoecklin G. Efficient stereospecific synthesis of no-carrier-added 2-[F-18]-fluoro-2-deoxy-D-glucose using aminopolyether supported nucleophilic substitution. J Nucl Med. 1986;27:235–238. [PubMed] [Google Scholar]
- 21.Chakraborty PK, Mangner TJ, Chugani DC, Muzik O, Chugani HT. A high-yield and simplified procedure for the synthesis of alpha-[11C]methyl-L-tryptophan. Nucl Med Biol. 1996;23:1005–1008. doi: 10.1016/s0969-8051(96)00127-8. [DOI] [PubMed] [Google Scholar]
- 22.Muzik O, Behrendt DB, Mangner TJ, Chugani HT. Design of a protocol for quantitative brain FDG studies with PET not requiring invasive blood sampling. J Nucl Med. 1994;35:104P. abstract. [Google Scholar]
- 23.Suhonen-Polvi H, Ruotsalainen U, Kinnala A, et al. FDG-PET in early infancy: simplified quantification methods to measure cerebral glucose utilization. J Nucl Med. 1995;36:1249–1254. [PubMed] [Google Scholar]
- 24.Belsley D. Conditioning diagnostics: collinearity and weak data in regression. Wiley & Sons; New York: 1991. [Google Scholar]
- 25.Chugani DC, Muzik O, Chakraborty P, Mangner TJ, Chugani HT. Human brain serotonin synthesis capacity measured in vivo with [C-11]Methyl-L-tryptophan. Synapse. 1998;28:33–43. doi: 10.1002/(SICI)1098-2396(199801)28:1<33::AID-SYN5>3.0.CO;2-D. [DOI] [PubMed] [Google Scholar]
- 26.Vesselle H, Schmidt RA, Pugsley JM, et al. Lung cancer proliferation correlates with [F-18]fluorodeoxyglucose uptake by positron emission tomography. Clin Cancer Res. 2000;6:3837–3844. [PubMed] [Google Scholar]
- 27.Yamamoto Y, Nishiyama Y, Ishikawa S, et al. Correlation of 18F-FLT and 18FFDG uptake on PET with Ki-67 immunohistochemistry in non-small cell lung cancer. Eur J Nucl Med Mol Imaging. 2007;34:1610–1616. doi: 10.1007/s00259-007-0449-7. [DOI] [PubMed] [Google Scholar]
- 28.Verrey F, System L. heteromeric exchangers of large, neutral amino acids involved in directional transport. Pflugers Arch. 2003;445:529–533. doi: 10.1007/s00424-002-0973-z. [DOI] [PubMed] [Google Scholar]
- 29.Kanai Y, Segawa H, Miyamoto K, Uchino H, Takeda E, Endou H. Expression cloning and characterization of a transporter for large neutral amino acids activated by the heavy chain of 4F2 antigen (CD98) J Biol Chem. 1998;273:23629–23632. doi: 10.1074/jbc.273.37.23629. [DOI] [PubMed] [Google Scholar]
- 30.Yanagida O, Kanai Y, Chairoungdua A, et al. Human L- type amino acid transporter 1 (LAT1): characterization of function and expression in tumor cell lines. Biochim Biophys Acta. 2001;1514:291–302. doi: 10.1016/s0005-2736(01)00384-4. [DOI] [PubMed] [Google Scholar]
- 31.Lin J, Raoof DA, Thomas DG, et al. L-type amino acid transporter-1 overexpression and melphalan sensitivity in Barrett's adenocarcinoma. Neoplasia. 2004;6:74–84. doi: 10.1016/s1476-5586(04)80054-x. [DOI] [PMC free article] [PubMed] [Google Scholar]
- 32.Kaira K, Oriuchi N, Imai H, et al. Prognostic significance of L-type amino acid transporter 1 expression in resectable stage I-III nonsmall cell lung cancer. Br J Cancer. 2008;98:742–748. doi: 10.1038/sj.bjc.6604235. [DOI] [PMC free article] [PubMed] [Google Scholar]
- 33.Kudo Y, Boyd CA. The role of L-tryptophan transport in L-tryptophan degradation by indoleamine 2,3-dioxygenase in human placental explants. J Physiol. 2001;531:417–423. doi: 10.1111/j.1469-7793.2001.0417i.x. [DOI] [PMC free article] [PubMed] [Google Scholar]
- 34.Modok S, Mellor HR, Callaghan R. Modulation of multidrug resistance efflux pump activity to overcome chemoresistance in cancer. Curr Opin Pharmacol. 2006;6:350–354. doi: 10.1016/j.coph.2006.01.009. [DOI] [PubMed] [Google Scholar]
- 35.Kaper T, Looger LL, Takanaga H, Platten M, Steinman L, Frommer WB. Nanosensor detection of an immunoregulatory tryptophan influx/kynurenine efflux cycle. PLoS Biol. 2007;5:e257. doi: 10.1371/journal.pbio.0050257. [DOI] [PMC free article] [PubMed] [Google Scholar]