Abstract
We have previously reported on the equivalent scatterer size, attenuation coefficient, and axial strain properties of atherosclerotic plaque ex-vivo. Since plaque structure and composition may be damaged during a carotid endarterectomy procedure, characterization of in-vivo properties of atherosclerotic plaque is essential. The relatively shallow depth of the carotid artery and plaque enables non-invasive evaluation of carotid plaque utilizing high frequency linear array transducers. We investigate the ability of the attenuation coefficient and equivalent scatterer size parameters to differentiate between calcified, and lipidic plaque tissue. Softer plaques especially lipid rich and those with a thin fibrous cap are more prone to rupture and can be classified as unstable or vulnerable plaque. Preliminary results were obtained from 10 human patients whose carotid artery was scanned in-vivo to evaluate atherosclerotic plaque prior to a carotid endarterectomy procedure. Our results indicate that the equivalent scatterer size obtained using Faran’s scattering theory for calcified regions are in the 120~180 µm range while softer regions have larger equivalent scatterer size distribution in the 280~470 µm range. The attenuation coefficient for calcified regions as expected is significantly higher than that for softer regions. In the frequency bandwidth ranging from 2.5~7.5 MHz, the attenuation coefficient for calcified regions lies between 1.4~2.5 dB/cm/MHz, while that for softer regions lies between 0.3~1.3 dB/cm/MHz.
Keywords: atherosclerosis, attenuation, attenuation coefficient, Faran, scatterer size, tissue characterization, ultrasound
Introduction
Previous ultrasound based in-vivo clinical analysis of atherosclerosis was performed utilizing intravascular ultrasound (IVUS) techniques on coronary arteries [1–6]. Wilson et al. [7] using IVUS radiofrequency (RF) data identified regions with a high attenuation vs. frequency slope as degenerative plaque. Nair et al. [4, 8] attempted to predict coronary plaque composition using IVUS RF data analysis, and concluded that regularized autoregressive analysis can improve the spatial accuracy of parametric mapping of collagen, fibrin, muscle, nuclei, elastic fibers, and calcium. Leung et al. [6] performed in-vivo IVUS elastography studies on human patients. Although IVUS provides higher spatial resolution, it also suffers from problems such as reverberation artifacts, increased frequency dependent attenuation etc in addition to being an invasive procedure. These problems impact the accuracy of ultrasonic tissue characterization (UTC) parameters and strain estimations performed. In-vivo UTC methods have also been used extensively to characterize the liver [9–11], breast [12], and cardiac muscle tissue [13–16].
However, relatively fewer in-vivo UTC studies have been performed on the carotid artery using external clinical linear array transducers [17–20]. Urbani et al. [18] illustrated that the integrated backscatter (IBC) computed in-vivo was effective for differentiating between lipidic, fibrotic, and calcified plaque in human atherosclerotic carotid plaques. However, newer studies of carotid plaque characterization are based on the estimation of displacement and strain in carotid atherosclerotic plaque [17, 19, 20]. In addition, many of the previous carotid plaque studies were ex-vivo studies [21–25]. Ultrasonic attenuation [21, 26], IBC [21–24, 27], and other scattering parameters such as the slope, midband fit (MBF) and the zero frequency intercept of power spectra of the RF echo signals [24, 28] have all been utilized for UTC based analysis of carotid plaque tissue.
Waters et al. [24] reported that IBC and MBF based UTC parameters provided good agreement with plaque composition obtained from histological analysis on fixed carotid endarterectomy plaque specimens. Waki et al. [23] correlated histological results obtained ex-vivo with in-vivo IBC values obtained by processing RF data from the carotid artery of patients and volunteers scanned using a SONOS 5500 system with a 7.5 MHz linear-array transducer. They concluded that the low IBS values at the interface of atherosclerotic lesions in the carotid artery suggest the presence of a thin fibrous cap frequently associated with unstable or vulnerable plaque.
One of the motivations for the analysis of carotid plaque in-vivo is due to the possible damage to plaque morphology and structure during carotid endarterectomy procedures. In addition, the relatively shallow depth of the carotid artery and plaque enable the utilization of high frequency clinical linear array transducers to non-invasively characterize atherosclerotic carotid plaque. The ability to identify plaques that are unstable or prone to rupture can significantly aid the clinician in choosing appropriate interventional procedures. Different features that have been associated with vulnerable, unstable or symptomatic plaques include the presence of surface ulcerations, inflammation, presence of a thin fibrous cap overlying a significant lipid core, presence of intra plaque hemorrhage and new vessel formation in the plaque [29–32]. Moreover, in-vivo evaluations before surgery are important to obtain information regarding both plaque composition and structure which may provide useful information regarding the need for immediate intervention in these patients.
Materials & Method
In-vivo attenuation coefficient and equivalent scatterer size estimation
We have previously reported on a reference phantom based power difference method to calculate attenuation in small tissue samples ex-vivo [26]. We will utilize this method to compute the attenuation coefficient and to estimate the attenuation compensated equivalent scatterer size parameter [25] from the ultrasound RF data recorded. The reference phantom used is a tissue mimicking (TM) effective scatterer size phantom, where the uniform region is scanned to obtain the reference RF data. The background is composed of 48 µm diameter glass beads, with the attenuation coefficient of the background material of 0.5 dB/MHz/cm. After each patient was scanned, the reference phantom was scanned immediately using the same system settings. For both attenuation and equivalent scatterer size estimation, the transducer was set to a center frequency of 6.15 MHz, with the bandwidth from 2.5MHz~7.5MHz. The line density was set to the maximum, i.e. 508 lines over the 38mm width of the transducer. The focus was set just below the plaque location.
For in-vivo estimation of the attenuation coefficient we use a similar approach as in the ex-vivo situation. Based on the B-mode images obtained from the RF data, we mark the top and bottom boundaries of the plaque, and calculate the thickness of the plaque using this approach. Data windows containing 512 RF data points from each A-line were selected from the region just below and above the plaque to estimate the power spectrum. Short-time Fourier transform (STFT) analysis using a Hanning gated 256 point non-overlapping data segments were used to compute the power spectrum. Three STFT were computed over each A-line data segment (axial direction), along with the STFT computed over 20 A-lines in the lateral direction averaged to compute the power spectrum. The axial direction is defined as the beam propagation direction, while the lateral direction refers to data within the ultrasound scan plane of the linear array transducer. Since the sampling rate was 40MHz, and A-line density was 38mm/508 A-lines, the final power-spectrum was obtained from a 2-D block with dimensions of (512×1.54)/(2×40) = 9.86 mm in the axial direction and 20×(38/508) = 1.5 mm in the lateral direction. For each block, an attenuation coefficient value is estimated. In a similar manner to the ex-vivo situation, we assume that the attenuation coefficient has a linear dependence with frequency. For a plaque segment of length L mm in the lateral direction, the computation generates N=INT[L/1.5] estimation points, where INT denotes the integer value. We calculate the mean attenuation coefficient and standard deviation from the N estimation values. The mean attenuation is then utilized to correct the power spectra of the ROI prior to the scatterer size estimation. Unlike the ex-vivo situation, where we can average several estimates obtained from multiple data sets or imaging planes, under in-vivo imaging conditions the sonographer has to hold the transducer steady on the patient skin (for data acquisition), the acquired data is always along a single imaging plane. Therefore, the estimated attenuation value fluctuates, if only a single block of data is utilized. The fluctuations are significantly reduced, by averaging several estimated values to reduce fluctuations in the value of the attenuation coefficient.
The power spectra for the reference phantom, at the same depths as the regions selected in-vivo are calculated in a similar manner. We average 25 independent STFT realizations to obtain the expected value or power spectrum for the reference phantom. Finally the power difference approach is utilized to calculate the attenuation coefficient of plaque in-vivo [26]. The power difference method requires the computation of the normalized power spectrum (normalized using the reference phantom data collected at the same depth) both above and below the region of interest (ROI), namely plaque in the in-vivo scans along with regions at similar depths in a reference phantom. The difference between the two normalized power spectra are utilized to calculate the attenuation coefficient. The other advantage of using a reference phantom is that we can average data from multiple scan planes to obtain smooth reference power spectra, thus reducing the estimation error. This concept was presented in detail in [26]. In addition, note that since the in-vivo plaque structure is more complicated than the ex-vivo situation (which only contain the excised plaque), and the uniform reference phantom may not completely compensate for all system parameters. For the power difference method RF data was selected in regions with no plaque for the upper ROI and below the plaque for the second ROI [26]. After the attenuation coefficient was calculated, Faran’s scattering theory for glass beads similar to that described for the ex-vivo situation was used to estimate an equivalent scatterer size parameter.
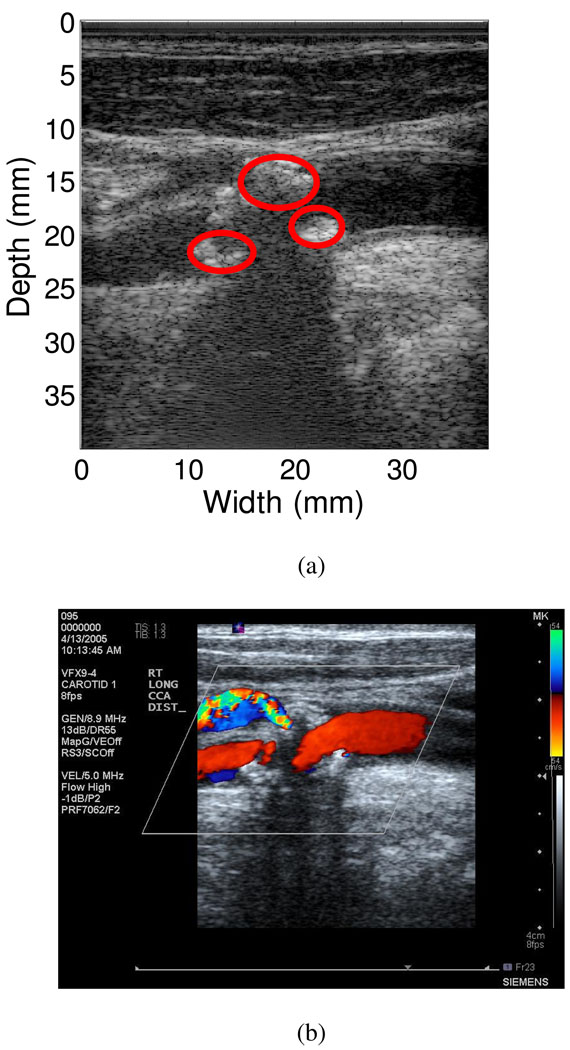
Following data acquisition, different ROI in the plaque were identified by a radiologist from the ultrasound B-mode and color-flow Doppler images. The radiologist blinded to the UTC results identified 16 ROI’s from the 10 subjects that included 8 calcified regions and 8 soft regions. Generally, on ultrasound B-mode images, calcified regions appear brighter and have increased acoustic shadowing below the plaque, while soft regions appear as darker areas and usually have no associated shadowing below the plaque. Color-flow Doppler imaging was utilized to indicate the absence of blood flow in these ROIs. Figure 1(a) presents the ultrasound B-mode image for a patient that depicts a large calcified plaque inside the carotid artery. Color-flow Doppler imaging also indicates the absence of any blood flow in these ROI as shown in Figure 1(b).
Figure 1.
Calcified plaque within the carotid artery of a patient. (a) B-mode image of the plaque, where the red circles indicate calcified regions identified by the radiologist. (b) Color-flow Doppler image indicates no blood flow within the plaque region.
Experimental Setup
In-vivo data acquisition on patients with carotid stenosis and plaque was performed at the University of Wisconsin-Madison Hospitals and Clinics, under a protocol approved by the UW-Madison Institutional review board (IRB) for data acquisition on human patients. Ultrasound RF data were acquired on patients who provide written consent to participate in the study. Patients were scanned using a Siemens Antares system (Siemens Ultrasound, Mountain View, CA, USA) equipped with the Axius direct ultrasound research interface (URI), which provides 16 bit digitized echo signals at a sampling rate of 40 MHz. In addition to the RF data acquisition a complete carotid clinical ultrasound study was performed. This included color-flow Doppler imaging to determine regions and velocities of blood flow and to guide acquisition of ultrasound B-mode data loops. Patient scanning was performed as a standard clinical carotid examination, where the sonographer places the transducer on the skin surface at the location of carotid artery. A VFX 9-4 linear array transducer was used for patient scans. The lateral resolution was also set to the highest value, i.e. 508 A-lines for an image field width of 38 mm, and a single transmit focus was set just below the plaque.
In-vivo Experimental Results
Attenuation Coefficient and Equivalent Scatterer Size Estimation
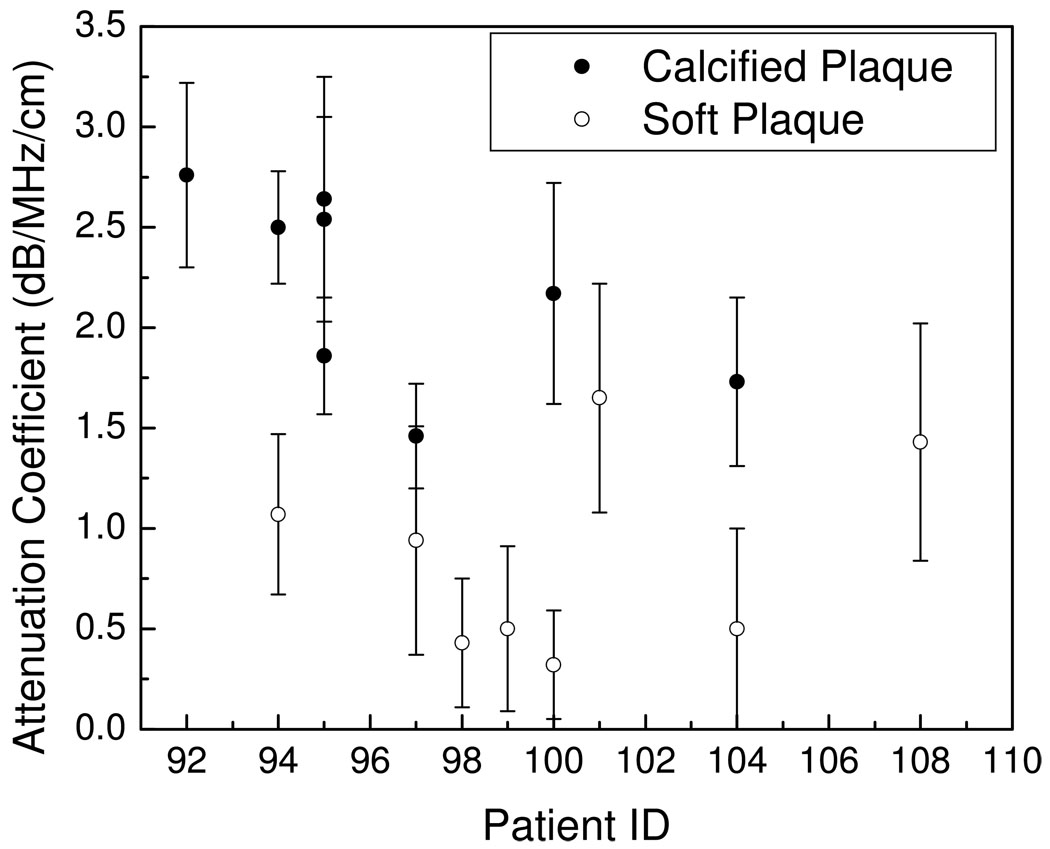
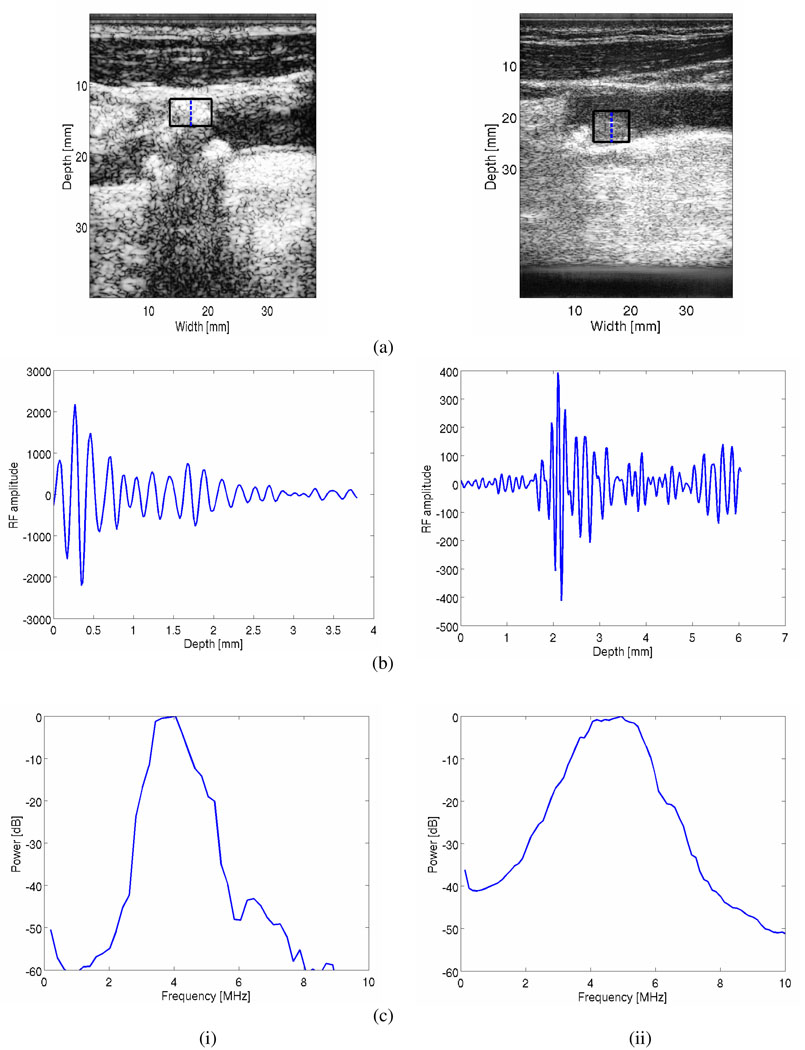
Plaque ROI are classified using the radiologist’s identification of these regions as either soft or calcified plaques (The B-mode and color Doppler images for plaque classification were read by Dr. Mark Kliewer, M.D. who is a board-certified radiologist). Observe from Figure 2, that the attenuation coefficients for calcified regions are significantly higher than that for softer regions. In the frequency bandwidth ranging from 2.5~7.5 MHz, the attenuation coefficient for calcified regions lies between 1.4~2.5 dB/cm/MHz, while that for softer regions were between 0.3~1.3 dB/cm/MHz. Acoustic shadowing is one of the diagnostic signs radiologists utilize to characterize the plaque type, and the quantitative results presented in Figure 2 verifies this readings. Figure 3, presents RF segments and the corresponding power spectra obtained over a block of RF data indicated in the figure for both calcified (hyperechogenic) and hypoechogenic regions, i.e. originating from softer and lipid rich plaques. Note that the power spectra obtained from hypoechogenic regions (Figure 3 ii (c)) in the plaque contains significantly higher frequency content when compared to the RF data obtained from the calcified plaques (Figure 3 i (c)). This observation also illustrates in the number of zero-crossings visualized in the RF segments in Figure 3 (b).
Figure 2.
Plot of the attenuation coefficient for calcified and soft plaque shown versus patient number.
Figure 3.
B-mode images (a) for both calcified (i) and soft or lipid rich (ii) plaque tissue. RF data segments from within these plaque types are shown (b), along with the corresponding power spectra estimated over the block indicated in the B-mode images.
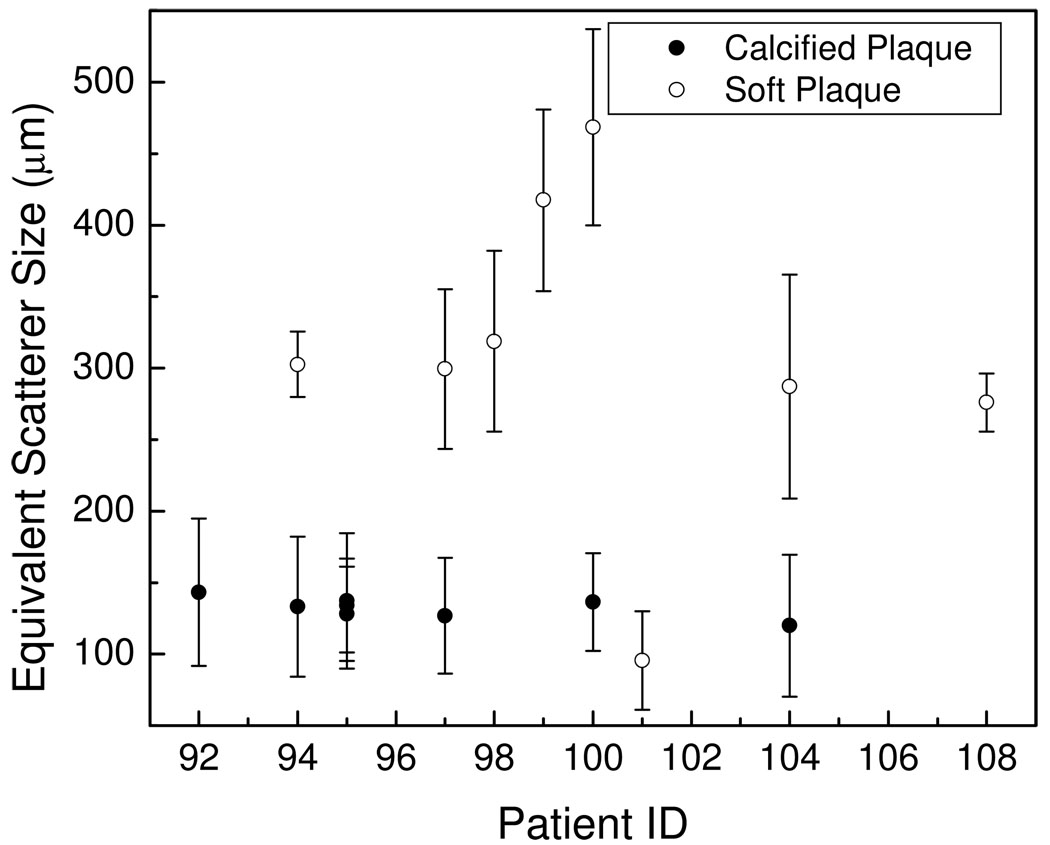
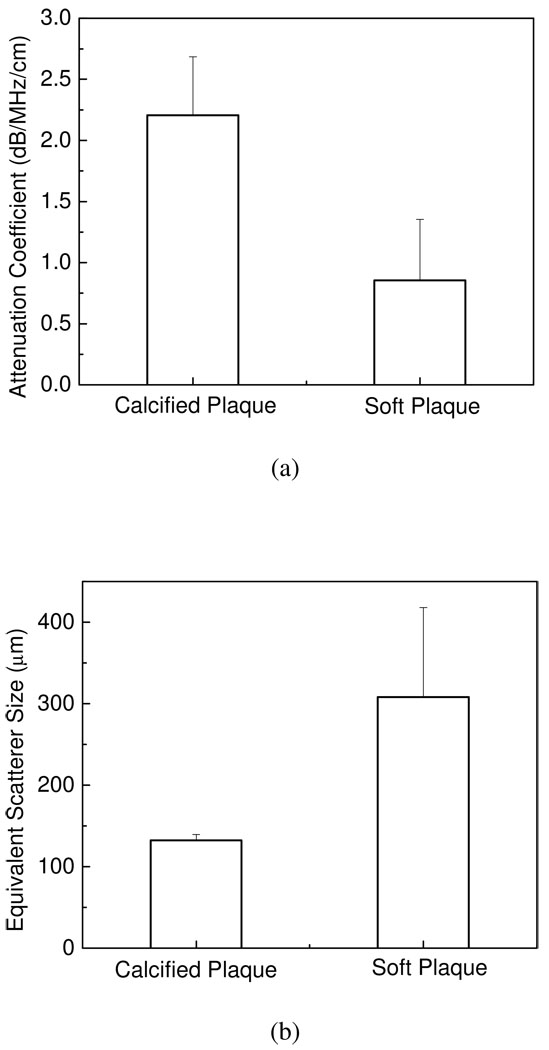
In a similar manner the equivalent scatterer sizes estimated using Faran’s scattering theory, are shown in Figure 4. The results in Figure 4, indicate that the equivalent scatterer size for calcified regions lies in the range 120~180 µm, while that for soft plaque regions are in the 280~470 µm range. Bar plots of the mean and standard deviation of the attenuation coefficient and equivalent scatterer size for calcified and soft plaques shown in Figure 5, show that the mean attenuation coefficient for calcified plaque is 2.21±0.47dB/MHz/cm, and 0.86±0.50dB/MHz/cm for softer plaques. For the equivalent scatterer size parameter, calcified plaque demonstrates consistent values of scatterer size of 132±7µm, while softer plaques indicate scatterer sizes in the 308±110µm range.
Figure 4.
Plot of the equivalent scatterer size for calcified and soft plaque shown versus patient number.
Figure 5.
Bar plot of (a) the mean and standard deviation of the attenuation coefficient, (b) the mean and standard deviation of equivalent scatterer size for calcified and soft plaque respectively.
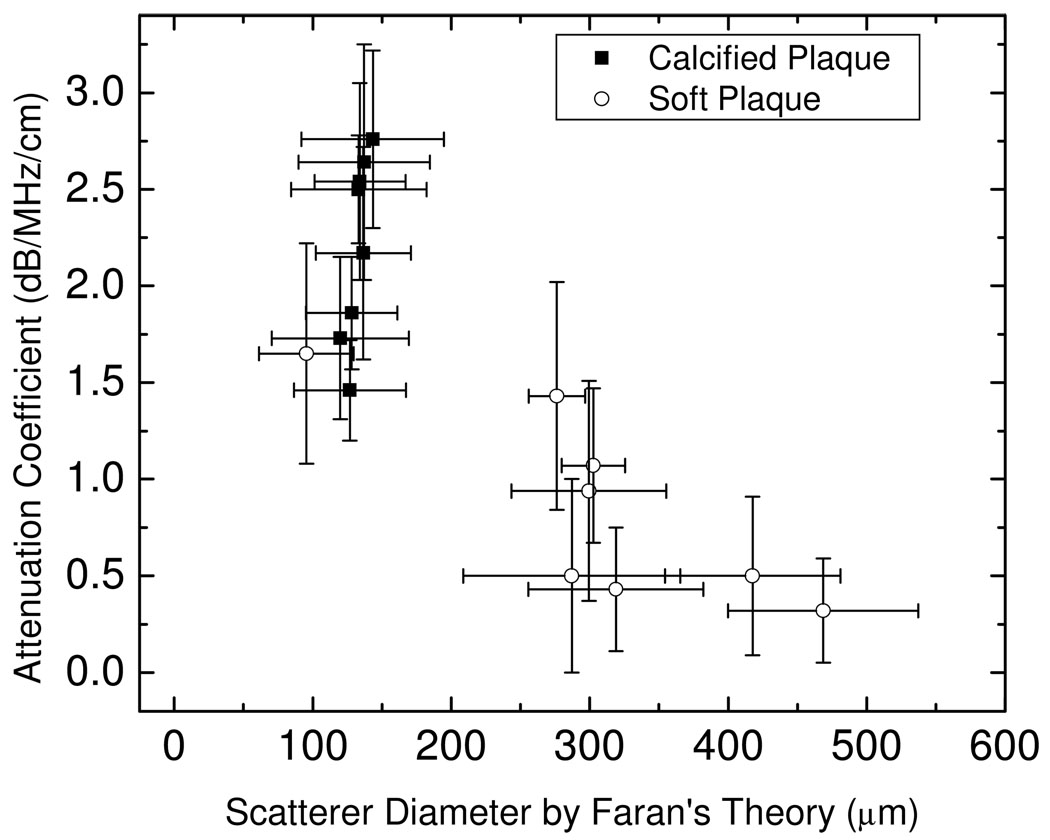
Figure 6 presents a plot of the attenuation coefficient versus the equivalent scatterer size estimated using Faran’s scattering theory for the same ROI. Note that the attenuation coefficient and equivalent scattering size parameter for soft and calcified plaques are clustered in different regions, indicating that a combination of the attenuation and scatterer size can be utilized as a tool to distinguish soft from calcified plaque. This result is also corroborated by our ex-vivo results [25] which indicate similar clustering of the equivalent scatterer size and attenuation coefficient computed over the same ROI.
Figure 6.
Attenuation coefficient estimates plotted versus the equivalent scatterer size parameter obtained using Faran’s scattering theory.
Receiver Operating Characteristic Analysis
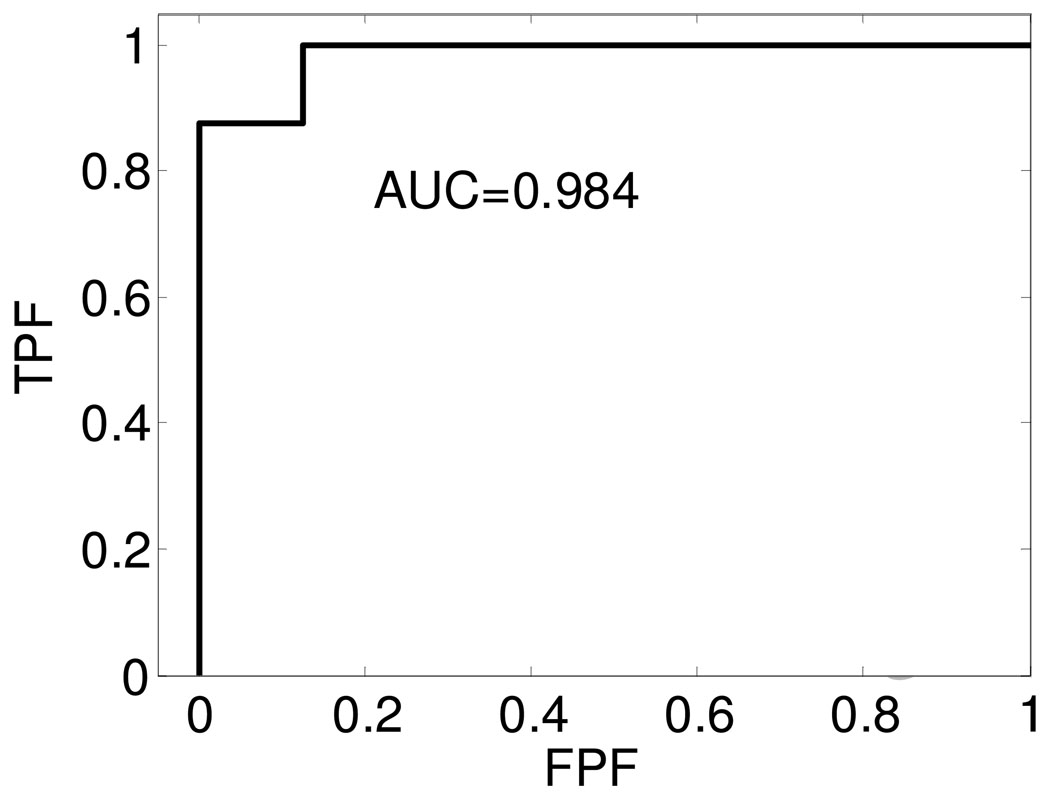
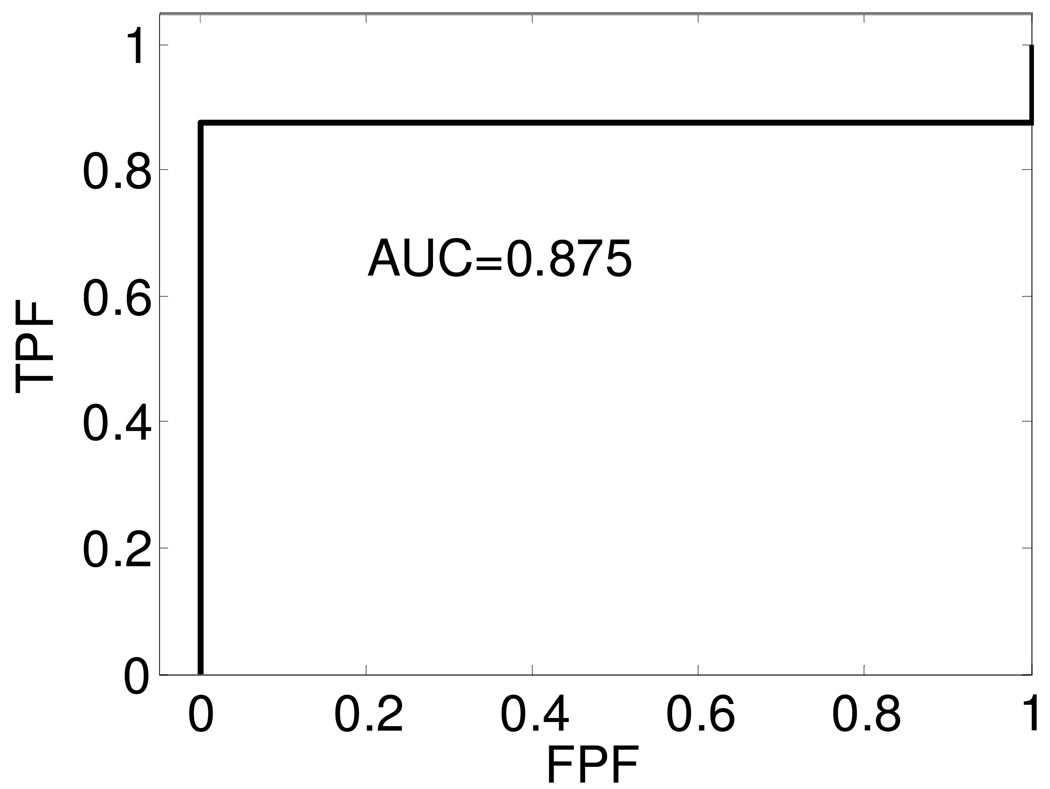
Receiver operating characteristic (ROC) analysis is utilized to evaluate the ability of these UTC parameters to classify different plaque types. We rely on the radiologist’s reading of soft and calcified plaque as the standard to divide our sample pool into these 2 categories. We have arbitrarily chosen calcified plaque as the True category, and soft plaque as the False category. ROC analysis for the attenuation coefficient parameter involves the following steps: We utilize the attenuation coefficient parameter β calculated from the in-vivo data set. The parameter β’ is varied as the decision-making threshold value, where we make a decision that the sample with parameter β > β’ are Positive, while samples with parameter β < β’ are Negative. We then compare our test conclusion with the standard, to obtain a true positive fraction (TPF) which is the ratio of sample number in the True category that also tested as positive versus the total number in the True category. The false positive fraction (FPF) is the ratio of sample number in False category that tested as positive versus the total number in the False category. Obviously TPF and FPF are functions of the threshold value β’. A plot of the TPF vs. FPF is referred to as the ROC curve. The area under the curve (AUC) is a non-parametric value that describes the performance of the test. Higher values of the AUC indicate that the test has an improved ability to delineate or differentiate between the two categories‥In a similar manner, we also calculate ROC curves for the equivalent scatterer size parameter. Figure 7 and Figure 8 show the ROC curves for the attenuation coefficient and equivalent scattering size parameter obtained using Faran’s theory.
Figure 7.
ROC curves obtained using the attenuation coefficient estimated in-vivo to differentiate between soft and calcified plaque.
Figure 8.
ROC curves for the equivalent scatterer size obtained using Faran’s scattering theory from the in-vivo data sets used to differentiate between soft and calcified plaque.
The AUC values obtained from the ROC curves in Figure 7 and Figure 8 are 0.984 and 0.875 respectively. From the AUC values, we conclude that both these UTC parameters are good candidates for the separation of soft from calcified plaque tissue. The results also indicate that the attenuation coefficient is a better indicator of calcified plaque when compared to the equivalent scattering size parameter. Since only a limited number of samples are included in this study, the ROC curves and AUC values obtained are very preliminary results. With additional samples, the ROC curves and AUC values would provide useful indicators of the ability of these parameters to predict plaque type.
Discussion
In this paper, we perform an in-vivo carotid artery plaque characterization using a conventional clinical diagnostic ultrasound imaging system. In-vivo characterization of carotid plaque is difficult since the artery and plaque are embedded within tissue layers. Tissue background between the ultrasound transducer and carotid plaque contain skin, fat, muscle tissue, artery wall, and blood. Ultrasound beam refraction and reflection are factors that also complicate power spectral analysis of plaque tissue. In addition, patient motion and respiratory artifacts introduce additional errors.
In-vivo UTC analysis demonstrates that the attenuation and equivalent scatterer size parameter are significantly different in soft and calcified plaques. For calcified plaques, the attenuation coefficient is usually higher, and the equivalent scattering size parameter is smaller. This conclusion is similar to that obtained in our ex-vivo analysis. Plots of attenuation coefficient versus the equivalent scattering parameter estimated using Faran’s scattering theory reveal the clustering of calcified and soft plaque. This clustering illustrates that this method can be utilized to distinguish calcified plaque and soft plaque under in-vivo imaging conditions.
In this preliminary in-vivo study, we utilize ROC curves to analyze the performance of UTC parameters, i.e. attenuation coefficient, and equivalent scattering size parameter. However, due to the limited sample number, the ROC curves obtained have a discrete zigzag shape. The area under the ROC curves for the attenuation coefficient parameter was 0.984 and 0.875 for the equivalent scatterer size parameter respectively. These values are quite high and indicate that these UTC parameters are excellent candidates for the characterization and differentiation of atherosclerotic plaque.
We have also presented equivalent scatterer size and attenuation coefficient results estimated on ex-vivo plaque tissue[25]. In comparison to the in-vivo results presented in this paper, the attenuation coefficient slopes estimated ex-vivo was higher. However, our ex-vivo results obtained were consistent with the ex-vivo results reported by Bridal et al [21]. There are several reasons for the possible discrepancy between the ex-vivo and in-vivo results. In the in-vivo case, the plaque grow attached to the vessel wall for years, and the interfaces between the plaque and vessel wall would be significantly different from that measured under ex-vivo conditions. In addition as the plaque is excised from the vessel wall, some of these interfaces can get damaged. The excised tissue is also imaged about 1–2 hours following surgery, which may also have an impact on the UTC parameters estimated.
The equivalent scatterer size for calcified plaques indicate an interesting clustering phenomenon, in the range of 100µm~150µm, while the scatterer size for soft plaques is spread out in a larger range. In ultrasound B-mode images, calcified plaques can be clearly identified, while other plaque tissue with complex structure and components may have been identified as soft plaques. In addition, plaque tissue is significantly inhomogenous, and the soft plaque could contain lipid crystals, fibrous tissue, hemorrhagic material, cell debris, etc, therefore the scattering properties could vary. In the previous ex-vivo paper [25], the attenuation coefficient slope vs. scatterer size plot exhibits a similar trend. The larger number of ROI in the ex-vivo paper would also impact the distribution of the equivalent scatterer size and the attenuation coefficient slope presented.
Conclusion
The preliminary in-vivo results presented in this paper indicate that the attenuation coefficient and equivalent scatterer size parameter estimated using Faran’s theory present a good combination of UTC parameters for the differentiation between soft and calcified plaques. Softer plaques, especially lipid rich with a thin fibrous cap are more likely to be unstable when compared to calcified plaques. It is therefore of interest to detect softer plaques prior to its development as a hemodynamically significant lesion in the artery. The UTC parameters described in this paper have the potential to be utilized as a screening technique for the detection and differentiation of softer from calcified plaques.
Acknowledgements
We are grateful to Professors James A. Zagzebski and Timothy Hall for insightful conversations regarding acoustic scattering physics and modeling of soft tissues. This work is supported in part by start-up funds from the University of Wisconsin-Madison Medical School and Graduate School and NIH grant R21 EB003853. Mr. McCormick is supported by NIH training Grant T90DK070079 and R90DK071515 from the National Institute of Diabetes And Digestive And Kidney Diseases.
Footnotes
Publisher's Disclaimer: This is a PDF file of an unedited manuscript that has been accepted for publication. As a service to our customers we are providing this early version of the manuscript. The manuscript will undergo copyediting, typesetting, and review of the resulting proof before it is published in its final citable form. Please note that during the production process errors may be discovered which could affect the content, and all legal disclaimers that apply to the journal pertain.
References
- 1.Nasu K, Tsuchikane E, Katoh O, Vince DG, Virmani R, Surmely JF, Murata A, Takeda Y, Ito T, Ehara M, Matsubara T, Terashima M, Suzuki T. Accuracy of in vivo coronary plaque morphology assessment: a validation study of in vivo virtual histology compared with in vitro histopathology. J Am Coll Cardiol. 2006;vol. 47:2405–2412. doi: 10.1016/j.jacc.2006.02.044. [DOI] [PubMed] [Google Scholar]
- 2.Rodriguez-Granillo GA, Vaina S, García-García HM, Valgimigli M, Duckers E, van Geuns RJ, Regar E, van der Giessen WJ, Bressers M, Goedhart D, Morel MA, de Feyter PJ, Serruys PW. Reproducibility of intravascular ultrasound radiofrequency data analysis: implications for the design of longitudinal studies. Int J Cardiovasc Imaging. 2006;vol. 22:621–631. doi: 10.1007/s10554-006-9080-0. [DOI] [PubMed] [Google Scholar]
- 3.Sano K, Kawasaki M, Okubo M, Yokoyama H, Ito Y, Murata I, Kawai T, Tsuchiya K, Nishigaki K, Takemura G, Minatoguchi S, Zhou X, Fujita H, Fujiwara H. In vivo quantitative tissue characterization of angiographically normal coronary lesions and the relation with risk factors: a study using integrated backscatter intravascular ultrasound. Circ J. 2005;vol. 69:543–549. doi: 10.1253/circj.69.543. [DOI] [PubMed] [Google Scholar]
- 4.Nair A, Kuban BD, Tuzcu EM, Schoenhagen P, Nissen SE, Vince DG. Coronary plaque classification with intravascular ultrasound radiofrequency data analysis. Circulation. 2002;vol. 106:2200–2206. doi: 10.1161/01.cir.0000035654.18341.5e. [DOI] [PubMed] [Google Scholar]
- 5.de Korte CL, van der Steen AF, Cespedes EI, Pasterkamp G, Carlier SG, Mastik F, Schoneveld AH, Serruys PW, Bom N. Characterization of plaque components and vulnerability with intravascular ultrasound elastography. Phys Med Biol. 2000 Jun;vol. 45:1465–1475. doi: 10.1088/0031-9155/45/6/305. [DOI] [PubMed] [Google Scholar]
- 6.Leung KYE, Baldewsing RA, Mastik F, Schaar JA, Gisolf A, van der Steen AFW. Motion compensation for intravascular ultrasound palpography. Ultrasonics, Ferroelectrics and Frequency Control, IEEE Transactions on. 2006;vol. 53:1269–1280. doi: 10.1109/tuffc.2006.1665075. [DOI] [PubMed] [Google Scholar]
- 7.Wilson LS, Neale ML, Talhami HE, Appleberg M. Preliminary results from attenuation-slope mapping of plaque using intravascular ultrasound. Ultrasound Med Biol. 1994;vol. 20:529–542. doi: 10.1016/0301-5629(94)90089-2. [DOI] [PubMed] [Google Scholar]
- 8.Nair A, Klingensmith JD, Vince DG. Real-time plaque characterization and visualization with spectral analysis of intravascular ultrasound data. Stud Health Technol Inform. 2005;vol. 113:300–320. [PubMed] [Google Scholar]
- 9.Huisman HJ, Thijssen JM, Wagener DJ, Rosenbusch GJ. Quantitative ultrasonic analysis of liver metastases. Ultrasound Med Biol. 1998;vol. 24:67–77. doi: 10.1016/s0301-5629(97)00211-1. [DOI] [PubMed] [Google Scholar]
- 10.Boote EJ, Zagzebski JA, Madsen EL. Backscatter coefficient imaging using a clinical scanner. Med Phys. 1992;vol. 19:1145–1152. doi: 10.1118/1.596789. [DOI] [PubMed] [Google Scholar]
- 11.Tuthill TA, Baggs RB, Parker KJ. Liver glycogen and water storage: effect on ultrasound attenuation. Ultrasound Med Biol. 1989;vol. 15:621–627. doi: 10.1016/0301-5629(89)90170-1. [DOI] [PubMed] [Google Scholar]
- 12.Anderson ME, Soo MS, Trahey GE. In vivo breast tissue backscatter measurements with 7.5- and 10-MHz transducers. Ultrasound Med Biol. 2001;vol. 27:75–81. doi: 10.1016/s0301-5629(00)00310-0. [DOI] [PubMed] [Google Scholar]
- 13.Kovacs A, Courtois MR, Weinheimer CJ, Posdamer SH, Wallace KD, Holland MR, Miller JG. Ultrasonic tissue characterization of the mouse myocardium: successful in vivo cyclic variation measurements. J Am Soc Echocardiogr. 2004;vol. 17:883–892. doi: 10.1016/j.echo.2004.04.035. [DOI] [PubMed] [Google Scholar]
- 14.Mohr G, A, Vered Z, Barzilai B, Perez J, E, Sobel B, E, Miller G. Automated determination of the magnitude and time delay ("phase") of the cardiac cycle dependent variation of myocardial ultrasonic integrated backscatter. Ultrason Imaging. 1989;vol. 11:245–259. doi: 10.1177/016173468901100403. [DOI] [PubMed] [Google Scholar]
- 15.Masuyama T, St Goar FG, Tye TL, Oppenheim G, Schnittger I, Popp RL. Ultrasonic tissue characterization of human hypertrophied hearts in vivo with cardiac cycle-dependent variation in integrated backscatter. Circulation. 1989;vol. 80:925–934. doi: 10.1161/01.cir.80.4.925. [DOI] [PubMed] [Google Scholar]
- 16.Baldwin SL, Yang M, Marutyan KR, Wallace KD, Holland MR, Miller JG. Ultrasonic detection of the anisotropy of protein cross linking in myocardium at diagnostic frequencies. IEEE Trans Ultrason Ferroelectr Freq Control. 2007;vol. 54:1360–1369. doi: 10.1109/tuffc.2007.396. [DOI] [PubMed] [Google Scholar]
- 17.Maurice RL, Fromageau J, Brusseau E, Finet G, Rioufol G, Cloutier G. On the potential of the lagrangian estimator for endovascular ultrasound elastography: in vivo human coronary artery study. Ultrasound Med Biol. 2007;vol. 33:1199–1205. doi: 10.1016/j.ultrasmedbio.2007.01.018. [DOI] [PubMed] [Google Scholar]
- 18.Urbani MP, Picano E, Parenti G, Mazzarisi A, Fiori L, Paterni M, Pelosi G, L L. In vivo radiofrequency-based ultrasonic tissue characterization of the atherosclerotic plaque. Stroke. 1993;vol. 24:1507–1512. doi: 10.1161/01.str.24.10.1507. [DOI] [PubMed] [Google Scholar]
- 19.Shi H. Medical Physics. Madison: University of Wisconsin-Madison; 2007. Atherosclerotic Carotid Plaque Characterization using Ultrasound and Elastography. [Google Scholar]
- 20.Shi H, Varghese T. Two-Dimensional Multi-level Strain Estimation for Discontinuous Tissue. Phys Med Biol. 2007;vol. 52:389–401. doi: 10.1088/0031-9155/52/2/006. [DOI] [PubMed] [Google Scholar]
- 21.Bridal SL, Beyssen B, Fornes P, Julia P, Berger G. Multiparametric attenuation and backscatter images for characterization of carotid plaque. Ultrason Imaging. 2000;vol. 22:20–34. doi: 10.1177/016173460002200102. [DOI] [PubMed] [Google Scholar]
- 22.Gronholdt ML, Wagner A, Wiebe BM, Hansen JU, Schroeder TV, Wilhjelm JE, Nowak M, Sillesen H. Spiral computed tomographic imaging related to computerized ultrasonographic images of carotid plaque morphology and histology. J Ultrasound Med. 2001 May;vol. 20:451–458. doi: 10.7863/jum.2001.20.5.451. [DOI] [PubMed] [Google Scholar]
- 23.Waki H, Masuyama T, Mori H, Maeda T, Kitade K, Moriyasu K, Tsujimoto M, Fujimoto K, Koshimae N, Matsuura N. Ultrasonic tissue characterization of the atherosclerotic carotid artery: histological correlates or carotid integrated backscatter. Circ J. 2003;vol. 67:1013–1016. doi: 10.1253/circj.67.1013. [DOI] [PubMed] [Google Scholar]
- 24.Waters KR, Bridal SL, Cohen-Bacrie C, Levrier C, Fornes P, Laugier P. Parametric analysis of carotid plaque using a clinical ultrasound imaging system. Ultrasound Med Biol. 2003 Nov;vol. 29:1521–1530. doi: 10.1016/j.ultrasmedbio.2003.08.007. [DOI] [PubMed] [Google Scholar]
- 25.Shi H, Varghese T, Dempsey R, Salamat MS, Zagzebski JA. Relationship between ultrasonic attenuation, size and axial strain parameters for ex-vivo atherosclerotic carotid plaque. Ultrason Med Biol. 2008;vol. 33:1666–1677. doi: 10.1016/j.ultrasmedbio.2008.02.014. [DOI] [PMC free article] [PubMed] [Google Scholar]
- 26.Shi H, Tu H, Dempsey R, Varghese T. Ultrasonic Attenuation Estimation in Small Plaque Samples Using a Power Difference Method. Ultrasonic Imaging. 2007;vol. 29:15–30. doi: 10.1177/016173460702900102. [DOI] [PubMed] [Google Scholar]
- 27.Kawasaki M, Takatsu H, Noda T, Ito Y, Kunishima A, Arai M, Nishigaki K, Takemura G, Morita N, Minatoguchi S, Fujiwara H. Noninvasive quantitative tissue characterization and two-dimensional color-coded map of human atherosclerotic lesions using ultrasound integrated backscatter: comparison between histology and integrated backscatter images. J Am Coll Cardiol. 2001;vol. 38:486–492. doi: 10.1016/s0735-1097(01)01393-6. [DOI] [PubMed] [Google Scholar]
- 28.Noritomi T, Sigel B, Swami V, Justin J, Gahtan V, Chen X, Feleppa EJ, Roberts AB, Shirouzu K. Carotid plaque typing by multiple-parameter ultrasonic tissue characterization. Ultrasound Med Biol. 1997;vol. 23:643–650. doi: 10.1016/s0301-5629(97)00013-6. [DOI] [PubMed] [Google Scholar]
- 29.Tureyen K, Vemuganti R, Salamat MS, Dempsey RJ. Increased angiogenesis and angiogeneic gene expression in carotid artery plaques from symptomatic stroke patients. Neurosurgery. 2006;vol. 58:971–977. doi: 10.1227/01.NEU.0000210246.61817.FE. [DOI] [PubMed] [Google Scholar]
- 30.Davies MJ, Richardson PD, Woolf N, Katz DR, Mann J. Risk of thrombosis in human atherosclerotic plaques: role of extracellular lipid, macrophage, and smooth muscle cell content. Br Heart J. 1993 May;vol. 69:377–381. doi: 10.1136/hrt.69.5.377. [DOI] [PMC free article] [PubMed] [Google Scholar]
- 31.Feinstein SB. Contrast ultrasound imaging of the carotid artery vasa vasorum and atherosclerotic plaque neovascularization. J Am Coll Cardiol. 2006;vol. 48:236–243. doi: 10.1016/j.jacc.2006.02.068. [DOI] [PubMed] [Google Scholar]
- 32.Wolf RL, Wehrli SL, Popescu AM, Woo JH, Song HK, Wright AC, Mohler ER, III, Harding JD, Zager EL, Fairman RM, Golden MA, Velazquez OC, Carpenter JP, Wehrli FW. Mineral Volume and Morphology in Carotid Plaque Specimens Using High-Resolution MRI and CT. ArteriosclerosisThromb Vas Biol. 2005;vol. 25:1729–1735. doi: 10.1161/01.ATV.0000173311.39867.65. [DOI] [PMC free article] [PubMed] [Google Scholar]


