Abstract
For the first time, a rapid, sensitive and simple liquid chromatography/tandem mass spectrometry (LC-MS/MS) method using an atmospheric pressure chemical ionization source (APCI) for the quantification of PD168393 in rat serum was developed and validated. Serum samples were pretreated with methanol for protein precipitation. The chromatographic separation was performed on a Jupiter-C5 column (250 × 2.0 mm i.d) pre-equilibrated with 0.1% formic acid. The tandem mass spectrometer was tuned in the multiple reaction monitoring mode to monitor the m/z transitions 369/313 for PD168393 and m/z 343/308 for the internal standard triazolam, using positive ion mode. The MS/MS response was linear over the concentration range from 2–5,000 ng/mL, with a lower limit of quantification (LLQ) of 2 ng/mL. At the lowest quality control (4 ng/mL), the intra- and inter-day precisions (CV%) for PD168393 were less than 10% and the accuracies were between 92–111 %. The validated method can be used in most or all stages of the screening and optimizing process for future method validation of pharmacokinetic studies.
Keywords: LC-MS/MS, PD168393, quantification, serum
INTRODUCTION
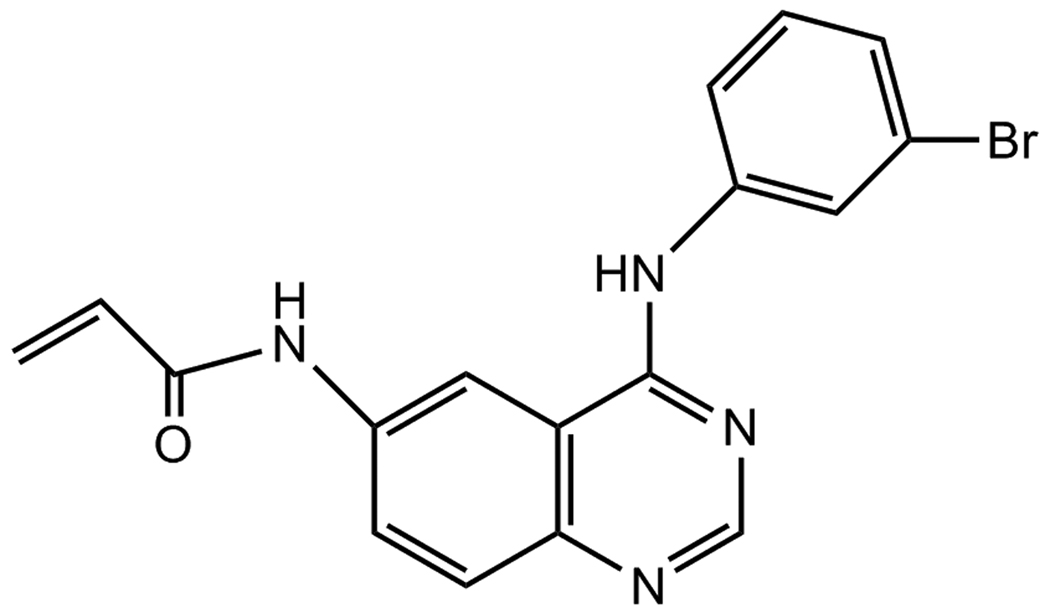
The epidermal growth factor receptor (EGFR) signaling pathway is one of the most important pathways regulating growth, survival, proliferation, and differentiation in mammalian cells and it is one of the therapeutic targets for anti-tumor strategies. Over expression of EGFR and related erbB membrane tyrosine kinases (erbB2, erbB3 and erbB4) has been reported in a significant number of human tumors and is associated with poor prognosis [1,2]. PD168393 (4-[(3-Bromophenyl) amino]-6-acrylamidoquinazoline) (Fig. 1) is a specific and irreversible inhibitor of the EGFR, erbB2 and erbB4 [3,4]. PD168393 acts by covalently modifying cysteine-733, an amino acid located in the catalytic domain of the ATP binding pocket. Recently, novel therapeutic approaches targeting the EGFR super family and their downstream pathways have been generated and PD168383 has attracted much attention as a cancer chemotherapeutic agent [5,6]. In particular, therapeutic regimens combining EGFR inhibitors with conventional chemotherapy have been tested in vitro and in animal models and found to show significant improvements in anti-tumor effects [7,8]. The irreversible nature of PD168393 may offer a potential advantage for target suppression and in vivo pharmacokinetics. However, detailed information about its pharmacokinetics and biodistribution are currently unavailable.
Fig. 1.
Chemical structure of PD168393.
In order to investigate the pharmacokinetic properties of this compound, a simple and validated method for assaying PD168393 in biological fluids such as plasma assay is required. However, there have been no previous reports describing the quantitative analysis of PD168393 in biological matrices. The aim of this study was therefore to develop a sensitive, selective and high-throughput method for estimating PD168393 levels in blood serum. As a part of our ongoing research in this area, we have developed a selective and accurate LC–MS/MS assay for this drug in rat serum.
EXPERIMENTAL
Chemicals and reagents
All solvents and chemicals were of HPLC or analytical grade, and used without purification. Methanol, acetonitrile, dimethyl sulfoxide, formic acid and acetic acid were from Fisher Scientific (Fair Lawn, NJ, USA). PD168393 was purchased from Calbiochem (La Jolla, CA). Triazolam [8-chloro-6-(2-chlorophenyl)-1-methyl-4H-1,2,4-triazolo-(4,3-a) -1,4-benzodiazepine] was kindly provided by Dr. Michael Froelich (Dept. of Anesthesiology, University of Alabama at Birmingham). Rat serum was obtained from Pel-Freez Biologicals (Rogers, AR).
Liquid chromatography-mass spectrometry
LC-MS/MS analyses of rat serum samples were performed using a system consisting of a Prominence model refrigerated Shimadzu auto sampler (Shimadzu Scientific Instruments, Inc. Columbia, MD), and an API 4000 (Applied Biosystems/MDS Sciex, Concord, Ontario, Canada). Chromatography was performed using a Jupiter 5 micron C5 column (250 × 2.0 mm i.d, Phenomenex, CA) pre-equilibrated with 0.1% formic acid. The mobile phase consists of 0.1% formic acid [A] and acetonitrile containing 0.1% formic acid [B] and was pumped at a flow rate of 0.4 mL/min. The gradient started with 30% B and went up to 100% B over first 3 min and returned back to 30% B at 3.5 min. Multiple Reaction Monitoring (MRM) was used to perform mass spectrometric quantification of PD168393. The column effluent was introduced into the mass spectrometer using APCI in the positive ion mode. Nitrogen was used as nebulizer, gas 1 and curtain gas. The MRM analysis was conducted by monitoring the precursor ion to product ion transitions from m/z 369/313 (PD168393) and m/z 343/308 (triazolam). The LC-MS/MS system was controlled by BioAnalyst 1.4.2 software. The MS/MS operating parameters used in this study are listed in Table 1.
Table 1.
MS/MS parameters optimized for PD168393
| Parameter | Setting |
|---|---|
| CUR | 10 |
| GS1 | 30 |
| NC | 3 |
| TEM | 250 |
| CAD | 12 |
| EP | 10 |
| PD168393 (Q1 = 369, Q3 = 313) | |
| Dwell time | 50 msec |
| DP | 120 |
| CE | 50 |
| CXP | 11 |
| Triazolam (Q1 = 343, Q3 = 308) | |
| Dwell time | 50 msec |
| DP | 56 |
| CE | 41 |
| CXP | 40 |
Standard solution and sample preparation
PD168393 stock solution was prepared in DMSO at a concentration of 1.0 mg/mL. Standard working solutions (12– 30,000 ng/mL) containing Triazolam (internal standard, 600 ng/mL) were prepared by appropriate dilution with 80% methanol in water. Methanol containing 0.1% acetic acid was used for protein precipitation. For calibration standards and quality control (QC) samples, 50 µL of a standard solution was added to 50 µL of blank plasma. Then each of these plasma samples was diluted by adding 200 µL of methanol containing 0.1% acetic acid, vortex-mixed and centrifuged for 10 min at 3,000 × g to precipitate proteins. The supernatant solutions were directly transferred to HPLC auto samplers and 10 µL injected into the mass spectrometer to analyze the samples.
Validation study
The analytical method was validated to demonstrate the specificity, recovery, lower limit of quantification, accuracy, and precision of measurements [9–11]. Specificity was established by the lack of interference peaks at the retention time for the internal standard and PD168393. Linearity was tested at 6 levels of concentrations covering a range of 2–5000 ng/ml. The calibration curves were established by plotting the peak area ratio of PD168393 to the internal standard (triazolam), versus PD168393 concentration in the calibration samples. The regression parameters of slope, intercept and correlation coefficient were calculated by linear least-square regression (1/x2 weighting).
The recovery of the method was determined by comparing the peak area obtained from the serum samples spiked prior to extraction with the peak area obtained from that of spiked post-extraction plasma samples.
The accuracy and precision (presented as %CV) of this analytical method were determined using QC samples (n =5) in 5 replicates of 4, 5, 20, 500, 2000 ng/mL of PD168393 in rat serum. Accuracy was determined by comparing the calculated concentration using calibration curves to known concentration. The LOQ was defined as precision and accuracy within 15%. The LLQ was defined as the smallest amount of the analyte that could be measured in a sample with sufficient precision and accuracy (within 20% for both parameters) and was chosen as the lowest concentration on the calibration curve.
The stability of PD168393 in serum was examined at 4 °C over 72 h. The bench-top stability was evaluated at ambient temperature (~23 °C) over 24 h using QC samples in five replicates. The storage stability at −20 °C for over 30 days was also evaluated. The freeze/thaw stability was determined after three freeze/thaw cycles (room temperature to −20 °C) To evaluate the matrix effects, blank plasma samples were processed according to the protein precipitation described above and then spiked with PD168393 and IS at the final concentration after extraction. The absolute matrix effects of the plasma were expressed as the ratio of the mean peak area of analyte spiked post extraction to that of the neat standard solution with 80% methanol in water at corresponding concentrations. Three different concentration levels of analytes were evaluated by analyzing five samples at each level.
RESULTS AND DISCUSSION
LC-MS/MS
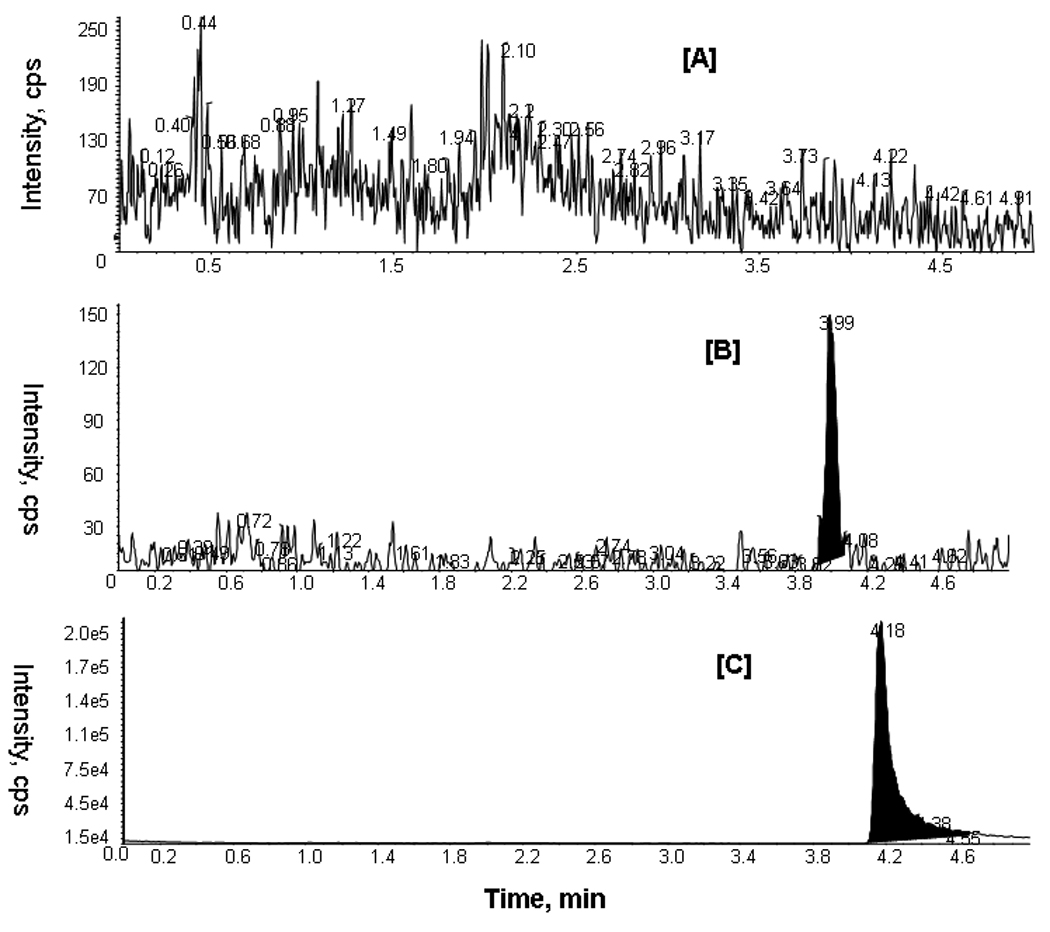
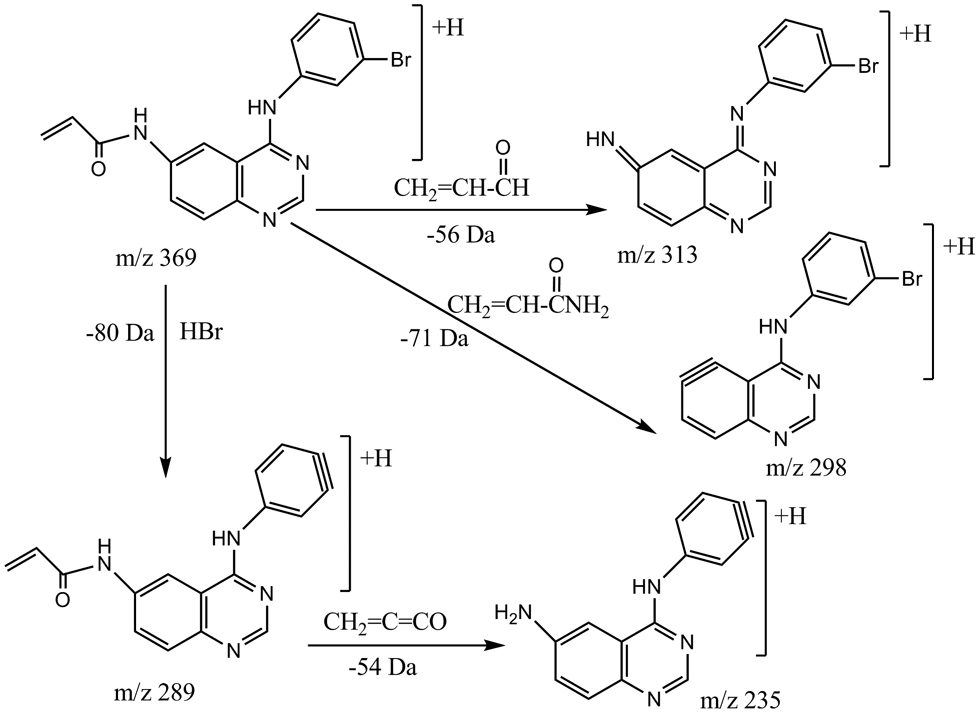
Due to the presence of secondary and tertiary amines in PD168393, the positive ion mode provided the best sensitivity. Protonated molecular ions of PD168393 showed m/z 369 [M+H]+ and 371 [M+H+2]+ owing to the presence of bromine in the molecule. The [M+H]+ m/z 369 ion generated product ions upon collision-induced dissociation and the product ion spectrum of PD168393 is shown in Fig. 2. The most abundant product ions were found at m/z 313 and 235, respectively, and the ion m/z 313 was chosen for PD168393 quantification in serum by MRM in the present assay. An initial loss of HBr (80 Da) from m/z 369 give rise to the product ion m/z 289 which subsequently eliminates a neutral molecule of methylene ketene (54 Da), yielding the ion m/z 235. The product ion m/z 313 can be formed by a neutral loss of 56 Da from the precursor ion m/z 369 upon CID fragmentation. The proposed structures of the major ions are depicted in Fig. 3. Thus far, no method has been described for the determination of PD168393 levels in biological matrices using LC-MS/MS. Several columns were tested as were several solvents as possible eluents to obtain a high degree of sensitivity, good separation and a short analysis time. Chromatographic conditions were optimized to provide short retention times and adequate peak shape. A Jupiter-C5 column (250 × 2.0 mm i.d) pre-equilibrated with 0.1% formic acid provided very good sensitivity and peak shape for PD168393 and triazolam (Fig. 4). Given that protein precipitation was the extraction method for PD168393, we decided to use APCI to avoid possible ion suppression effects [12]. APCI-MS/MS optimization involved several parameters including curtain gas (CUR), collision gas (CAD) and nebulizer current (NC) adjustment as shown in Table 1.
Fig. 2.

Product ion mass spectrum of PD168393 [M+H]+ ion m/z 369.
Fig. 3.
Proposed fragmentation mechanism and possible structures of product ions observed in MS/MS experiment of the ion at m/z 369.
Fig. 4.

Representative MRM chromatograms of blank serum [A]; serum spiked with PD168393 (2 ng/mL) [B] and internal standard triazolam 100 ng/mL [C]. Mass transitions were monitored at m/z 369/313 for PD168393 and m/z 343/308 for IS.
Internal standard
As labeled and/or deuterated internal standards for PD168393 are unavailable, triazolam was used as an internal standard. This compound appeared to be a suitable internal standard as it ionized in the positive mode, and it eluted just after the analyte (Fig. 4C) with acceptable chromatographic properties and recoveries.
Method validation
The methods were validated in accordance with the FDA guidance for bioanalytical method validation and also based on the paper of Shah et al. [9–11] A full validation was performed for rat serum based on the following criteria.
Linearity
The assay was linear over a range of 2–5000 ng/mL in rat serum with a correlation coefficient of 0.996. Table 2 shows the summary of the individual standard data obtained in the five replicates. The lower limit of quantification (LLQ) showed an accuracy and precision of 100.46 and 7.93%, respectively. At all concentration levels, precisions and accuracies ranged from 2.35 to 9.14% and 88.86 to 110.20%, respectively. These results indicated good linear relationship between the peak area and concentration.
Table 2.
Summary of calibration curves (n =5)
| Nominal concentration (ng/mL) |
Measured mean concentration (ng/mL) ± S.D |
CV(%) | Mean accuracy (%) |
|---|---|---|---|
| 2.0 | 2.01 ± 0.16 | 7.93 | 100.46 |
| 50 | 44.44 ± 4.00 | 9.14 | 88.86 |
| 100 | 97.60 ± 6.68 | 6.84 | 97.60 |
| 200 | 204.40 ± 13.87 | 6.80 | 101.88 |
| 1000 | 1102 ± 25.88 | 2.35 | 110.20 |
| 5000 | 4950 ± 211.07 | 4.26 | 99.10 |
Accuracy and precision
The accuracy and precision of this assay for PD168393 were determined at various concentrations (4, 5, 20, 500 and 2000 ng/mL) of QC samples. Table 3 shows a summary of intra-day and inter-day accuracy and precision for measurement of PD168393 levels in rat serum. The accuracy and precision ranged from 87.76 to 110.88% and 1.82 to 8.69%, respectively, throughout the five concentrations. LLQ was 2.0 ng/ml, demonstrating the intra-day CV% and accuracy 7.93 and 100.46%, respectively (Table 2).
Table 3.
Precision and accuracy of quality control samples
| Nominal concentration (ng/mL) |
Measured mean concentration (ng/mL) ± S.D |
CV(%) | Mean accuracy (%) |
|---|---|---|---|
| Day 1 | |||
| 4 | 3.74 ± 0.21 | 5.74 | 93.54 |
| 5 | 4.76 ± 0.20 | 4.26 | 95.12 |
| 20 | 19.44 ± 1.36 | 6.98 | 97.14 |
| 500 | 544 ± 13.74 | 2.52 | 109.00 |
| 2000 | 2192 ± 170.06 | 7.76 | 109.18 |
| Day 2 | |||
| 4 | 3.68 ± 0.07 | 1.82 | 92.16 |
| 5 | 4.39 ± 0.13 | 2.88 | 87.76 |
| 20 | 15.84 ± 0.56 | 3.64 | 79.18 |
| 500 | 552.40 ± 38.86 | 7.04 | 110.4 |
| 2000 | 2122 ± 116.06 | 5.47 | 106.12 |
| Day 3 | |||
| 4 | 4.44 ± 0.39 | 8.69 | 110.88 |
| 5 | 4.91 ± 0.25 | 5.01 | 98.14 |
| 20 | 19.04 ± 1.53 | 8.06 | 95.26 |
| 500 | 429.40 ± 20.98 | 4.89 | 85.86 |
| 2000 | 1758 ± 117.13 | 6.66 | 87.92 |
| Inter-day (n= 15) | |||
| 4 | 3.95 ± 0.22 | 5.65 | 98.83 |
| 5 | 4.69 ± 0.19 | 4.13 | 93.73 |
| 20 | 18.11 ± 1.15 | 6.35 | 90.53 |
| 500 | 508.60 ± 24.53 | 4.82 | 101.72 |
| 2000 | 2024 ± 134.40 | 6.64 | 101.20 |
At the lowest quality control (4 ng/mL), the intra- and inter-day precisions (CV%) for PD168393 were less than 10% and the accuracies were between 92–111% (Table 3).
Specificity and selectivity
Representative MRM chromatograms of extracted blank serum and blank serum spiked with PD168393 (2 ng/mL) and IS are shown in Fig. 4. The LC-MS/MS method demonstrated high specificity because only ions derived from PD168393 and IS were monitored. It is clear that substances endogenous to serum did not interfere in the analysis.
Carry over
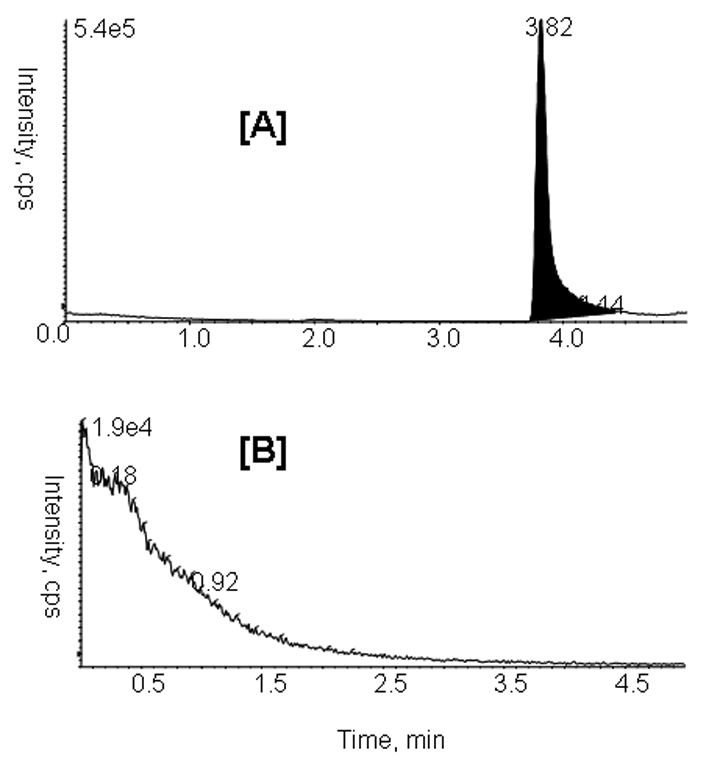
Carry-over is one of the most commonly encountered problems of LC/MS/MS method development. As can be seen in Fig. 5, when methanol blank was injected right after the highest level of PD168393 spiked serum sample (5000 ng/mL), no detectable carry over was observed on the column.
Fig. 5.

Representative MRM chromatograms for PD168393 (m/z 369/313) in rat serum: [A] PD168393 (5000 ng/mL); [B] 10 µL methanol blank.
Ion suppression (matrix effect) and recovery
The adverse consequences of matrix effects on the results of quantitative HPLC-MS/MS analyses have been fully recognized and the assessment of matrix effects is becoming an integral part of method development and validation [13,14]. At 5, 500 and 5000 ng/mL concentration levels, the mean ion suppression of PD168393 in rat serum were 104.6, 99.89 and 94.26%, respectively. If the peak area ratio is less than 85% or more than 115%, a matrix effect is implied. Thus, there were no co-eluting matrix components of serum after protein precipitation.
Recovery studies of PD168393 were performed at concentrations of 500 and 5000 ng/mL. Mean extraction recoveries at these concentrations after protein precipitation were 91.08 ± 9.88 and 90.37 ± 8.82%, respectively. The mean recovery of internal standard was 90.75 ± 8.30%. These results indicated that the extraction efficiency of PD168393 using protein precipitation was sufficient and was not concentration dependent.
Stability
The stability of PD168393 was investigated thoroughly to evaluate its stability in serum samples under different conditions (freeze/thaw, bench-top, autosampler and long term storage stability). Table 4 summarizes the stability data. The results obtained were well within the acceptable limits. At 4 °C PD168393 showed no degradation over a 72 h period. PD168393 spiked serum samples were stable at room temperature for 24 h. The results of long-term stability study indicated that the spiked samples were stable at −20 °C over 30 days. The precision for freeze/thaw samples ranged from 3.45 to 4.69% and the accuracy ranged from 91.96 to 108.75%, indicating the analyte’s stability in serum for three cycles when stored at −20 °C and thawed to room temperature.
Table 4.
Stability of quality control samples (n = 5)
| Nominal concentration (ng/mL) |
Measured mean concentration (ng/mL) ± S.D |
CV(%) | Mean accuracy (%) |
|---|---|---|---|
| Three freeze/thaw cycles (−20 °C) | |||
| 20 | 18.38 ± 0.63 | 3.45 | 91.96 |
| 500 | 577 ± 27.03 | 4.69 | 115.50 |
| 2000 | 2202 ± 87.01 | 3.95 | 108.75 |
| Autosampler, 4 °C, 72 h | |||
| 20 | 20.40 ± 1.26 | 6.45 | 102.12 |
| 500 | 493 ± 38.70 | 7.85 | 98.56 |
| 2000 | 1960 ± 175.78 | 8.97 | 98.14 |
| Ambient 24 h | |||
| 20 | 17.4 ± 0.83 | 4.80 | 87.00 |
| 500 | 508.75 ± 11.98 | 2.36 | 101.93 |
| 2000 | 1840 ± 85.44 | 4.64 | 92.10 |
| Storage stability (−20 °C; 1 month) | |||
| 20 | 18.66 ± 0.94 | 5.28 | 93.28 |
| 500 | 464.80 ± 20.58 | 4.43 | 92.90 |
| 2000 | 1874 ± 64.27 | 3.43 | 93.70 |
CONCLUSIONS
For the first time, an LC-MS/MS method for the determination of PD168393 levels in serum was developed and validated over a concentration range of 2–5000 ng/ml. The main advantages of this LC-MS/MS method are: (1) simplicity, assay speed, and inexpensive pre-analysis processing using protein precipitation by methanol; (2) excellent recovery; (3) absence of matrix effect; (4) absence of carry over; (5) short analytical time; and (6) validation over a large dynamic range (calibrators from 2 to 5000 ng/mL).
We conclude that this method provides a simple procedure for assaying PD168393 in biological samples and has reliable reproducibility. This method will therefore be highly useful for future studies of PD168393 pharmacokinetics in preclinical and clinical studies.
ACKNOWLEDGEMENTS
These studies were supported in part by grants from the National Cancer Institute R01 CA122804 (Steven Carroll, PI). The mass spectrometer was purchased by funds from a NIH/NCRR Shared Instrumentation Grant (S10 RR19231) and from this institution. Operation of the UAB Comprehensive Cancer Center Mass Spectrometry Shared Facility has been supported in part by a NCI Core Research Support Grant to the UAB Comprehensive Cancer (P30 CA13148).
References
- 1.Kim H, Muller WJ. Exp. Cell Res. 1999;253:78. doi: 10.1006/excr.1999.4706. [DOI] [PubMed] [Google Scholar]
- 2.Fry DW. Pharmacol. Ther. 1999;82:207. doi: 10.1016/s0163-7258(98)00050-3. [DOI] [PubMed] [Google Scholar]
- 3.Fry DW, Bridges AJ, Denny WA, Doherty A, Greis KD, Hicks JL, Hook KE, Keller PR, Leopold WR, Loo JA, McNamara DJ, Nelson JM, Sherwood V, Smaill JB, Trumpp-Kallmeyer S, Dobrusin EM. Proc. Natl. Acad. Sci. USA. 1998;95:12022. doi: 10.1073/pnas.95.20.12022. [DOI] [PMC free article] [PubMed] [Google Scholar]
- 4.Stonecypher MS, Byer SJ, Grizzle WE, Carroll SL. Oncogene. 2005;24:5589. doi: 10.1038/sj.onc.1208730. [DOI] [PubMed] [Google Scholar]
- 5.Darmoul D, Gratio V, Devaud H, Peiretti F, Laburthe M. Mol. Cancer Res. 2004;2:514. [PubMed] [Google Scholar]
- 6.Pu YS, Hsieh MW, Wang CW, Liu GY, Huang CY, Lin CC, Guan JY, Lin SR, Hour TC. Biochem. Pharmacol. 2006;71:751. doi: 10.1016/j.bcp.2005.12.009. [DOI] [PubMed] [Google Scholar]
- 7.Bose R, Molina H, Patterson AS, Bitok JK, Periaswamy B, Bader JS, Pandey A, Cole PA. Proc. Natl. Acad. Sci. U S A. 2006;103:9773. doi: 10.1073/pnas.0603948103. [DOI] [PMC free article] [PubMed] [Google Scholar]
- 8.Sirotnak FM, Zakowski MF, Miller VA, Scher HI, Kris MG. Clin. Cancer Res. 2000;6:4885. [PubMed] [Google Scholar]
- 9.U.S. Food and Drug Administration: Centre for Drug Evaluation and Research: Guidance for Industry. Bioanalytical Method Validation. 2001 http://www.fda.gov/cder/quidance/4252fnl.htm.
- 10.Shah VP, Midha KK, Findlay JWA, Hill HM, Hulse JD, McGilveray IJ, McKay G, Miller KJ, Patnaik RN, Powell ML, Tonelli A, Viswanathan CT, Yacobi A. Pharm. Res. 2000;17:1551. doi: 10.1023/a:1007669411738. [DOI] [PubMed] [Google Scholar]
- 11.Rosing H, Man W, Doyle E, Bult A, Beijnen JH, Liq J. Chromatogr. Relat. Technol. 2000;23:329. [Google Scholar]
- 12.Schuhmacher J, Zimmer D, Tesche F, Pickard V. Rapid Commun. Mass Spectrom. 2003;17:1950. doi: 10.1002/rcm.1139. [DOI] [PubMed] [Google Scholar]
- 13.Matuszewski BK, Constanzer ML, Chavez-Eng CM. Anal. Chem. 1998;70:882. doi: 10.1021/ac971078+. [DOI] [PubMed] [Google Scholar]
- 14.Chavez-Eng CM, Constanzer ML, Matuszewski BK. J. Pharm. Biomed. Anal. 2004;35:1213. doi: 10.1016/j.jpba.2004.03.020. [DOI] [PubMed] [Google Scholar]


