Abstract
The purpose of this study is to investigate the effects of moisture content on the storage stability of freeze-dried lipoplex formulations. DC-Cholesterol: DOPE (dioleoyl phosphatidylethanolamine) /plasmid DNA lipoplexes were prepared at a 3-to-2 DC-Cholesterol+ to DNA− molar ratio and lyophilized prior to storing at room temperature, 40 °C, and 60 °C for three months. Different residual moistures (1.93%, 1.10%, 1.06% and 0.36%) were obtained by altering the secondary drying temperatures. In addition to moisture content, lipoplex formulations were evaluated after freeze-drying and/ or storage for particle size, transfection efficiency, accumulation of TBARS (thiobarbituric reactive substances), glass transition temperature, DNA supercoil content, and surface area. Lipoplex formulations stored at room temperature for 3 months maintain TBARS concentrations and supercoil contents. At higher storage temperatures, formulations possessing the highest moisture content (1.93%) maintained significantly lower TBARS concentrations and higher supercoil content than those with the lowest (0.36%) moisture content. Curiously, the intermediate moisture contents exhibited marked differences in stability despite virtually identical moisture contents. Subsequent measurements of surface area indicated that the lower stability corresponded to higher surface area in the dried cake, suggesting that there may be an interplay between water content and surface area that contributes to storage stability.
Keywords: Stabilization, Gene Delivery, Nonviral vector, freeze-drying, Formulation, Storage, lyophilization
Introduction
Genetic therapeutics have future potential as treatments of currently incurable diseases such as cancers, SARS, and AIDS.1–5 These therapeutics typically require a delivery vehicle to enhance biological activity, and there is intense interest in developing a synthetic, nonviral vector that is safe and effective. This emphasis on improving delivery has assumed that the well-recognized stability problems associated with particulate delivery systems will ultimately be resolved.6–10 In an attempt to develop stable formulations of nonviral vectors, our laboratory has focused on improving the stability of synthetic delivery systems during lyophilization and storage. Although we have demonstrated that the chelator diethylenetriaminepentaacetic acid (DTPA) and α-tocopherol dramatically reduce degradation involving trace metal contaminants and lipid, respectively, degradation is still observed during prolonged storage.11 Our previous work has shown that even in very dry samples that are stored well below the glass transition temperature, DNA and lipid degrade slowly over a 2-year period.12 Furthermore, the mechanism of degradation appears to involve reactive oxygen species that oxidize lipids in the dried state.13 Since it is generally thought that stability during drying is largely due to the reduced molecular mobility that attenuates chemical reactions in the dried state, it is typically assumed that enhanced stability can be achieved at lower moisture contents.14 Accordingly, the purpose of our study was to investigate the effect of moisture content on storage stability of nonviral vector formulations.
The enhanced stability offered by the removal of water has been utilized extensively by mother nature and the pharmaceutical industry.15,16 It has been conclusively demonstrated that sugars (e.g., sucrose, trehalose) are able to preserve macromolecules during drying.17 The mechanism by which sugars exert their protective effect is thought to involve both glass formation18,19 and hydrogen bonding,20 although the validity of these mechanisms is still debated.21 Regardless of the precise mechanism responsible for stabilization, the role of water as both a reactant and plasticizer suggests that progressively greater stability should be observed at lower moisture contents.14 Furthermore, the fact that lower storage temperatures extend shelf-life is consistent with the notion that reduced molecular mobility in the dried state is responsible for stabilization. Attempts to correlate stability with the degree to which the storage temperature is below the glass transition temperature also implies that molecular mobility is ultimately the critical parameter responsible for stability in the dried state.19
In contrast to these assertions, multiple studies have observed that very low moisture content actually accelerates degradation in dried viruses and proteins.22,23 More specifically, in very dry formulations, different oxidation pathways appear to dominate protein degradation.24 For gene vectors, overdried virus formulations are also reported to have lower titer compared those having slightly higher moisture contents.25,26 It has been proposed that overdried protein formulations cause the exposure of some hydrophilic sites to oxygen, which may promote degradation.27 Studies have also argued for the existence of an optimal (as opposed to the lowest attainable) residual moisture.23,27 Other reports have stressed the importance of specific surface area (SSA), and some studies have suggested that optimal water content may be determined by that needed for monolayer coverage of the available surface.28–30 While the interactions among these factors likely play a role in stabilization, this study was designed to be an initial investigation into the effects of moisture content on the storage stability of freeze-dried lipoplexes.
Materials and Methods
Reagents
Trehalose was purchased from Pfanstiehl Laboratories (Waukegan, IL). Tween 80 was purchased from Spectrum Quality Products, Inc. (Gardena, CA). Sodium dodecyl sulfate (SDS), N-(2-Hydroxyethyl) piperazine-N′-(2-ethanesulfonic acid) potassium salt (HEPES salt), α-tocopherol, diethylenetriamine- pentaacetic acid (DTPA), ethidium bromide (EtBr) solution (10 mg/mL), 2-thiobarbituric acid (TBA), 2,6-di-tert-butyl-4-methylphenol (BHT), 1,1,3,3-tetraethoxy propane (MDA), and Hydranal® water standard 1.00 were purchased from Sigma® (St. Louis, MO). Luciferase plasmid DNA was a kind gift from Valentis® Inc. (Burlingame, CA). Dioleoyl phosphatidylethanolamine (DOPE) and 3β-[N-(N',N'-Dimethylaminoethane)-carbamoyl] cholesterol hydrochloride (DC-Cholesterol) were purchased from Avanti Polar Lipids (Alabaster, AL). Luciferase assay kit, Reporter Lysis Buffer (5X, RLB), blue/orange 6X loading dye, and 1 kb DNA ladder were purchased from Promega® (Madison, WI). Bio-Rad® protein assay dye reagent and Tris-Acetate-EDTA buffer (TAE) were purchased from Bio-Rad Laboratories Inc. (Hercules, CA). Trichloroacetic acid was purchased from LabChem® Inc. (Pittsburgh, PA). Dimethylformamide (< 50 ppm water) were obtained from Acros Organics (Fairlawn, NJ). Dulbecco’s Modification of Eagle’s Medium (DMEM), fetal bovine serum (FBS), L-glutamine, penicillin G / streptomycin sulfate, phosphate buffered saline (PBS), and trypsin EDTA were purchased from Mediatech Inc. (Manassas, VA). Pyridine-free vessel solution and generator solution were purchased from Photovolt Instruments Incorporation (St. Louis Park, MN). Agarose for DNA gels was purchased from Fisher Scientific (Pittsburgh, PA). All solvents such as chloroform and ethanol were HPLC grade and were from Fisher Scientific (Pittsburgh, PA) and no further purification was used. All water used was tri-distilled water.
Metal-free container preparation
All labware including lyophilization vials and rubber stoppers were soaked in a 0.1 N HCl solution overnight and rinsed three times using high-purity tri-distilled water, followed by drying in a 60 °C oven for 3 days.31
Cell culture
African green monkey kidney cells (COS-7) were obtained from American Type Culture Collection (Rockville, MD). Cells were incubated at 37 °C in a humidified atmosphere containing 5% CO2. Cells were maintained in DMEM supplemented with 10% fetal bovine serum, 50 U/ml penicillin G, and 50 µg/ml streptomycin sulfate, and were propagated by reseeding at 2×10⁵ cells/100-mm dish every 3 days. All cells used for transfection were within 40 passes. For use in our experiments, cultures were freshly seeded at 80,000 cells/well in a 24-well plate (Costar®, Corning Inc., Corning, NY) less than 24 h before transfection.
Lipoplex preparation, freeze-drying, and storage protocols
DC-Cholesterol: DOPE (pKa= 6.45) was chosen for these studies because of its broad applications, including in vivo and clinical studies.32–36 DC-Cholesterol: DOPE/plasmid DNA lipoplexes were prepared at a 3-to-2 DC-Cholesterol:DOPE molar ratio32 and at a 3-to-2 DC-Cholesterol+ to DNA− molar ratio after transfection results. The lipid mixture (containing α-tocopherol) was dried under a stream of nitrogen gas and placed under vacuum for more than 2 hours, subsequently resuspended in autoclaved, distilled HEPES buffer, and sonicated for 5 minutes immediately before use. The liposome preparation contained 12.59 µM α-tocopherol, 603 µM DC-Cholesterol, and 403 µM DOPE. Liposomes and DNA were mixed in equal volumes at a final HEPES buffer concentration at 20 mM and at pH 7.8. At this pH value, 94% of the DC-Cholesterol molecules are uncharged. All formulations that contained complexes had 40 µg/ml initial DNA concentration and 500-trehalose-to-DNA weight ratio before freeze-drying and storage. A final volume of 0.2 ml for each vial was transferred to 1-ml flat-bottomed borosilicate freeze-drying vials (West Pharmaceutical Services Incorporation, Lionville, PA). The final concentrations of these components were: 120 µM DC-Cholesterol, 80 µM DOPE, 2.5 µM α-tocopherol, 8 µg DNA/vial, 200 µM DTPA, and 4 mg trehalose/vial. All formulations were incubated for at least 30 min at room temperature prior to lyophilization. All freeze-drying experiments were performed in an FTS DuraStop® lyophilizer (Stone Ridge, NY) with freezing (4 hr, 2.5 °C/min, and product temperature at −27°C due to heat radiation) and primary drying (60 mTorr) at −30°C for 24 hours, and secondary drying at 20, 5, 0 or −10 °C (8 hours, 60 mTorr, and 0.2 °C/min). The freezing and primary drying temperature were derived from our previous finding indicating that drying can be conducted slightly above Tg’ without risk of collapse.37 After freeze-drying, all vials were purged with argon gas (450 Torr) that had been passed through an oxygen scrubber (Agilent Technologies, Santa Barbara, CA) to remove low levels of oxygen contamination. After backfilling, vials were sealed with acid-washed/ rinsed/ dried rubber stoppers and with aluminum caps. The pH value after freezing was tested by adding a Fisher Universal Indicator Solution (pH Range 4–11, Pittsburgh, PA) into some sample vials. No color change was observed from 20 to −30 °C for this HEPES system. The accuracy of this pH dye was ± 0.5 pH units.
Samples were stored for up to 3 months at room temperature, 40 °C, and 60 °C. Temperatures at 40 °C and 60 °C were controlled by two ovens within ± 1 °C while room temperature was the bench temperature in the laboratory. Lipoplex and pure sugar formulations were evaluated after freeze-drying and storage for: particle size, transfection, TBARS (thiobarbituric reactive substances), glass transition temperature (Differential Scanning Calorimetry), and DNA supercoil content.
Transfection assay
COS-7 cells were seeded overnight in a 24-well plate less than 24 hours prior to washing with phosphate-buffered saline (PBS) and performing transfection experiments. Diluted fresh controls and rehydrated samples were incubated for ~ 30 minutes after dilution/rehydration to 0.2 ml with tri-distilled water. Aliquots of these fresh controls and lipoplexes after freeze-drying and/or storage contain 1 µg DNA. Those aliquots were transferred to wells containing COS-7 cells with 1 ml serum-free, antibiotic-free DMEM. The cells were incubated with lipoplexes for 4 h before the medium was replaced with 1 ml DMEM containing serum and antibiotics. After 40 h, the culture medium was discarded, and the cells were washed twice with 1 ml PBS and then lysed with 0.4 ml of 2X RLB (Reporter Lysis Buffer, Promega®, Madison, WI). A single freeze–thaw (> 1 hour at −80 °C) was performed after applying RLB. After being thawed at room temperature, all solutions were then centrifuged at 13,000 × g and at 4 °C for 1 minute. Twenty microliters of supernatant were used for the luciferase expression assay via the luciferase assay kit (Promega®, Madison, WI), according to the manufacturer’s protocol. The luciferase signal was quantified using a Monolight® 2010 Luminometer (BD Biosciences Pharmingen®, San Jose, CA). Another 20 µl supernatant were used for protein determination performed on a THERMOmax® microplate reader (Sunnyvale, CA).
Dynamic light scattering analysis
Aliquots of replicate suspensions (n = 4) were used for dynamic light scattering analysis on a Nicomp® 370 Submicron Particle Sizer (Santa Barbara, CA). Channel width was set automatically based on the rate of fluctuation of scattered light intensity. The data were volume-weighted and the analysis was based on the assumption that lipoplexes are solid particles.
Differential scanning calorimetry (DSC)
Freeze-dried samples (trehalose only) experiencing either no storage or 3-month storage at room temperature, 40°C and 60°C were used for DSC analysis. Analysis was performed using a Perkin-Elmer Diamond DSC (Norwalk, CT). Dried powder (2 to 11 mg) was removed from freeze-drying vials and sealed in aluminum pans. These operations were performed in a glove box purged with dry air (humidity < 10%). All measurements were made using hermetically sealed aluminum pans (Perkin Elmer, Norwalk, CT) and an empty pan as a reference. Samples containing trehalose were heated (from 20–150 °C) at 10°C/min, held for five min, then cooled to 20°C, and reheated again to 150°C to measure the glass transition temperature (Tg) in the second scan. Both onset Tg and midpoint Tg are listed (Table 1). Determination of Tg in some samples having the highest moisture content was unreliable because the change in heat capacity was difficult to detect.
Table 1.
Glass Transition Temperatures (Tg) of freeze-dried formulations before and after storage
| Secondary Drying Temperature (°C) |
Before Storage | After 3-month Storage at: | ||||||||
|---|---|---|---|---|---|---|---|---|---|---|
| RT | 40 °C | 60 °C | ||||||||
| Onset Tg | Mid Tg | Onset Tg | Mid Tg | Onset Tg | Mid Tg | Onset Tg | Mid Tg | |||
| −10.0 | 106±10.7 | 109±10.5 | NA | NA | NA | NA | NA | NA | ||
| 0.0 | 108±5.1 | 111±3.9 | NA | NA | 100±0.9 | 102±1.0 | 104±5.7 | 107±5.3 | ||
| 5.0 | 101±7.3 | 104±6.8 | 100±4.8 | 102±4.8 | 98±2.3 | 100±2.2 | 109±6.0 | 111±5.7 | ||
| 20.0 | 113±0.4 | 115±0.4 | 113±2.7 | 115±2.5 | 106±1.4 | 109±1.3 | 113±4.3 | 114±4.1 | ||
All data shown as mean ± 1 SE of calorimetric scans
Tg values correspond to the onset temperature
Tg values correspond to the midpoint of the second-order change in heat capacity with temperature
Single measurement
NA: Not available
Determination of water content
Residual moisture in dried cakes was monitored using a Mettler DL37 coulometric moisture analyzer (Hightstown, NJ) with pyridine free vessel solutions (Photovolt Instruments, Inc., St. Louis Park, MN). Samples were prepared in a glove box where humidity was maintained below 10%. Freeze-dried samples were dissolved in anhydrous dimethylformamide (< 50 ppm water) and sonicated for less than 10 seconds prior to analysis. Aliquots were withdrawn with a syringe through the rubber stopper and moisture analysis was performed as previously described.38 Water standards were used to verify the accuracy of the instrument. Four samples were used to determine each water content.
Extraction of DNA from nonviral vectors and quantification of supercoil content
Separation of DNA from cationic lipids was performed by mixing rehydrated or freshly prepared samples containing 2 µg of DNA with a sodium dodecyl sulfate (SDS) solution to have a final SDS concentration of 25 mM. The mixture was incubated for 15 minutes at 75°C and cooled to room temperature. Aliquots containing 300 ng of DNA were used to quantify DNA supercoil content. Loss of supercoil content was assessed by agarose gel (0.9%) electrophoresis at 70 V for ~3 hours. The gels were then soaked in 0.1 µg/ml EtBr solution for 30 minutes and later in tri-distilled water for 5 minutes. Fluorometric images were taken using a Fluor-S MultiImager (Hercules, CA). All band intensities were analyzed using Adobe Photoshop® (San Jose, CA). Fluorescence intensity for supercoiled DNA bands was corrected by multiplying by a factor of 1.4.39
Thiobarbituric acid reactive substances (TBARS) assay
The thiobarbituric acid reactive substances (TBARS) assay was used to determine the extent of peroxidation in dried cakes. Freeze-dried samples were rehydrated with 200 µl distilled water and incubated for ~30 min. An aliquot (150 µl) of each sample was mixed with 250 µl of 10% trichloroacetic acid, 25 µl of 2% BHT, and 0.5 ml 0.67% TBA. These mixtures were then heated at 85°C for 20 minutes, and cooled at 4 °C for 15 minutes. All products were centrifuged at 13,000 × g and at 4 °C for 5 minutes. An aliquot of supernatant (200 µl) from each sample was transferred into a 96-well plate and fluorescence (EX: 532 nm, EM: 590 nm) was read in a SpectraMAX Gemini EM fluorescence microplate reader (Sunnyvale, CA). The TBARS concentrations were then calculated from a calibration curve of fluorescence intensities from 12 MDA standards ranging from 0.033 mM to 66.742 mM.
Specific Surface Area Measurements
Five-point BET (Brunauer, Emmett and Teller) measurements were performed using an Autosorb®-1C by Quantachrome Instruments (Boynton Beach, FL). Sample outgassing was more than 3 hours, typically overnight at room temperature. The instrument was calibrated prior to use. Adsorbate was ultrahigh purity gas (100% nitrogen or 100% krypton). Some data points were repeated multiple times on different samples. The reproducibility was within 0.73 %. All results having R2 less than 0.951 are discarded. All samples used for BET measurements were in the same type of vials as those used for other tests. Multiple (10 – 50) cakes were combined in a glove box to achieve a sufficiently large total surface area (> 0.3 m2) for accurate measurement.
Statistical analysis
Statistically significant differences were determined using a two-tailed distribution (Student’s t-test) with SigmaPlot® (Systat Software Inc., San Jose, CA). Values of p > 0.05 were considered as not significantly different from fresh preparations.
Results and Discussion
The goal of the current study was to examine the effects of different moisture contents on storage stability. Previous studies have utilized different sucrose: mannitol ratios to prepare lyophilized samples with different moisture contents and identified optimal water contents for virus formulations.25 One drawback of this approach is that the formulations are altered with regards to sugar, and glass transition temperature, in addition to water content. While the amount of the different sugars can affect stability of nonviral vectors during lyophilization,40 it is also important to realize that very low levels of metal contaminants can cause dramatic differences in stability during storage,41 and therefore altering the relative levels of two components (and their associated contaminants) can complicate the interpretation. In the present study, identical formulations were prepared and subjected to different lyophilization conditions to achieve several residual moisture contents. More specifically, different secondary drying temperatures were utilized (−10°C, 0°C, 5°C, and 20°C) to achieve moisture contents of 1.93 ± 0.11%, 1.10 ± 0.14%, 1.06 ± 0.03%, and 0.36 ± 0.10%, respectively, according to the methods of Pikal et al.42 This approach resulted in preparations with three significantly different moisture contents. Cake moisture contents and glass transition temperatures do not change significantly after 3-month storage at room temperature, 40°C, and 60°C (Fig. 1; Table 1).
Figure 1.
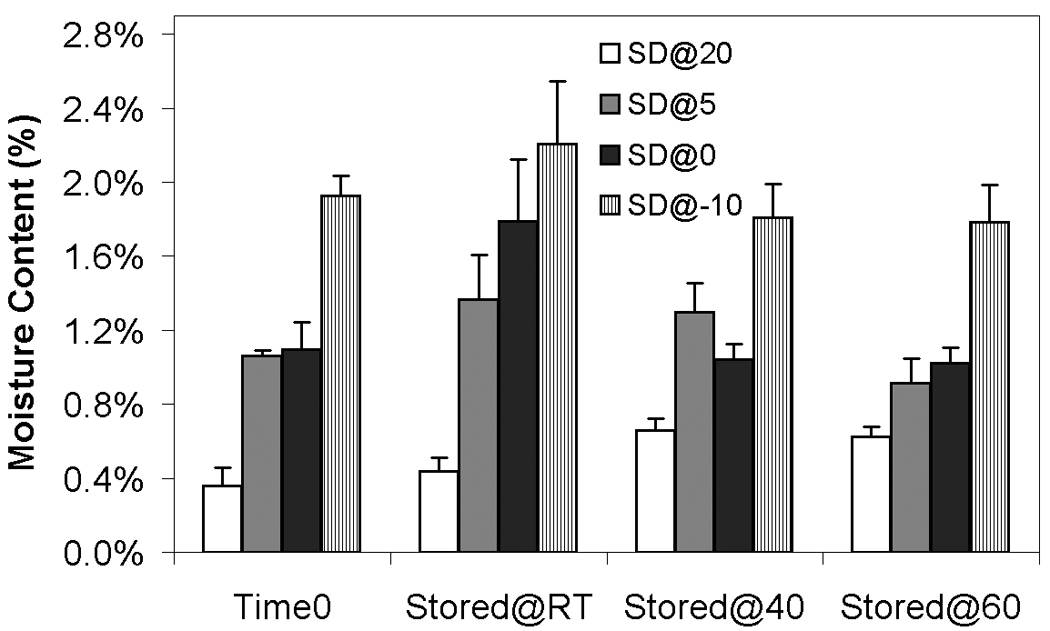
Moisture contents before and after 3-month storage at different storage temperature. White bars indicate samples secondary-dried at 20°C; gray, at 5°C; black, 0°C; hatched, −10°C. Time 0 indicates samples measured before storage but after freeze-drying. Stored@RT represents samples stored for 3 months at room temperature after freeze-drying; Stored@40 represents samples stored for 3 months at 40 °C; Stored@60 represents samples stored for 3 months at 60 °C. Each bar represents the mean ± one standard error of measurements on 4 separate vials. There is no significant difference between time 0 and stored samples for any of the preparations.
Results from transfection experiments show that storage of lipoplexes for 3 months did not substantially affect biological activity regardless of moisture content (Fig. 2). The data at 60 °C does exhibit greater variation, but all formulations stored for 3 months possess transfection levels that are not significantly different from fresh controls. This is surprising considering our previous studies demonstrating a progressive decrease in transfection during 8 weeks of storage.11 This previous work identified both DTPA and α-tocopherol as formulation components that reduced oxidation and preserved lipoplexes during storage. However, our prior work did not test the combination of these two excipients, and we believe that the improved maintenance of transfection rates observed in the current study is due to formulation with both DTPA and α-tocopherol. Previous studies on the stability of DNA have also shown that a combination of a chelator (e.g., DTPA) with a radical scavenger is capable of greatly extending shelf-life in solution.43 Our previous work also utilized a different lipid formulation which may contribute to the observed differences. Our results show that particle size was retained during 3 months of storage, in contrast to our previous study (Fig. 3).11
Figure 2.
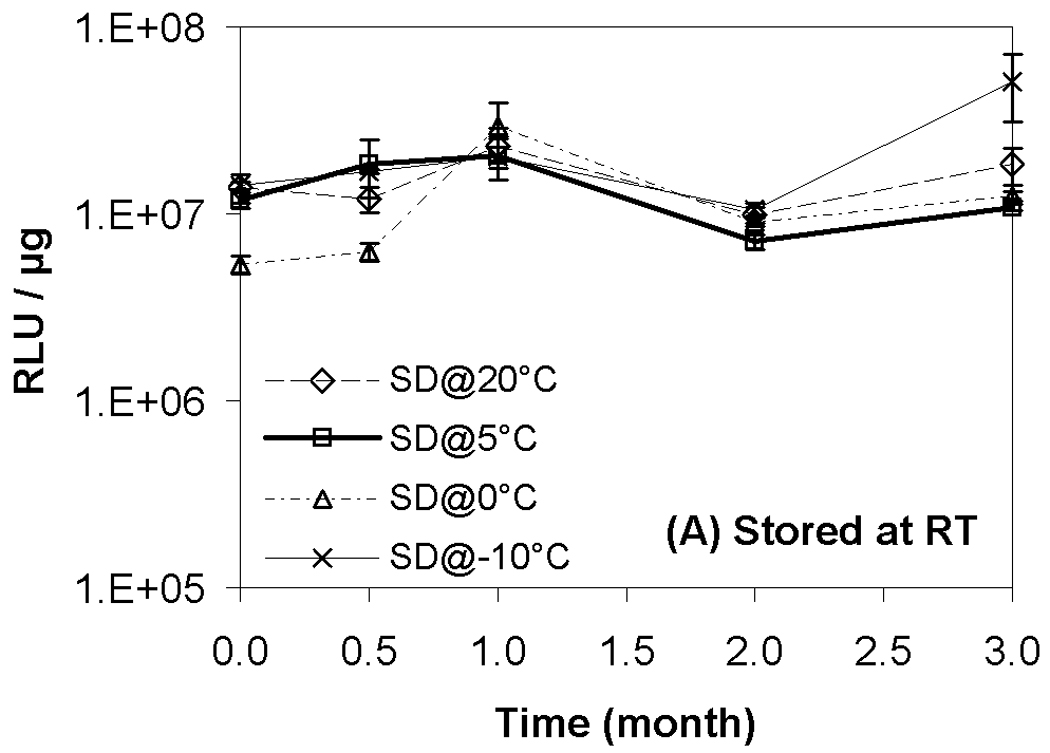
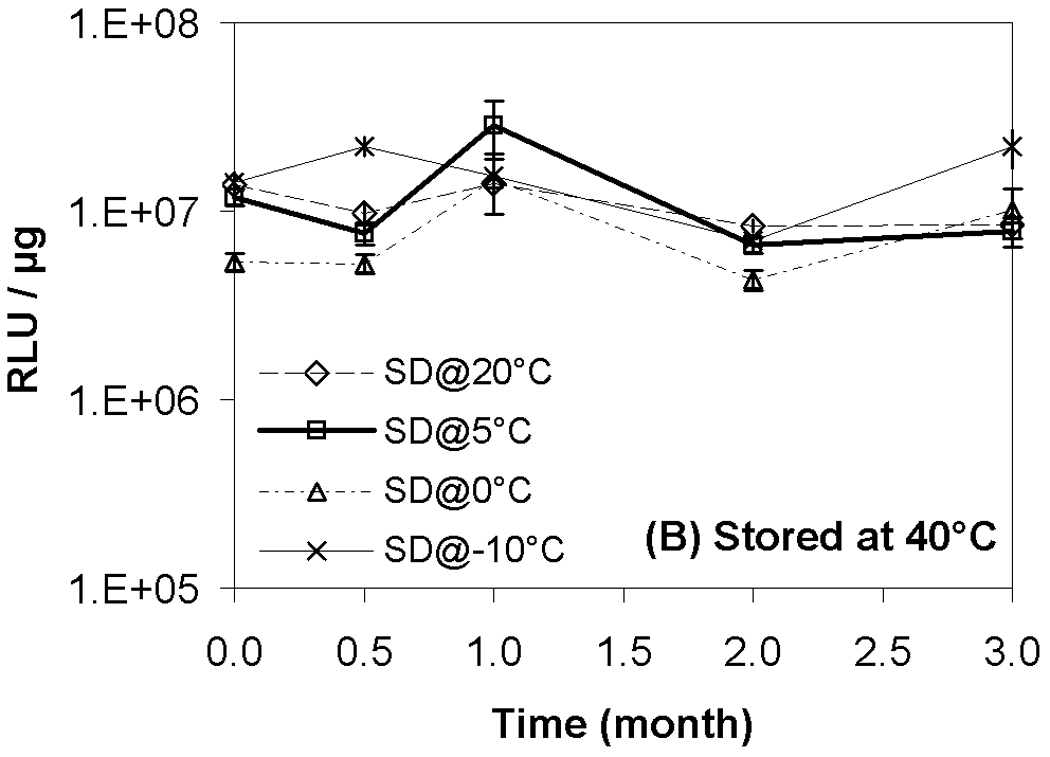
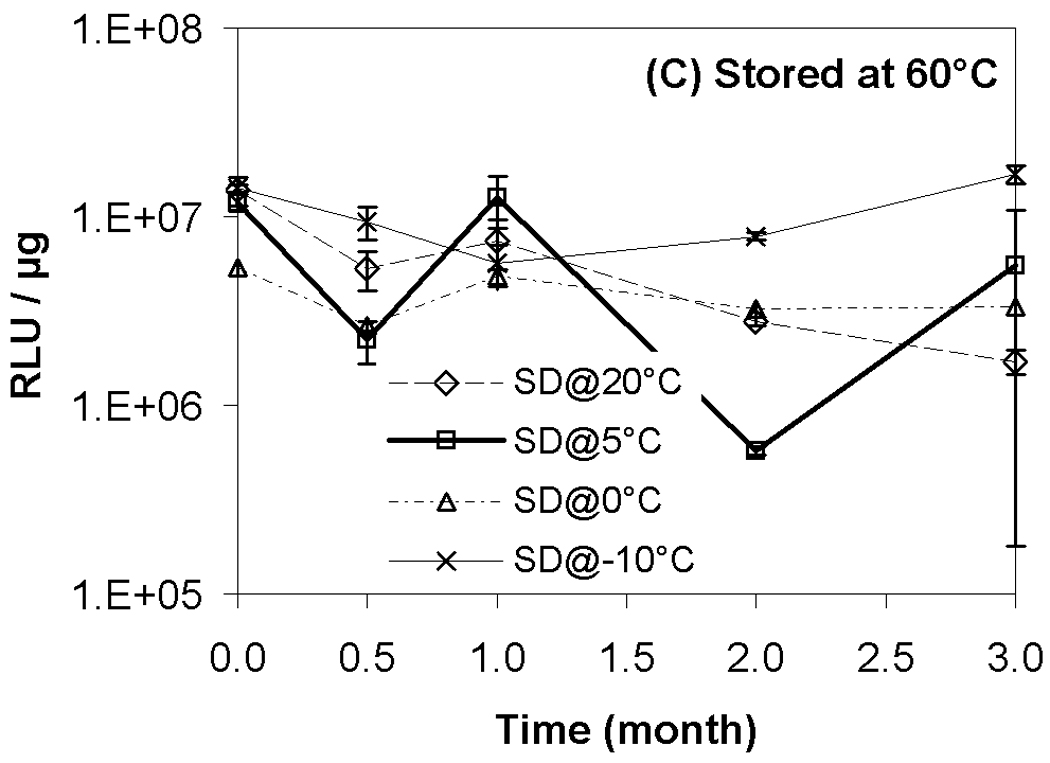
Recovery of biological activity after freeze-drying and/or storage. Luciferase expression in COS-7 cells after transfection with lipoplexes that had been freeze-dried and/or stored at indicated temperatures. Each symbol represents the mean ± one standard error of replicate samples (n=4). Fig. 2A indicates samples stored at room temperature; Fig. 2B, 40°C; Fig. 2C, 60°C. No significant difference was observed between each data point after 3-month storage and the corresponding fresh controls. SD@ stands for “secondary dried at”.
Figure 3.
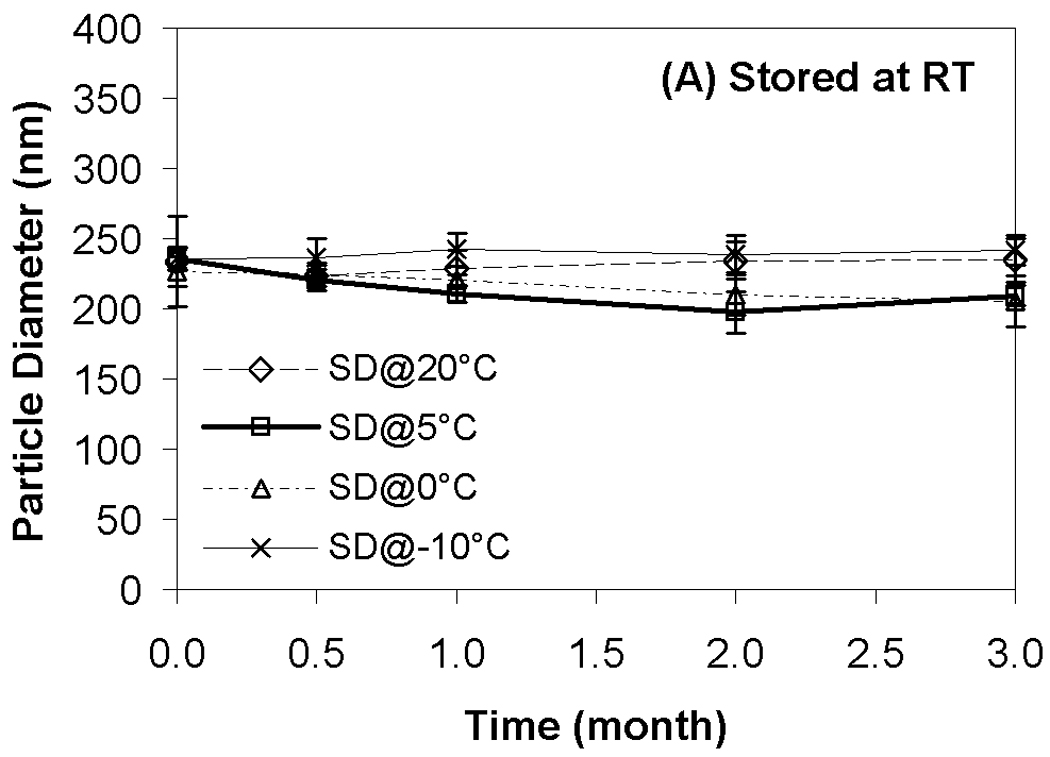
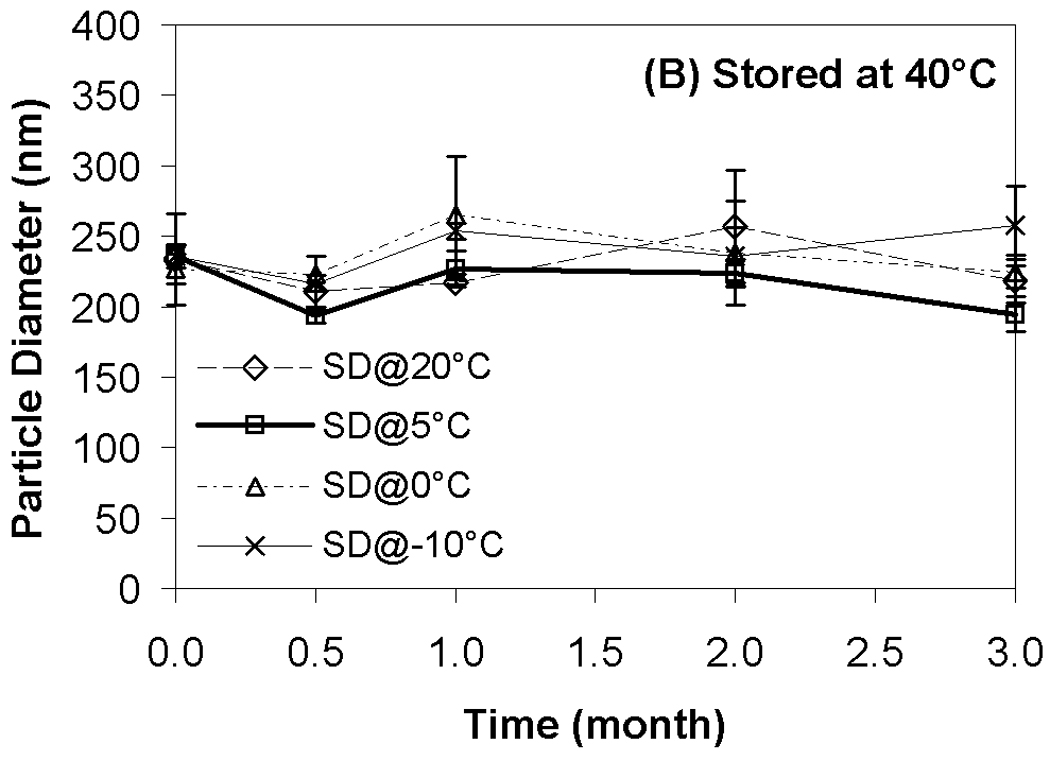
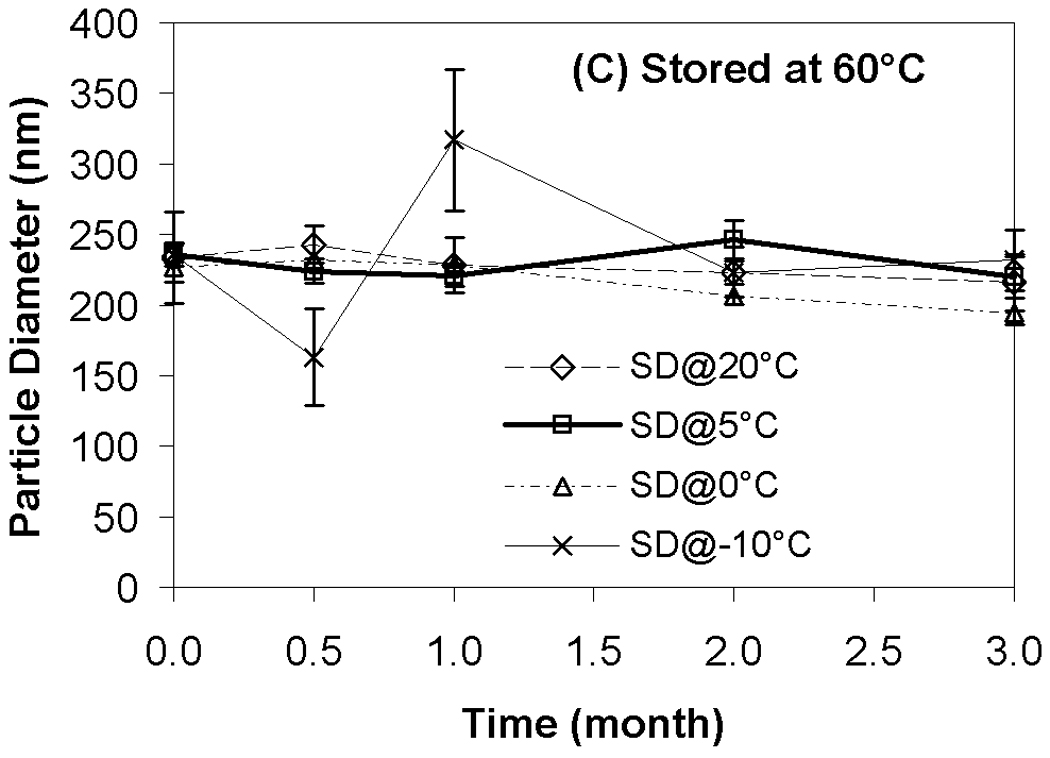
Effect of moisture content on lipoplex size after freeze-drying and/or storage. Fig. 3A indicates samples stored at room temperature; Fig. 3B, 40°C; Fig. 3C, 60°C. Each bar represents the mean ± one standard error of 4 separate vials. No significant difference between all these data points and fresh controls. SD@ stands for “secondary dried at”.
Although transfection and particle size were completely preserved during storage, changes in supercoil content were evident during storage at all temperatures (Fig. 4). Not surprisingly, the loss of supercoil content was more dramatic at higher storage temperatures, and clear differences among the various moisture contents were observed at both 40 °C and 60 °C (Figs. 4B+C). More specifically, we did not observe a strong correlation of supercoil content with moisture levels, but the driest formulation (SD@20°C) exhibited consistently greater DNA degradation than did the formulation with the highest moisture content (SD@−10°C). The most surprising finding is that the formulations with comparable water contents (SD@0°C and SD@5°C) exhibited markedly different abilities to maintain DNA integrity in the dried state. Furthermore, the greatest retention of supercoil content at 60 °C was observed in samples possessing intermediate moisture content (SD@5°C), while other samples containing the same residual moisture (SD@0°C) exhibited degradation rates similar to the worst-performing, driest formulation (Fig. 4C). These results suggest that factors other than water content play a significant role in the storage stability of our preparations.
Figure 4.
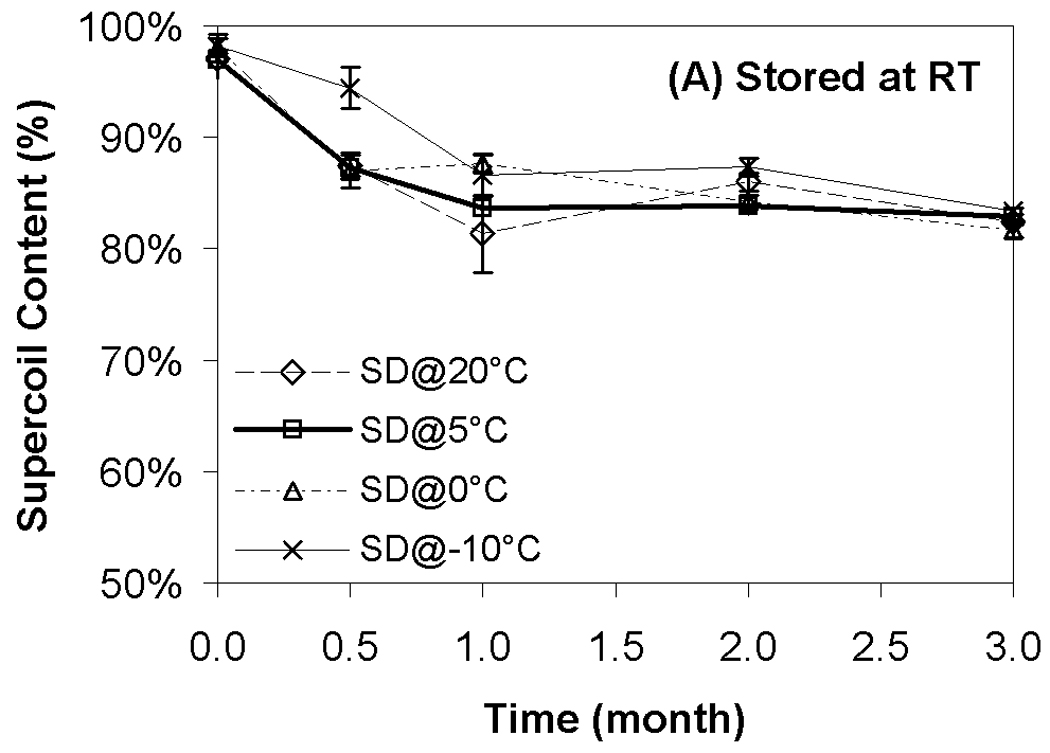
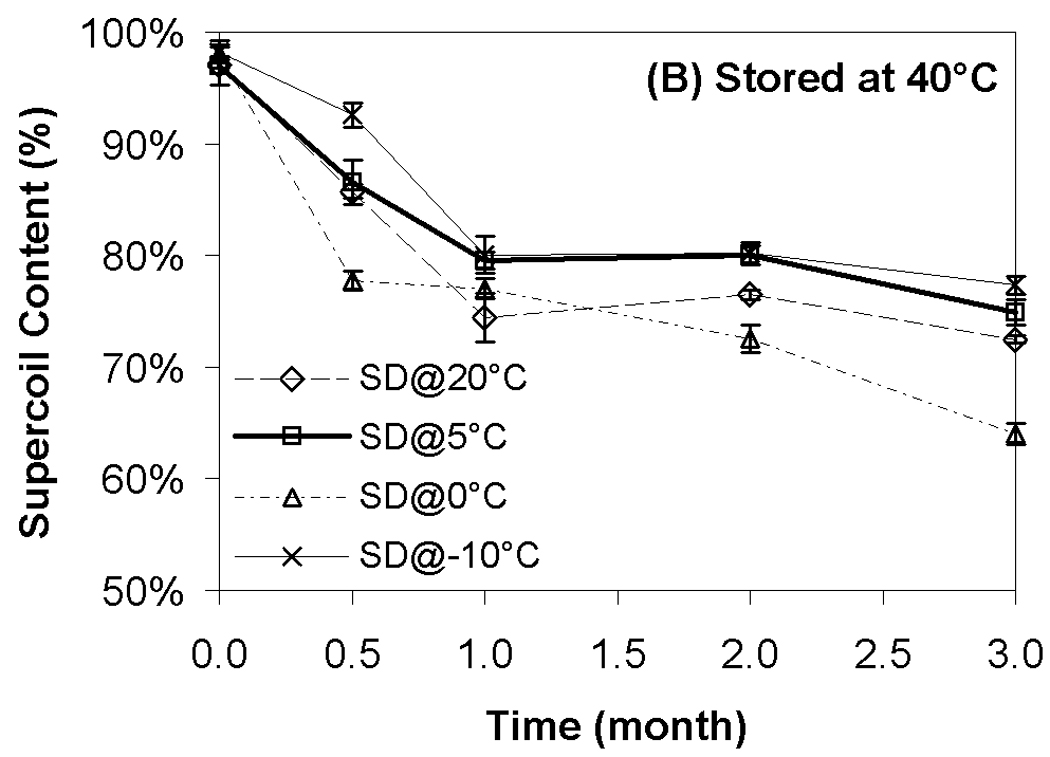
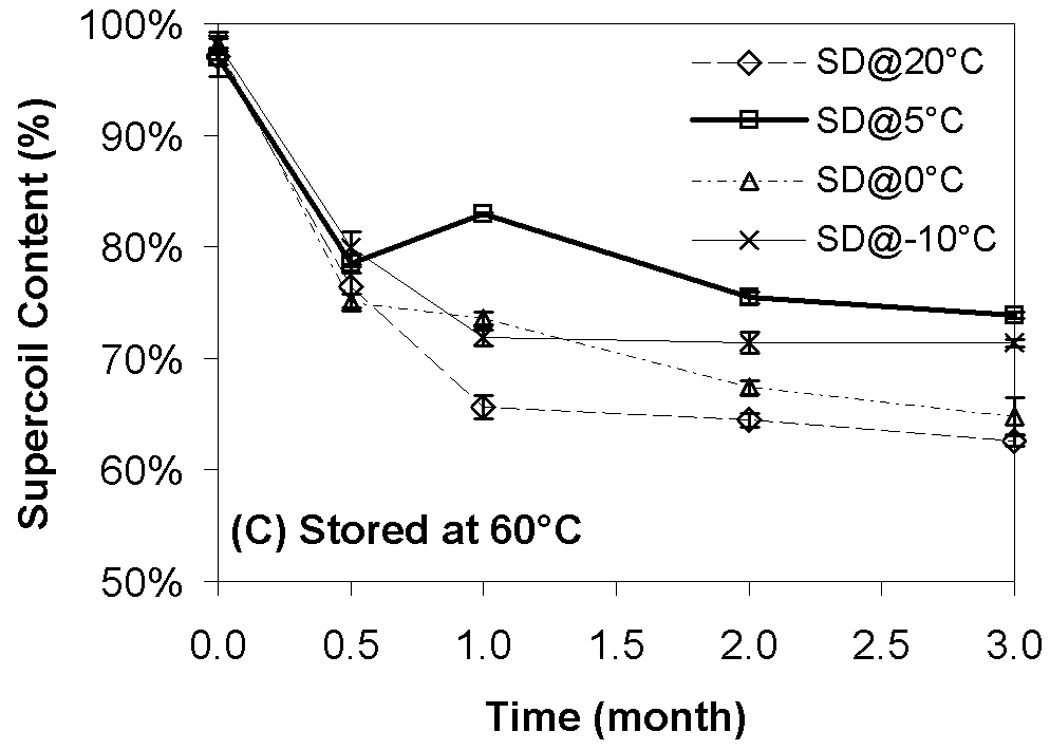
Effect of moisture on DNA supercoil content after freeze-drying and/or storage. Each symbol represents the mean ± one standard error of samples (n=4). Fig. 4A indicates samples stored at room temperature; Fig. 4B, 40°C; Fig. 4C, 60°C. SD@ stands for “secondary dried at”.
Previous work on the storage stability of lipid/DNA complexes has demonstrated the role of reactive oxygen species in degradation in the dried state.12 More recent work has shown that oxidation of the lipid component is particularly problematic, and that aldehyde formation (predominantly from lipid peroxidation) also occurs during storage.13 Accordingly, we used the TBARS assay to determine the effect of moisture content on aldehyde formation during storage. Our results show that aldehyde formation is minimal in samples stored at room temperature, but that storage of samples at 40 °C and 60 °C resulted in substantial aldehyde formation (Fig. 5). Similar to changes in supercoil content, we did not observe a strong correlation between TBARS and residual moisture, but significant differences in aldehyde levels were observed. In particular, the driest samples exhibited consistently higher levels of aldehydes than samples possessing the highest residual moisture, and samples at the highest moisture content (SD@−10°C; 1.9% moisture) consistently had the lowest levels of aldehdye formation (Fig. 5). Similar to the results on DNA integrity, the two samples containing intermediate moisture contents displayed markedly different behavior despite having equivalent residual moisture. These observations are somewhat surprising because water is generally considered to be a plasticizer which can also participate in hydrolytic reactions. Therefore, it is typically assumed that greater stability and lower reactivity is achieved at lower moisture contents, in contrast to our findings. It should be noted that the glass transition temperature of all samples remained high (> 98°C, Table 1) and essentially constant throughout the duration of the experiments, so mobility of the DNA and lipid components in the dried state should be highly restricted in all cases. Moreover, aldehyde formation and loss of supercoil content was observed in samples even though T−Tg ≥ 50 °C for most samples, suggesting that limitation of macromolecular mobility is not sufficient to achieve long term stability of dried lipoplex formulations.
Figure 5.
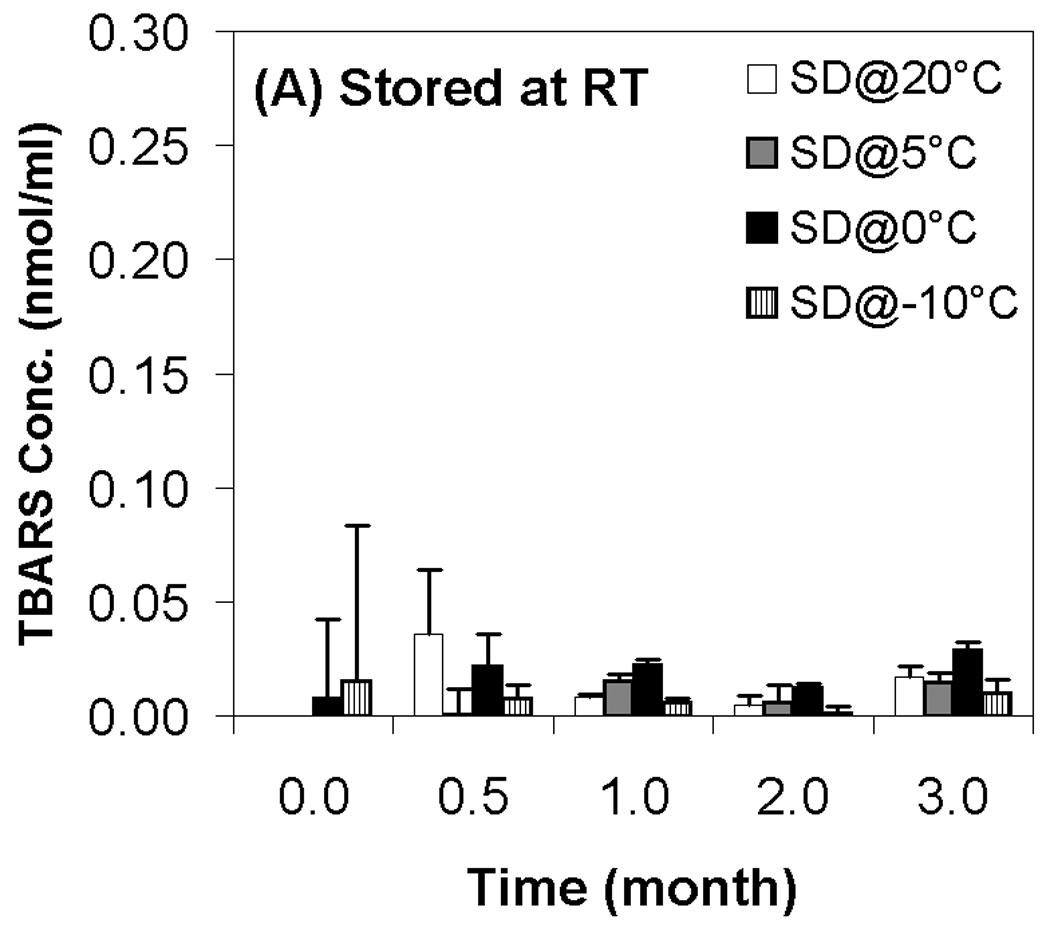
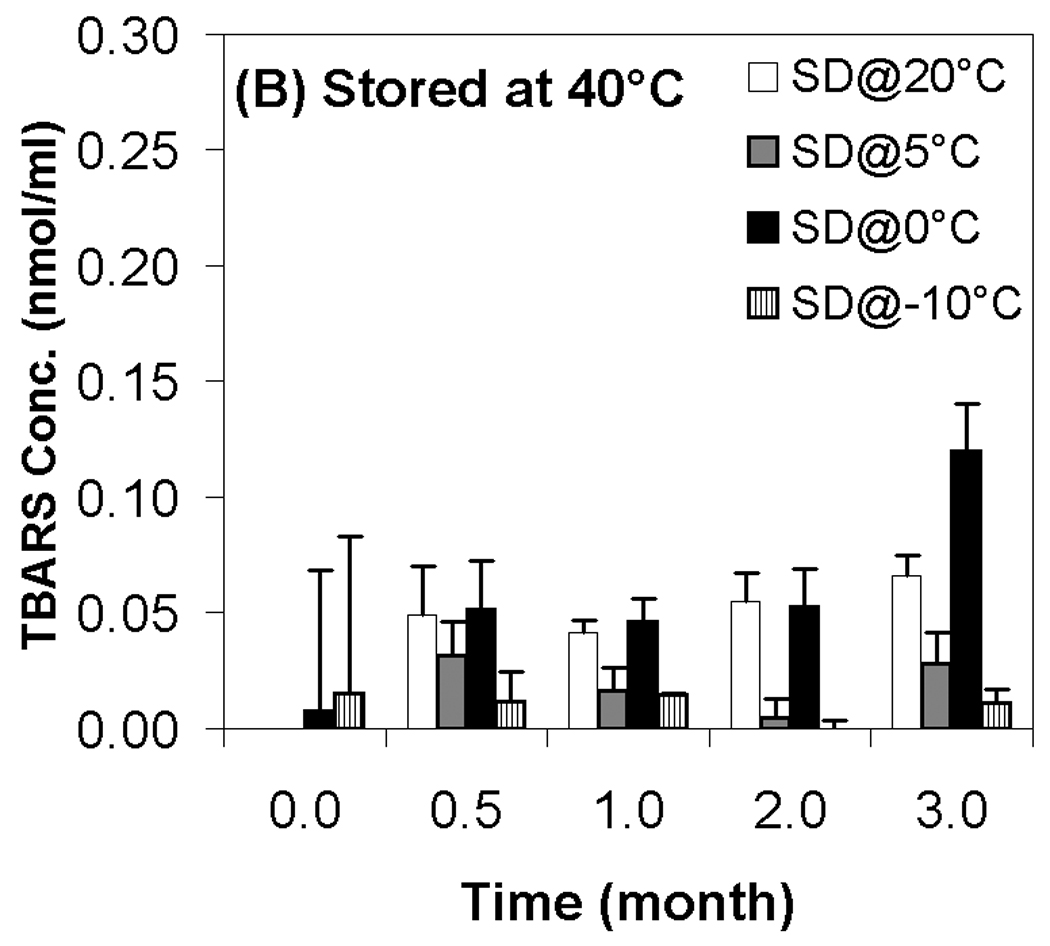
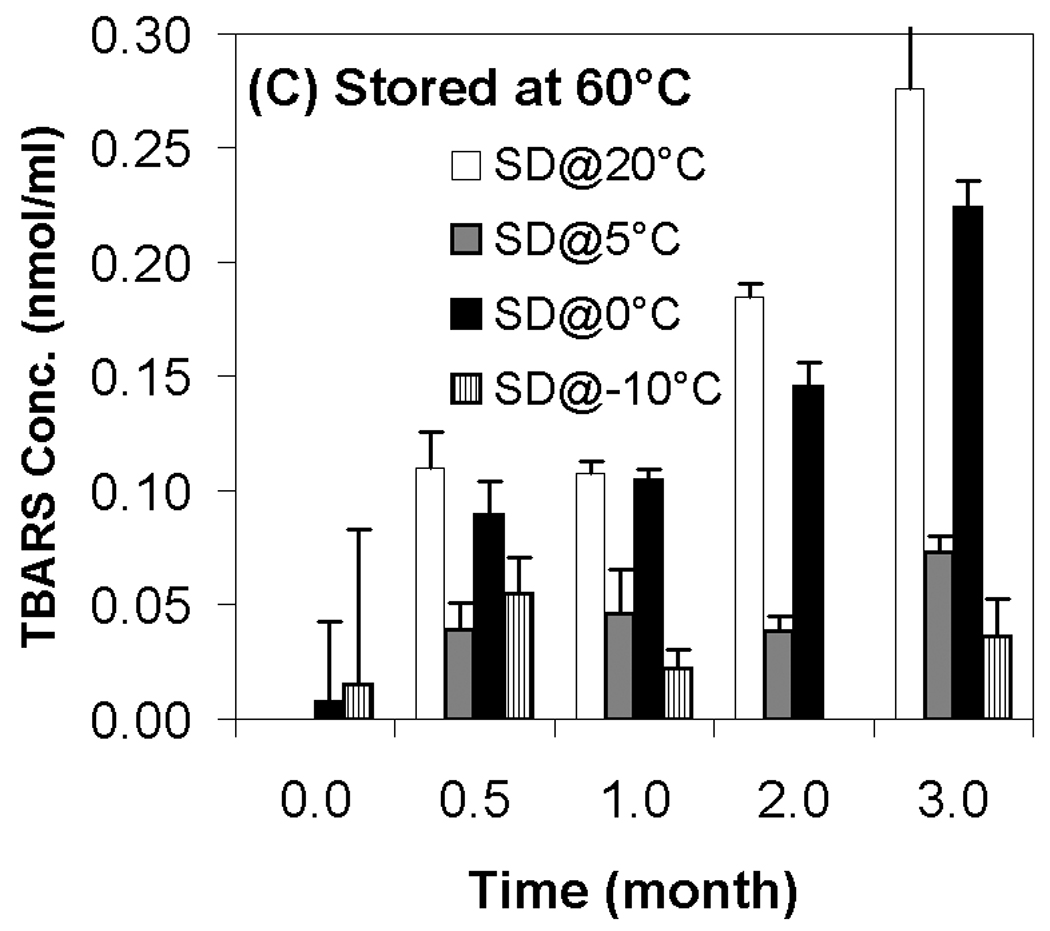
Effect of moisture content on TBARS concentration after freeze-drying and/or storage. White bars represent samples secondary-dried at 20°C; gray, at 5°C; black, 0°C; hatched, −10°C. Fig. 5A indicates samples stored at room temperature; Fig. 5B, 40°C; Fig. 5C, 60°C. Each error bar represents the mean ± one standard error of replicate samples (n=4).
As stated above, markedly different levels of supercoil content and TBARS were observed in samples, but these differences did not correlate with residual moisture. Although the highest moisture content demonstrated consistently greater stability than the driest samples, the effect of intermediate moisture content was unpredictable. In particular, one preparation (SD@5°C) at intermediate moisture exhibited high stability while degradation was rapid in a second preparation (SD@0°C) at the same moisture content. Despite these differences, samples that experienced the greatest loss in supercoil content also exhibited high levels of aldehydes. As shown in Fig. 6, a correlation exists between the formation of aldehydes (as detected by TBARS) and the loss of DNA integrity for samples stored at 60°C for ≥ 2 months (R2=0.8047). This correlation is in agreement with our previous studies and strongly suggests that lipid oxidation contributes significantly to the loss of DNA integrity.11,13 While all the formulations in our current study contain DTPA and α-tocopherol to attenuate lipid oxidation, these results indicate that low levels of oxidation still occur in the presence of these excipients, and that oxidation ultimately limits storage stability of lipoplex formulations in the dried state.
Figure 6.
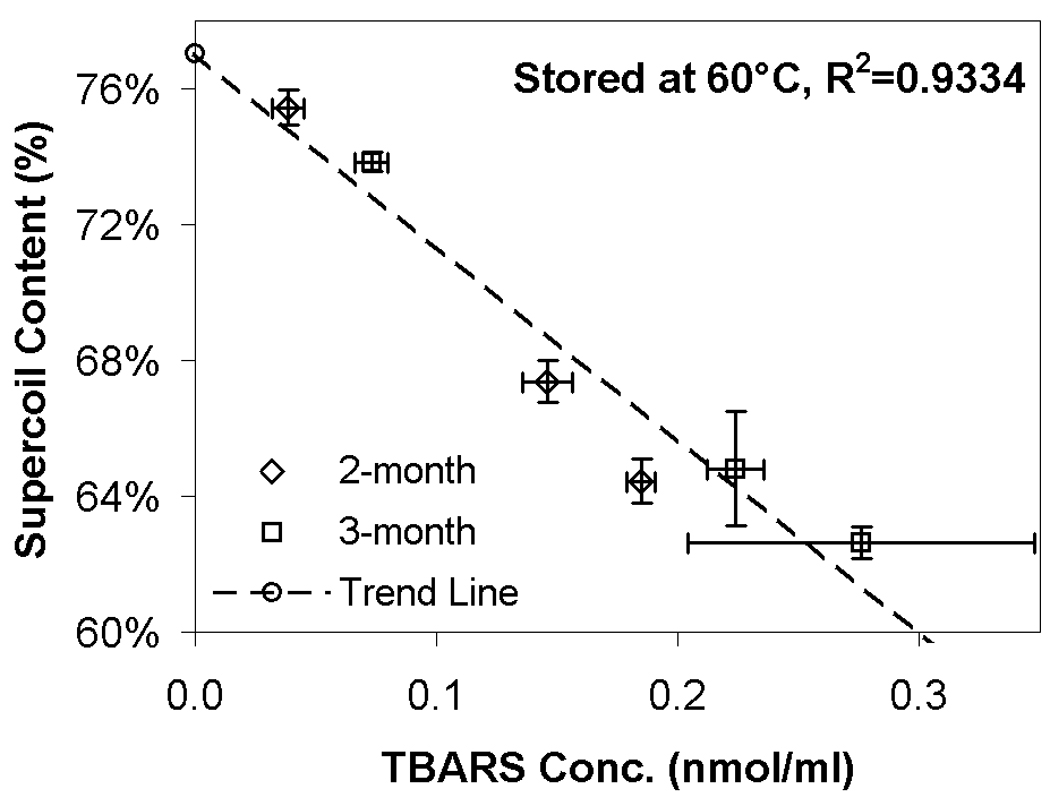
DNA supercoil contents (taken from Fig. 4) against TBARS (results taken from Fig. 5); only data after 2 and 3 months storage at 60°C are shown. Each error bar represents the mean ± one standard error of replicate samples (n=4). The trend line is the best-fit line using “least squares” method for all data in Fig. 6.
While the above correlation of DNA integrity with lipid oxidation provides some insight, the drastically different results with two samples containing virtually identical moisture contents makes it difficult to attribute our findings solely to alterations in residual water. Some of our most recent work has demonstrated the stabilizing effects of incorporating surfactants into lipoplex formulations during acute lyophilization stress.44 The current study included an investigation of the effects of Tween 80 (40 µM) on the storage stability of lipoplex formulations, but we observed that oxidation during storage was dramatically increased in the presence of Tween 80 (data not shown). We suspect that the rapid deterioration of samples formulated with Tween 80 was due to the tendency of this unsaturated detergent to participate in oxidation, and future studies will investigate this hypothesis. Regardless, our previous study documenting the beneficial effects of surfactants suggests that surface interactions may contribute to the damage observed in lipoplex formulations.44 Therefore, it seemed possible that preparing samples with different water contents by altering secondary drying temperatures (the method used in this study) might result in different surface areas of the dried cake which may contribute to the observed degradation. Accordingly, the surface areas of cakes prepared under these conditions were assessed with BET measurements. Our BET data at Time 0 indicate that cakes secondary dried at −10 °C had the lowest surface area (0.49 m2/g) followed by cakes secondary dried at 5 °C (0.88 m2/g), 0 °C (1.10 m2/g) and 20 °C (2.35 m2/g). BET measurements were not conducted after storage, so it is possible that additional changes in surface area occurred during storage, although no changes in cake structure were detectable by eye. From these results, we see a trend of greater degradation with higher surface areas that may explain the differences in stability observed in the two preparations with equivalent moisture content. Previous studies on the stability of dried food have suggested an interplay between moisture content and surface area such that oxidation is minimized when sufficient water is available for monolayer coverage.28–30 A straightforward calculation reveals that our moisture contents are at least 5-fold higher than that necessary for monolayer coverage, even in our driest samples. However, such an analysis assumes that water molecules are only present on the surface of the sample; an assumption that is clearly invalid for a glassy system. Regardless, the idea that monolayer coverage of the surface might reduce oxidation is consistent with our previous work suggesting a role for surfaces in facilitating degradation during lyophilization.44 Differences in surface area may explain why our previous study investigating preparations at two different water contents showed higher stability at the lower moisture content, in contrast to the current study.11 However, it should be noted that the highest moisture content employed in our previous study was comparable to the intermediate moistures investigated in this study. Nonetheless, our results with two preparations exhibiting very different stabilities despite virtually identical water contents suggest that more studies on the effect of surface area on dry state storage stability of lipoplexes are warranted.
Recent work by Pikal and colleagues has focused on the effects of surface area on the physical and chemical stability of proteins and viruses during storage.45–50 This work has clearly demonstrated that reductions in surface area by various mechanisms (e.g., annealing, incorporation of surfactants, foam drying) consistently result in greater storage stability in the dried state. Although different approaches promote surface accumulation of the active component to different extents, improved storage stability appears to correlate with lower amounts of surface exposure. These authors have explained that the total degradation rate is the sum of that experienced by the surface-exposed protein and protein buried within the glassy matrix. Furthermore, Pikal and colleagues argue that surface-exposed proteins are more susceptible to damage, and thus lowering the surface area of the dried cakes reduces the fraction of proteins on the surface. This straightforward mechanism likely contributes to our findings with lipoplexes, however the degradation we observe does not strictly correlate with surface area, suggesting that moisture content plays a role in stability that is independent of its effects on surface area. Furthermore, the correlation we observe between loss of supercoil content and aldehyde production indicates that oxidation ultimately limits storage stability, suggesting that both surface area and moisture content contribute to rates of oxidation in the dried state.
Early studies of the effect of water content on storage stability have concluded that an optimum water content exists.23,27,30 More recent work has also shown that the stability of dried viruses and proteins is dependent on water content, and that optimal stability is not achieved at the lowest possible residual moisture.25,50 The data presented here are consistent with these studies, and demonstrate that water can affect oxidation in the dried state. Our formulations contained DTPA and α-tocopherol to attenuate oxidation, but we still observed substantial oxidation, especially at high storage temperatures. The choice of trehalose as a stabilizing sugar is consistent with our previous studies demonstrating the ability of this sugar to preserve lipoplex formulations during lyophilization and storage.13 In addition to its high glass transition temperature, recent studies have also reported that trehalose is capable of reducing lipid oxidation by directly interacting with carbon-carbon double bonds.51 Although no loss in transfection activity or changes in particle size were observed after 3 months of storage, the formation of aldehydes and concomitant reduction in supercoil content indicate that current lipoplex formulations are insufficient for achieving a commercially-viable shelf-life. Considering the renewed interest in lipid-based systems for the delivery of siRNA to silence gene expression,52 improved strategies for stabilizing dried lipoplex formulations must be identified.
Acknowledgements
This work was supported by NIBIB grant EB005476-01A2 from NIH. The authors thank Professors John L. Falconer and Richard D. Noble for providing us access to AUTOSORB-1 (Quantachrome Instruments) for BET (Brunauer-Emmett-Teller) measurements. The authors also thank Jared S. Bee for his help with the AutoSorb-1 measurements.
References
- 1.Zimmermann TS, Lee ACH, Akinc A, Bramlage B, Bumcrot D, Fedoruk MN, Harborth J, Heyes JA, Jeffs LB, John M, Judge AD, Lam K, McClintock K, Nechev LV, Palmer LR, Racie T, Rohl I, Seiffert S, Shanmugam S, Sood V, Soutschek J, Toudjarska I, Wheat AJ, Yaworski E, Zedalis W, Koteliansky V, Manoharan M, Vornlocher HP, MacLachlan I. RNAi-mediated gene silencing in non-human primates. Nature. 2006;441:111–114. doi: 10.1038/nature04688. [DOI] [PubMed] [Google Scholar]
- 2.Heyes J, Palmer L, Bremner K, MacLachlan I. Cationic lipid saturation influences intracellular delivery of encapsulated nucleic acids. J Controlled Release. 2005;107:276–287. doi: 10.1016/j.jconrel.2005.06.014. [DOI] [PubMed] [Google Scholar]
- 3.Miyata K, Kakizawa Y, Nishiyama N, Yamasaki Y, Watanabe T, Kohara M, Kataoka K. Freeze-dried formulations for in vivo gene delivery of PEGylated polyplex micelles with disulfide crosslinked cores to the liver. J Controlled Release. 2005;109:15–23. doi: 10.1016/j.jconrel.2005.09.043. [DOI] [PubMed] [Google Scholar]
- 4.Peer D, Zhu P, Carman CV, Lieberman J, Shimaoka M. Selective gene silencing in activated leukocytes by targeting siRNAs to the integrin lymphocyte function-associated antigen-1. Proc Nat Acad Sci USA. 2007;104:4095–4100. doi: 10.1073/pnas.0608491104. [DOI] [PMC free article] [PubMed] [Google Scholar]
- 5.Li BJ, Tang Q, Cheng D, Qin C, Xie FY, Wei Q, Xu J, Liu Y, Zheng BJ, Woodle MC, Zhong N, Lu PY. Using siRNA in prophylactic and therapeutic regimens against SARS coronavirus in Rhesus macaque. Nat Med. 2005;11:944–951. doi: 10.1038/nm1280. [DOI] [PMC free article] [PubMed] [Google Scholar]
- 6.Kay MA, Liu D, Hoogerbrugge PM. Gene therapy. Proc Nat Acad Sci USA. 1997;94:12744–12746. doi: 10.1073/pnas.94.24.12744. [DOI] [PMC free article] [PubMed] [Google Scholar]
- 7.Tang MX, Szoka FC. The influence of polymer structure on the interactions of cationic polymers with DNA and morphology of the resulting complexes. Gene Ther. 1997;4:823–832. doi: 10.1038/sj.gt.3300454. [DOI] [PubMed] [Google Scholar]
- 8.Gustafsson J, Arvidson G, Karlsson G, Almgren M. Complexes between cationic liposomes and DNA visualized by cryo-TEM. Biochim Biophys Acta, Biomembr. 1995;1235:305–312. doi: 10.1016/0005-2736(95)80018-b. [DOI] [PubMed] [Google Scholar]
- 9.Mahato RI, Rolland A, Tomlinson E. Cationic Lipid-Based Gene Delivery Systems: Pharmaceutical Perspectives. Pharm Res. 1997;14:853–859. doi: 10.1023/a:1012187414126. [DOI] [PubMed] [Google Scholar]
- 10.Anchordoquy TJ, Koe GS. Physical stability of nonviral plasmid-based therapeutics. J Pharm Sci. 2000;89:289–296. doi: 10.1002/(SICI)1520-6017(200003)89:3<289::AID-JPS1>3.0.CO;2-N. [DOI] [PubMed] [Google Scholar]
- 11.Molina MDC, Anchordoquy TJ. Formulation strategies to minimize oxidative damage in lyophilized lipid/DNA complexes during storage. J Pharm Sci. 2008;97:5089–5105. doi: 10.1002/jps.21365. [DOI] [PubMed] [Google Scholar]
- 12.Molina MdC, Armstrong TK, Zhang Y, Patel MM, Lentz YK, Anchordoquy TJ. The stability of lyophilized lipid/DNA complexes during prolonged storage. J Pharm Sci. 2004;93:2259–2273. doi: 10.1002/jps.20138. [DOI] [PubMed] [Google Scholar]
- 13.Molina MdC, Anchordoquy TJ. Degradation of lyophilized lipid/DNA complexes during storage: The role of lipid and reactive oxygen species. Biochim Biophys Acta, Biomembr. 2008;1778:2119–2126. doi: 10.1016/j.bbamem.2008.04.003. [DOI] [PubMed] [Google Scholar]
- 14.Meryman HT. Freeze-drying. In: Meryman HT, editor. Cryobiology. New York: Academic Press Inc.; 1966. pp. 609–663. [Google Scholar]
- 15.Costantio HR, Pikal MJ. Preface. In: Costantio HR, Pikal MJ, editors. Lyophilization of Biopharmaceuticals [Biotechnol: Pharm Aspects 2004, II] Arlington: American Association of Pharmaceuticals Scientists; 2004. pp. xi–xiv. [Google Scholar]
- 16.Anchordoquy TJ, Molina MC. Preservation of DNA. Cell Preservation Technology. 2007;5:180–188. [Google Scholar]
- 17.Leslie SB, Israeli E, Lighthart B, Crowe JH, Crowe LM. Trehalose and sucrose protect both membranes and proteins in intact bacteria during drying. Appl Environ Microbiol. 1995;61:3592–3597. doi: 10.1128/aem.61.10.3592-3597.1995. [DOI] [PMC free article] [PubMed] [Google Scholar]
- 18.Levine H, Slade L. Another view of trehalose for drying and stabilizing biological materials. BioPharm. 1992;5:36. [Google Scholar]
- 19.Slade L, Levine H. Beyond water activity: recent advances based on an alternative approach to the assessment of food quality and safety. Crit Rev Food Sci Nutr. 1991;30:115–360. doi: 10.1080/10408399109527543. [DOI] [PubMed] [Google Scholar]
- 20.Crowe JH, Crowe LM, Carpenter JF. Preserving dry biomaterials: The water replacement hypothesis Part 2. BioPharm (Duluth, MN) 1993;6:40–43. [Google Scholar]
- 21.Chang L, Shepherd D, Sun J, Ouellette D, Grant KL, Tang X, Pikal MJ. Mechanism of protein stabilization by sugars during freeze-drying and storage: Native structure preservation, specific interaction, and/or immobilization in a glassy matrix? J Pharm Sci. 2005;94:1427–1444. doi: 10.1002/jps.20364. [DOI] [PubMed] [Google Scholar]
- 22.Suzuki T, Okazaki M. Thermal stabilizing effect of amorphous matrixes of sugars on freeze-dried proteins. Bull Po Acad Sci: Tech Sci. 2000;48:415–427. [Google Scholar]
- 23.Greiff D. Stabilities of Suspensions of Influenza Virus Dried by Sublimation of Ice In Vacuo to Different Contents of Residual Moisture and Sealed Under Different Gases. Appl Microbiol. 1970;20:935–938. doi: 10.1128/am.20.6.935-938.1970. [DOI] [PMC free article] [PubMed] [Google Scholar]
- 24.Towns JK. Moisture content in proteins: its effects and measurement. J Chromatogr A. 1995;705:115–127. doi: 10.1016/0021-9673(94)01257-f. [DOI] [PubMed] [Google Scholar]
- 25.Croyle MA, Cheng X, Wilson JM. Development of formulations that enhance physical stability of viral vectors for gene therapy. Gene Ther. 2001;8:1281–1290. doi: 10.1038/sj.gt.3301527. [DOI] [PubMed] [Google Scholar]
- 26.Ray SD, Fariss MW. Role of Cellular Energy Status in Tocopheryl Hemisuccinate Cytoprotection Against Ethyl Methanesulfonate-Induced Toxicity. Arch Biochem Biophys. 1994;311:180–190. doi: 10.1006/abbi.1994.1224. [DOI] [PubMed] [Google Scholar]
- 27.Greiff D. Protein structure and freeze-drying: The effects of residual moisture and gases. Cryobiology. 1971;8:145–152. doi: 10.1016/0011-2240(71)90022-8. [DOI] [PubMed] [Google Scholar]
- 28.Karel M, Labuza TP, Maloney JF. Chemical changes in freeze-dried foods and model systems. Cryobiology. 1967;3:288–296. [Google Scholar]
- 29.Sherwin CP, Labuza TP. Role of Moisture in Maillard Browning Reaction Rate in Intermediate Moisture Foods: Comparing Solvent Phase and Matrix Properties. J Food Sci. 2003;68:588–593. [Google Scholar]
- 30.Labuza TP, Hyman CR. Moisture migration and control in multi-domain foods. Trends Food Sci Technol. 1998;9:47–55. [Google Scholar]
- 31.Schaich KM, Packer L, Glazer AN. Preparation of metal-free solutions for studies of active oxygen species. Methods Enzymol. 1990;186:121–125. doi: 10.1016/0076-6879(90)86099-h. [DOI] [PubMed] [Google Scholar]
- 32.Gao X, Huang L. A novel cationic liposome reagent for efficient transfection of mammalian cells. Biochem Biophys Res Commun. 1991;179:280–285. doi: 10.1016/0006-291x(91)91366-k. [DOI] [PubMed] [Google Scholar]
- 33.Hyde SC, Gill DR, Higgins CF, Trezise AEO, MacVinish LJ, Cuthbert AW, Ratcliff R, Evans MJ, Colledge WH. Correction of the ion transport defect in cystic fibrosis transgenic mice by gene therapy. Nature. 1993;362:250–255. doi: 10.1038/362250a0. [DOI] [PubMed] [Google Scholar]
- 34.Caplen NJ, Alton EWFW, Mddleton PG, Dorin JR, Stevenson BJ, Gao X, Durham SR, Jeffery PK, Hodson ME, Coutelle C, Huang L, Porteous DJ, Williamson R, Geddes DM. Liposome-mediated CFTR gene transfer to the nasal epithelium of patients with cystic fibrosis. Nat Med. 1995;1:39–46. doi: 10.1038/nm0195-39. [DOI] [PubMed] [Google Scholar]
- 35.Alton EWFW, Middleton PG, Caplen NJ, Smith SN, Steel DM, Munkonge FM, Jeffery PK, Geddes DM, Hart SL, Williamson R, Fasold KI, Miller AD, Dickinson P, Stevenson BJ, McLachlan G, Dorin JR, Porteous DJ. Non–invasive liposome–mediated gene delivery can correct the ion transport defect in cystic fibrosis mutant mice. Nat. Genet. 1993;5:135–142. doi: 10.1038/ng1093-135. [DOI] [PubMed] [Google Scholar]
- 36.Schreier H, Gagné L, Bock T, Erdos GW, Druzgala P, Conary JT, Müller BW. Physicochemical properties and in vitro toxicity of cationic liposome cDNA complexes. Pharm Acta Helv. 1997;72:215–223. doi: 10.1016/s0031-6865(97)00019-8. [DOI] [PubMed] [Google Scholar]
- 37.Armstrong TK, Anchordoquy TJ. Immobilization of nonviral vectors during the freezing step of lyophilization. J Pharm Sci. 2004;93:2698–2709. doi: 10.1002/jps.20177. [DOI] [PubMed] [Google Scholar]
- 38.May JC, Grim E, Wheeler RM, West J. Determination of residual moisture in freeze-dried viral vaccines: Karl Fischer, gravimetric and thermogravimetric methodologies. J Biol Stand. 1982;10:249–259. doi: 10.1016/s0092-1157(82)80026-7. [DOI] [PubMed] [Google Scholar]
- 39.Lloyd RS, Haidle CW, Robberson DL. Bleomycin-specific fragmentation of double-stranded DNA. Biochemistry. 1978;17:1890–1896. doi: 10.1021/bi00603a014. [DOI] [PubMed] [Google Scholar]
- 40.Allison SD, Molina MC, Anchordoquy TJ. Stabilization of lipid/DNA complexes during the freezing step of the lyophilization process: the particle isolation hypothesis. Biochim Biophys Acta. 2000;1468:127–138. doi: 10.1016/s0005-2736(00)00251-0. [DOI] [PubMed] [Google Scholar]
- 41.Molina MDC, Anchordoquy TJ. Metal contaminants promote degradation of lipid/DNA complexes during lyophilization. Biochim Biophys Acta, Biomembr. 2007;1768:669–677. doi: 10.1016/j.bbamem.2006.12.004. [DOI] [PMC free article] [PubMed] [Google Scholar]
- 42.Pikal MJ, Shah S, Roy ML, Putman R. The secondary drying stage of freeze drying: drying kinetics as a function of temperature and chamber pressure. Int J Pharm. 1990;60:203–207. [Google Scholar]
- 43.Evans RK, Xu Z, Bohannon KE, Wang B, Bruner MW, Volkin DB. Evaluation of degradation pathways for plasmid DNA in pharmaceutical formulations via accelerated stability studies. J Pharm Sci. 2000;89:76–87. doi: 10.1002/(SICI)1520-6017(200001)89:1<76::AID-JPS8>3.0.CO;2-U. [DOI] [PubMed] [Google Scholar]
- 44.Yu J, Anchordoquy TJ. Synergistic effects of surfactants and sugars on lipoplex stability during freeze-drying and rehydration. J Pharm Sci. 2008 doi: 10.1002/jps.21564. In Press. [DOI] [PMC free article] [PubMed] [Google Scholar]
- 45.Abdul-Fattah AM, Truong-Le V, Yee L, Nguyen L, Kalonia DS, Cicerone MT, Pikal MJ. Drying-Induced Variations in Physico-Chemical Properties of Amorphous Pharmaceuticals and Their Impact on Stability (I): Stability of a Monoclonal Antibody. J Pharm Sci. 2007;96:1983–2008. doi: 10.1002/jps.20859. [DOI] [PubMed] [Google Scholar]
- 46.Abdul-Fattah AM, Truong-Le V, Yee L, Pan E, Ao Y, Kalonia DS, Pikal MJ. Drying-Induced Variations in Physico-Chemical Properties of Amorphous Pharmaceuticals and Their Impact on Stability II: Stability of a Vaccine. Pharm Res. 2007;24:715–727. doi: 10.1007/s11095-006-9191-2. [DOI] [PubMed] [Google Scholar]
- 47.Abdul-Fattah AM, Lechuga-Ballesteros D, Kalonia DS, Pikal MJ. The Impact of Drying Method and Formulation on the Physical Properties and Stability of Methionyl Human Growth Hormone in the Amorphous Solid State. J Pharm Sci. 2008;97:163–184. doi: 10.1002/jps.21085. [DOI] [PubMed] [Google Scholar]
- 48.Abdul-Fattah AM, Dellerman KM, Bogner RH, Pikal MJ. The Effect of Annealing on the Stability of Amorphous Solids: Chemical Stability of Freeze-Dried Moxalactam. J Pharm Sci. 2007;96:1237–1250. doi: 10.1002/jps.20947. [DOI] [PubMed] [Google Scholar]
- 49.Luthra SA, Hodge IM, Utz M, Pikal MJ. Correlation of Annealing with Chemical Stability in Lyophilized Pharmaceutical Glasses. J Pharm Sci. 2008;97:5240–5251. doi: 10.1002/jps.21391. [DOI] [PubMed] [Google Scholar]
- 50.Chang L, Shepherd DA, Sun J, Tang X, Pikal MJ. Effect of Sorbitol and Residual Moisture on the Stability of Lyophilized Antibodies: Implications for the Mechanism of Protein Stabilization in the Solid State. J Pharm Sci. 2005;94:1445–1455. doi: 10.1002/jps.20363. [DOI] [PubMed] [Google Scholar]
- 51.Oku K, Watanabe H, Kubota M, Fukuda S, Kurimoto M, Tsujisaka Y, Komori M, Inoue Y, Sakurai M. NMR and Quantum Chemical Study on the OH...pi and CH...O Interactions between Trehalose and Unsaturated Fatty Acids: Implication for the Mechanism of Antioxidant Function of Trehalose. J Am Chem Soc. 2003;125:12739–12748. doi: 10.1021/ja034777e. [DOI] [PubMed] [Google Scholar]
- 52.de Fougerolles AR. Delivery Vehicles for Small Interfering RNA In Vivo. Human Gene Ther. 2008;19:125–132. doi: 10.1089/hum.2008.928. [DOI] [PubMed] [Google Scholar]


