Abstract
Expression of TMEM16A protein is associated with the activity of Ca2+-activated Cl− channels. TMEM16A primary transcript undergoes alternative splicing. thus resulting in the generation of multiple isoforms. We have determined the pattern of splicing and assessed the functional properties of the corresponding TMEM16A variants. We found three alternative exons, 6b, 13, and 15, coding for segments of 22, 4, and 26 amino acids, respectively, which are differently spliced in human organs. By patch clamp experiments on transfected cells, we found that skipping of exon 6b changes the Ca2+ sensitivity by nearly 4-fold, resulting in Cl− currents requiring lower Ca2+ concentrations to be activated. At the membrane potential of 80 mV, the apparent half-effective concentration decreases from 350 to 90 nm when the segment corresponding to exon 6b is excluded. Skipping of exon 13 instead strongly reduces the characteristic time-dependent activation observed for Ca2+-activated Cl− channels at positive membrane potentials. This effect was also obtained by deleting only the second pair of amino acids corresponding to exon 13. Alternative splicing appears as an important mechanism to regulate the voltage and Ca2+ dependence of the TMEM16A-dependent Cl− channels in a tissue-specific manner.
INTRODUCTION
Ca2+-activated Cl− channels (CaCCs)2 play a major physiological role in various types of cells and tissues (1–4). In epithelial cells, opening of CaCCs in the apical membrane generates a flux of Cl− that drives transepithelial water transport. The resulting CaCC-dependent electrolyte/fluid secretion is one of the mechanisms responsible for exocrine secretion in many types of glands and for hydration of the airway surface (2). In particular, the activity of CaCC and of the cystic fibrosis transmembrane conductance regulator chloride channel controls the thickness of the periciliary fluid that is important for optimal mucociliary clearance (5, 6). Deficit in cystic fibrosis transmembrane conductance regulator activity, which occurs in cystic fibrosis, favors bacterial colonization of the airways. Under such conditions, activity of CaCCs may be important in compensating, at least partially, the defect in Cl− transport. In smooth muscle cells, activation of CaCCs is important in the process of contraction (1, 7, 8). CaCCs are also present in olfactory receptors, in dorsal root ganglion neurones, and in oocytes (3, 4, 9, 10). The biophysical properties of CaCCs are not homogeneous among different cells and tissues. In many cases, CaCCs are activated by Ca2+ in a wide range of concentrations between 0.06 and 1 μm (11–14) and are also voltage-dependent, with membrane depolarization increasing the activity (7, 10–16). However, CaCCs that need much higher Ca2+ concentration (9, 17, 18) and that are devoid of voltage dependence are also known (9, 17, 19). Moreover, the mechanism of regulation by Ca2+ is unclear. In some studies, Ca2+ seems to activate the channels through calmodulin (20). In others, activation requires the intervention of a Ca2+/calmodulin-dependent kinase (19, 21). Finally, there are cell types where phosphorylation has actually an inhibitory effect on CaCCs (7, 8, 14). The differences may be due to heterogeneity of the proteins that actually constitute the CaCCs.
Until recently, the molecular identity of CaCCs was a controversial issue, with ClCA proteins, ClC3, and bestrophins being postulated as possible candidates (1, 22). Three recent studies, including one from our laboratory, have identified the TMEM16A protein (also known as ANO-1) as a probable CaCC (23–25). TMEM16A is a membrane protein with eight putative transmembrane segments belonging to a family including other nine members (TMEM16B–K). In our previous study (23), we identified several TMEM16A transcripts probably generated by selection of alternative splice sites. The alternative sequences coded for protein segments that we named a (116 residues), b (22 residues), c (4 residues), and d (26 residues). The former two segments are localized in the N terminus, whereas the latter two segments are localized in the first intracellular loop.
A TMEM16A mouse knock-out model has been also generated. The phenotype of these animals is severe and characterized by altered formation of tracheal cartilage rings (26). This alteration, causing airway collapse, may be responsible for animal death within the first month of life. However, because of CaCC importance in many organs, it cannot be excluded that other severe alterations are also contributing to decreased vitality of the knock-out mouse. TMEM16A knock-out mice have significantly reduced Ca2+-dependent Cl− secretion and increased accumulation of mucus in the airways (26).
The aim of our study was to analyze the pattern of TMEM16A splicing in different human organs and to evaluate the functional consequences of alternative splicing on TMEM16A-dependent channels. Alternative splicing of pre- mRNA is an important mechanism to expand proteome diversity and regulate tissue-specific expression. Alternative splicing events include alternative exon selection, usage of alternative 3′ or 5′ splice sites, retention of intronic sequences, and usage of different promoters. Even if the majority of human genes are alternatively spliced, only for a limited number of them the functional consequences at the protein level are known.
In this study, we have identified three exons, 6b, 13, and 15 (corresponding to segments b, c, and d, respectively) whose splicing is differentially processed among various organs. We have found that segment b (exon 6b) and segment c (exon 13) influence the Ca2+ sensitivity and voltage dependence of TMEM16A-dependent currents, respectively. Our findings indicate that alternative splicing of the TMEM16A gene regulates CaCC function.
EXPERIMENTAL PROCEDURES
Analysis of TMEM16A Splicing
One milligram of total RNA derived from 20 different human tissues (First Choice Human Total RNA Survey Panel; Ambion) was reverse-transcribed using random primers and Moloney murine leukemia virus enzyme (Invitrogen) and subsequently amplified by PCR with a set of primers specific for each alternatively spliced exon. Conditions for PCR were the following: for exon 6b and exon 13, 94 °C for 3 min for the initial denaturation; 94 °C for 45 s, 58 °C for 45 s, and 72 °C for 1 min for 35 cycles; and 72 °C for 10 min for the final extension. For exon 15, 94 °C for 3 min for the initial denaturation; 94 °C for 30 s, 58 °C for 30 s, and 72 °C for 45 s for 35 cycles; and 72 °C for 10 min for the final extension. We used the following sense and antisense primers: for exon 6b, 803D (5′-CGGAGCACGATTGTCTATGA-3′) and 1385R (5′-GGGCCATGAAGACAGAGAAG-3′); for exon 13, 1368D (5′-TCTCTGTCTTCATGGCCCTC-3′) and 1525R (5′-CTCCAAGACTCTGGCTTCGT-3′); and for exon 15, 1506D (5′- ACGAAGCCAGAGTCTTGGAG-3′) and 1894R (5′-CAAACTTCAGCAGGAAAGCC-3′).
The amplified products were resolved on 1.5% agarose gels for exons 6b and 15 and on 3% agarose gel for exon 13, and their identity was verified by sequencing. The percentage of exon inclusion was measured considering the intensity of the plus and minus bands quantitated using ImageJ 1.38 software (National Institutes of Health). The results are expressed as mean ± S.D. of three independent experiments done in duplicate. Bioinformatic search of possible alternative splicing variants was performed by the ENSEMBL and University of California, Santa Cruz (UCSC) Genome Bioinformatic data bases.
TMEM16A Expression Vectors
The coding sequences for TMEM16A(abc) and TMEM16(ac) were cloned in the pcDNA3.1 plasmid as described previously (23). TMEM16A(ab) and the mutants ΔEA and ΔVK were generated from the TMEM16A(abc) construct using the QuikChange XL site-directed mutagenesis kit (Stratagene).
Yellow Fluorescent Protein Assay
The activity of Ca2+-dependent Cl− channels was measured with the halide-sensitive yellow fluorescent protein (YFP) assay in HEK-293 cells as described in detail previously (23). Briefly, cells plated in 96-well microplates were co-transfected with plasmids coding for the halide-sensitive YFP and the TMEM16A isoforms using Lipofectamine 2000. After 48 h, channel activity was measured as the rate of fluorescence quenching caused by the addition of I− (100 mm) in the extracellular solution, with and without 1 μm ionomycin.
Patch Clamp Experiments
Whole cell membrane currents were recorded in HEK-293 and Fischer rat thyroid (FRT) cells after transient and stable transfection, respectively, as described previously (23). The extracellular solution had the following composition: 150 mm NaCl, 1 mm CaCl2, 1 mm MgCl2, 10 mm glucose, 10 mm mannitol, 10 mm Na-HEPES (pH 7.4). The pipette (intracellular) solution contained 130 mm CsCl, 10 mm EGTA, 1 mm MgCl2, 10 mm HEPES, 1 mm ATP (pH 7.4) plus CaCl2 to obtain the desired free Ca2+ concentration: 1 mm for 8 nm, 6 mm for 115 nm, 8 mm for 305 nm, 9 mm for 685 nm, and 9.5 mm for 1.25 μm (calculated with Patcher's Power Tool developed by Dr. Francisco Mendes and Franz Wurriehausen, Max Planck Institute for Biophysical Chemistry, Gottingen, Germany). Accordingly, the final Cl− concentration in the pipette solution was 134, 144, 148, 150, and 151 mm, respectively.
During experiments, the membrane capacitance and series resistance were analogically compensated using the circuitry provided by the EPC7 patch clamp amplifier. The protocol for stimulation consisted in 600-ms-long voltage steps from −100 to 100 mV in 20-mV increments starting from a holding potential of −60 mV. The waiting time between steps was 4 s. Membrane currents were filtered at 1 kHz and digitized at 5 kHz with an ITC-16 (Instrutech) AD/DA converter. Data were analyzed using the Igor software (Wavemetrics) supplemented by custom software kindly provided by Dr. Oscar Moran. Data are reported as representative traces or mean ± S.E. Membrane current and conductance values are normalized for membrane capacitance (14.4 ± 0.8 and 13.7 ± 1.2 picofarads for HEK-293 and FRT cells, respectively).
Immunofluorescence
FRT cells, stably transfected with different TMEM16A isoforms, were fixed in 25% acetic acid/75% ethanol (v/v) for 10 min. After washing in phosphate-buffered saline, cells were incubated for 2 h at room temperature in 1% bovine serum albumin (Sigma-Aldrich) in phosphate-buffered saline. Cells were then incubated overnight at 4 °C with 2 μg/ml primary antibody for TMEM16A (Ab53212; Abcam) in 0.3% (v/v) of Triton X-100 plus 1% bovine serum albumin in phosphate-buffered saline. After washing, the cells were incubated with a goat anti-rabbit antibody (1:200 dilution) conjugated with Alexa Fluor 488 (Invitrogen) for 1 h at room temperature. After further washing, the cells were counterstained with DAPI to label nuclei. Images were taken with an Olympus IX 50 fluorescence microscope equipped with a ×40 objective and a Coolspan camera (Photometrics). All images were acquired with MetaMorph software using a fixed exposure time and gain. Overlap of immunostained and DAPI-stained images was done with ImageJ software.
Data Analysis and Statistics
Data are reported as representative traces and as mean ± S.E., except where indicated. To determine the significance of differences between groups of data, we used Student's t test with Statview software.
RESULTS
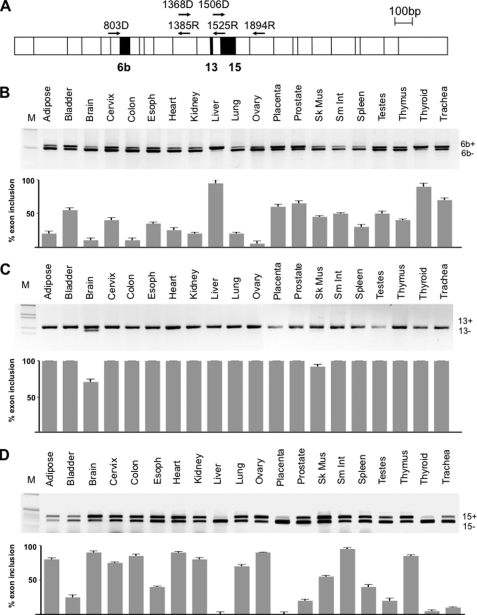
Bioinformatic analysis of the TMEM16A locus with ENSEMBL and UCSC databases revealed that the alternative segments b, c, and d that we identified previously (23) correspond to exons 6b, 13, and 15, respectively (Fig. 1A). In contrast, skipping of segment a is the result of the usage of an alternative promoter. Comparative analysis at the DNA level showed no conservation of the alternative promoter, and attempts to amplify this transcript in different human RNA tissues and cell lines were unsuccessful, suggesting a very restricted cell type-, developmental stage-, or signal-regulated expression. On the contrary, RT-PCR amplification of the three evolutionary conserved exons 6b, 13, and 15 showed different patterns of expression in normal adult human tissues (Fig. 1). Exon 6b is nearly completely included in thyroid and liver, it represents nearly 70% of the transcripts in placenta, prostate, and trachea and is present in lower amounts in all of the other human samples (Fig. 1B). Exon 13 showed a strict tissue-specific alternative splicing regulation: TMEM16A mRNAs lacking exon 13 were observed only in brain and skeletal muscle where they represent ∼25 and 10% of total transcripts, respectively (Fig. 1C). Exon 15 was virtually absent in liver, placenta, and thyroid gland, present in low amounts (below 25%) in bladder, prostate, testis, and trachea, and significantly included (more than 70%) in 10 samples, including adipose tissue, brain, cervix, colon, heart, kidney, lung, ovary, small intestine, and thymus (Fig. 1D).
FIGURE 1.
Alternative splicing pattern of TMEM16A. A, schematic representation of TMEM16A coding sequence structure showing the constitutive and alternative spliced exons in white and black boxes, respectively. Exons 6b, 13, and 15 are 66 bp, 12 bp, and 78 bp, respectively. The small black superimposed arrows represent the positions of the primers used for the RT-PCR analysis. B–D, splicing pattern of exons 6b, 13, and 15, respectively. The upper part of each panel corresponds to the RT-PCR-amplified bands run on an agarose gel and stained with ethidium bromide; the lower graphs represent the percentage of exon inclusion for each tissue expressed as mean ± S.D. of three independent experiments done in duplicate. A panel of total human RNAs (20 different normal human tissues) was analyzed with the following primers: 803D and 1385R for exon 6b, 1368D and 1525R for exon 13, and 1506D and 1894R for exon 15. The identity of the transcripts was verified by direct sequencing, and the inclusion (ex+) or exclusion forms (ex−) are indicated. M, molecular 1-kb marker.
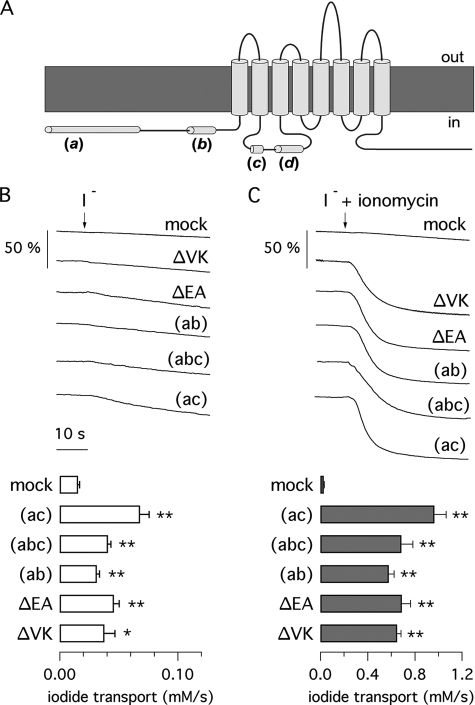
Fig. 2A shows the putative topology of the TMEM16A protein with the localization of alternative segments. We performed a series of functional assays to evaluate the effect of inclusion/skipping of these protein regions. In particular, we focused on segments b and c because segment d did not appear to change the TMEM16A activity in a significant way. Indeed, expression of the (abc) and (abcd) proteins induced expression of Cl− currents having similar appearance (23). Fig. 2, B and C, shows data obtained by measuring anion transport with the halide-sensitive YFP assay in TMEM16A-transfected HEK-293 cells. In this assay, exposure of cells to an iodide-rich solution in the presence of ionomycin (1 μm) causes a fast fluorescence quenching due to a large iodide influx through CaCCs. Transfection with TMEM16A(abc), (ac), and (ab) elicited a large CaCC activity as evident from the rate of fluorescence quenching. Within 40 s of the addition of iodide plus ionomycin, more than 80% of cell fluorescence disappeared in TMEM16A-expressing cells in contrast to less than 10% in mock-transfected cells (Fig. 2C). We also transfected HEK-293 cells with two TMEM16A(abc) constructs lacking the first pair or the second pair of the four residues (EAVK) composing segment c (named ΔEA and ΔVK, respectively). These two constructs also elicited a large iodide influx in HEK-293 cells. Interestingly, iodide transport in the absence of ionomycin, although very small, was significantly larger in TMEM16A-expressing cells than in mock-transfected cells (Fig. 2B), suggesting a low but significant level of activity under unstimulated conditions.
FIGURE 2.
Anion transport by TMEM16A isoforms. A, putative topology of the TMEM16A protein with the localization of the alternative segments a, b, c, and d. Inclusion/skipping of segments b, c, and d is due to alternative splicing of exons 6b, 13, and 15, respectively. Instead, skipping of segment a occurs by usage of an alternative promoter. B and C, representative traces (upper) and calculated I− transport (lower) from experiments with the halide-sensitive YFP assay in transiently transfected HEK-293 cells. Cells expressing the indicated TMEM16A constructs were exposed to extracellular I− (arrows) in the absence or presence of 1 μm ionomycin. The Ca2+ elevation triggered by ionomycin evoked a strong increase in I− transport as evident from the sharp decrease in cell fluorescence. *, p < 0.05; **, p < 0.01 versus mock-transfected cells (n = 5–10).
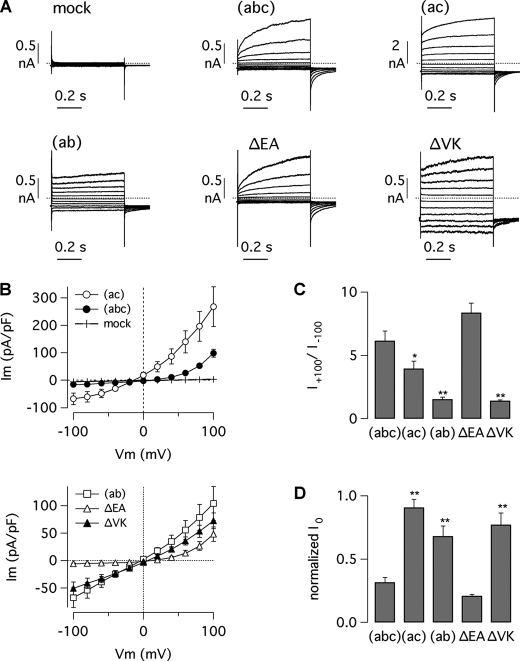
To investigate the functional role of alternative segments, we studied TMEM16A isoforms by the whole cell patch clamp technique. The first set of experiments was carried out on transiently transfected HEK-293 cells with a fixed free Ca2+ concentration (305 nm) in the intracellular solution. The (abc) variant (ex6b+/ex13+/ex15−) generated membrane currents that were similar to those described previously (Fig. 3A) (23). At negative membrane potentials, the amplitude of the currents was small, but stepping the applied membrane potential to the most positive values elicited large outward currents that consisted of an instantaneous component followed by a slowly activating current. Consequently, the current-voltage relationship of the (abc) isoform had a strong outward rectification, the ratio of the current measured at +100 mV to the current measured at −100 mV (rectification index: I+100/I−100) being 6.2 ± 0.8 (Fig. 3, B and C). Returning the membrane voltage from positive values to the holding potential of −60 mV evoked tail currents, i.e. inward currents that were maximal at the beginning and decayed in a single exponential fashion to the resting state (not shown). The currents generated by transfection of the (ac) isoform (ex6b−/ex13+/ex15−) showed different characteristics. First, they were much larger in absolute terms compared with those associated with TMEM16A(abc) (Fig. 3, A and B). Second, the (ac)-dependent currents were also proportionally larger at negative membrane potentials, thus resulting in a reduced rectification index (Fig. 3C). Indeed, I+100/I−100 was 3.9 ± 0.6 for TMEM16A(ac) (p < 0.05 versus TMEM16A(abc)). Finally, (abc) and (ac) isoforms differed in the relative extent of the two current components at positive membrane potentials. Indeed, the instantaneous current was relatively larger for the (ac) isoform. The normalized instantaneous current (I0) at +100 mV, i.e. the current at the beginning of the pulse relative to the total current measured at the end of the pulse, was 0.32 ± 0.04 for TMEM16A(abc) and 0.91 ± 0.06 for TMEM16A(ac) (p < 0.01) (Fig. 3D). This difference suggests that TMEM16A(ac)-dependent channels are significantly more active at the holding potential (−60 mV) than those associated with TMEM16A(abc), thus resulting in a proportionally larger instantaneous current and smaller time-dependent activation at positive membrane potentials.
FIGURE 3.
Properties of TMEM16A-dependent currents in HEK-293 cells. A, whole cell membrane currents in HEK-293 cells transiently transfected with the indicated isoforms and mutants. Membrane currents were elicited by stepping membrane potential from −100 to 100 mV in 20-mV increments from a holding potential of −60 mV. Dotted lines indicate the zero-current level. The intracellular free Ca2+ concentration was 305 nm. B, current-voltage relationships determined for the various isoforms and mutants. Current amplitudes were measured at the end of test pulses. pF, picofarads. C, rectification index determined as the ratio of the current measured at +100 mV to the current measured at −100 mV. *, p < 0.05; **, p < 0.01 versus (abc) isoform. D, normalized instantaneous current (i.e. the ratio of the current at the beginning to that at the end of the voltage pulse). **, p < 0.01 versus (abc) isoform. Data in B–D are mean ± S.E. (n = 12–26).
Expression of TMEM16A(ab), lacking the four amino acids (EAVK) corresponding to segment c (ex6b+/ex13−/ex15−), elicited membrane currents with a decreased voltage dependence. The currents elicited at +100 and +80 mV had little time-dependent activation (Fig. 3A). Indeed, the I0 at +100 mV was 0.68 ± 0.08 (Fig. 3D). Furthermore, the (ab) isoform generated relatively large currents at negative membrane potentials. Therefore, the rectification index I+100/I−100 was only 1.5 ± 0.2, significantly smaller than the (ac) and the (abc) isoforms (Fig. 3C). Such findings indicate that the absence of segment c abolishes most of the outward rectification that is characteristic of the (abc) isoform. Interestingly, when the first two residues of segment c were removed by deletion (ΔEA), the resulting currents did not differ from those associated with TMEM16A(abc) in terms of time-dependent activation at positive potentials and outward rectification (Fig. 3, A–D). In contrast, removal of the second two amino acids (ΔVK) produced currents that were indistinguishable from those associated with TMEM16A(ab).
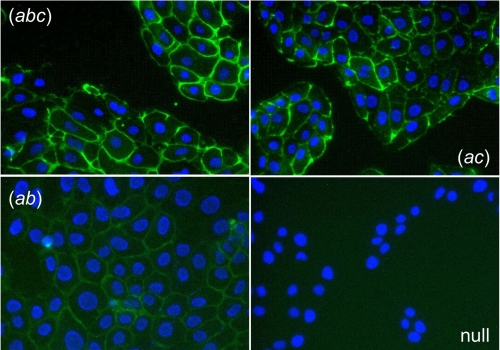
To explore the properties of TMEM16A isoforms further, we expressed them stably in FRT cells. Fig. 4 shows the pattern of TMEM16A protein subcellular localization as determined by immunofluorescence. Cells expressing the isoforms (abc), (ac), and (ab) showed a clear staining of the cell periphery consistent with a localization in the plasma membrane. However, cells expressing TMEM16(ab) showed a weaker staining (Fig. 4), possibly because of a lower expression level in this particular clone.
FIGURE 4.
Detection of TMEM16A protein by immunofluorescence. FRT cells with stable expression of TMEM16A isoforms (abc), (ac), and (ab) or null FRT cells were immunostained with an antibody against the TMEM16A protein (green). The nuclei were counterstained in blue. The images are representative of three separate experiments.
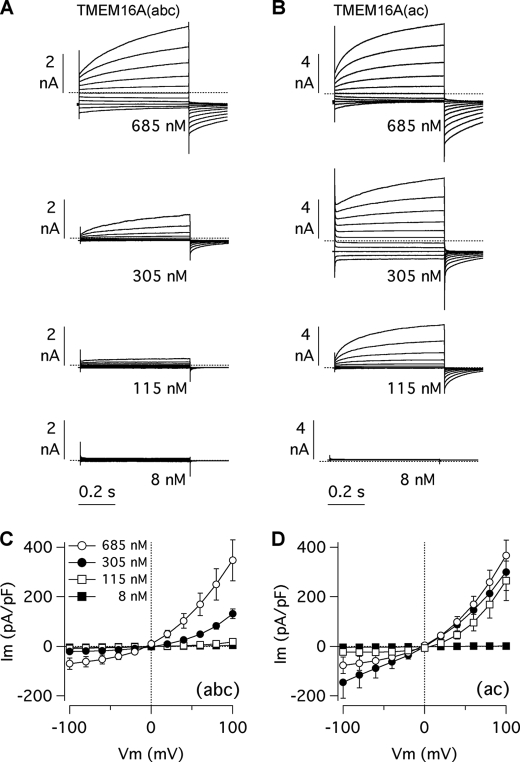
Whole cell patch clamp recordings were performed on stable transfected FRT cells using various concentrations of free Ca2+ in the intracellular solution. Fig. 5, A and B, shows a comparison of the properties for TMEM16A(abc) and (ac) isoforms. At 8 nm, both isoforms showed negligible activity. However, a marked difference appeared at higher Ca2+ concentrations. At 115 and 305 nm, the outward currents at positive membrane potentials were larger for TMEM16A(ac) relative to the (abc) variant (Fig. 5, A and B). At 305 nm, TMEM16A(ac)-expressing cells showed also significant inward currents at negative potentials (Fig. 5B). In contrast, the (abc) isoform showed significant inward currents only when the Ca2+ concentration was increased to 685 nm (Fig. 5A). With some approximation, the currents of the (abc) isoform at 685 nm Ca2+ were similar to those of the (ac) isoform at 305 nm Ca2+ (Fig. 5, A and B). Data from all experiments are summarized in the current-voltage relationships of Fig. 5, C and D. It is evident that the range of intracellular Ca2+ concentrations required for current activation is different between the two variants. At positive membrane potentials, 115 nm intracellular Ca2+ was enough to activate TMEM16A(ac) strongly in contrast to TMEM16A(abc), which remained largely inactive. With 305 nm, the amplitude of TMEM16A(abc) currents at positive membrane potentials was less than half of that measured with 685 nm intracellular Ca2+ (Fig. 5C). In contrast, the size of the currents for TMEM16A(ac) at these two Ca2+ concentrations was similar (Fig. 5D). Another difference between the isoforms regards the aspect of the currents at negative membrane potentials. The (ac) variant showed particularly large inward currents when the intracellular Ca2+ concentration was 305 nm, thus resulting in a markedly reduced rectification of the current-voltage relationship compared with TMEM16A(abc) under the same conditions (Fig. 5, C and D). This characteristic is consistent with the data obtained in HEK-293 cells (Fig. 3, A–C). However, we noted that at 685 nm the amplitude of the (ac) inward currents decreased with respect to 305 nm. This behavior is evident from the trace in Fig. 5B where the currents at the most negative potentials appear to deactivate more at 685 than at 305 nm. This type of deactivation at high Ca2+ concentrations has been described previously for native CaCCs (10, 12, 27) and for TMEM16B (28).
FIGURE 5.
Membrane currents elicited by (abc) and (ac) isoforms. A and B, whole cell membrane currents recorded at the indicated intracellular Ca2+ concentrations in FRT cells with stable expression of (abc) and (ac) variants, respectively. Currents were evoked with the same voltage protocol described for Fig. 3. Dotted lines are the zero-current level. C and D, current-voltage relationships for the two isoforms at the indicated intracellular Ca2+ concentrations. pF, picofarads. Current amplitudes were measured at the end of test pulses (mean ± S.E., n = 10–31).
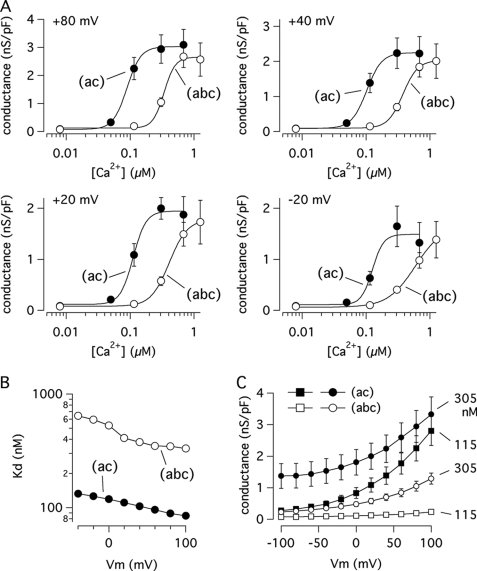
To explore the Ca2+ sensitivity of TMEM16A(ac) and TMEM16A(abc) further, we measured the instantaneous tail current that is recorded at the holding potential of −60 mV after the end of the test pulses. Under these conditions, the tail current peak reflects the open probability reached by the channels during the preceding test pulse at the various membrane potentials. The conductance calculated from the current at −60 mV was plotted versus the Ca2+ concentration for the two isoforms (Fig. 6A). It is evident that at all membrane potentials the Ca2+ dependence of the two isoforms is significantly different, with TMEM16A(ac) being more Ca2+-sensitive than the (abc) variant. The data for the two isoforms obtained at membrane potentials between −40 and +100 mV could be reasonably fitted with the Hill equation. At more negative voltages, the (ac) variant showed, as already discussed for the data in Fig. 5, a type of deactivation observed as a decrease in conductance when the Ca2+ concentration was increased from 305 to 685 nm. This behavior impeded a good fit of the data with the Hill function. The Kd values resulting from the fits are plotted versus the applied membrane potential in Fig. 6B. This graphic shows two important features. First, the apparent affinity of the two isoforms for Ca2+ is affected by voltage, although modestly, because Kd increases as the membrane potential is made less positive. Second, at all membrane potentials the Kd for TMEM16A(abc) is nearly 4-fold greater than that for TMEM16A(ac) (Fig. 6B). For example, at +100 mV the values are 332 and 85 nm for (abc) and (ac), respectively. The fits showed for both isoforms a Hill coefficient (nH) higher than one (nH = 4–5 at positive potentials), a sign of cooperativity that has been reported previously for CaCCs.
FIGURE 6.
Ca2+ sensitivity of (abc) and (ac) isoforms. A, plot of membrane conductance (calculated from the tail currents at −60 mV) versus Ca2+ concentration for the two isoforms at various test potentials as indicated. nS/pF, nanosiemens/picofarads. Data obtained from experiments like those shown in Fig. 5 were fitted with the Hill equation to calculate the apparent dissociation constant, Kd. B, plot of Kd values for the two TMEM16A isoforms at various membrane potentials. C, plot of membrane conductance for (abc) and (ac) at two Ca2+ concentrations (115 and 305 nm) versus membrane potential. Data are mean ± S.E. (n = 10–31).
A plot of the conductance versus applied voltage is shown in Fig. 6C. This graphic shows that the activity of the (ac) isoform is particularly large at physiological membrane potentials when the intracellular Ca2+ concentration is increased to 305 nm.
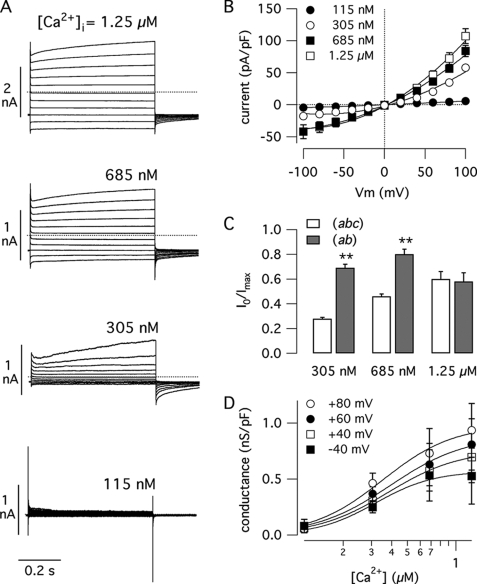
We also studied the characteristics of the currents associated with the (ab) isoform in stably transfected FRT cells (Fig. 7). As shown in the representative traces of Fig. 7A and current-voltage relationships of Fig. 7B, expression of TMEM16A(ab) generated Ca2+-dependent currents. Using a free Ca2+ concentration of 115 nm in the pipette solution, the amplitude of membrane currents was not different from that of null FRT cells. However, significantly larger currents were observed at Ca2+ concentrations equal or higher than 305 nm (Fig. 7, A and B). At maximum Ca2+ concentrations, the currents were nearly 4-fold smaller than those of cells expressing the (abc) and (ac) isoforms (compare with Fig. 5), in agreement with a lower protein expression as shown by immunofluorescence (Fig. 4). Similarly to data obtained in HEK-293 cells, we found that the currents induced by TMEM16A(ab) showed a significantly reduced time-dependent activation at positive membrane potentials (Fig. 7A). On average, the currents associated with TMEM16A(ab) were less voltage-dependent than the other two isoforms, with significantly reduced relaxations at all Ca2+ concentrations and membrane potentials. Because of this difference in voltage dependence, the normalized instantaneous current at 305 and 685 nm Ca2+ was significantly larger for TMEM16A(ab) compared with TMEM16A(abc) (Fig. 7C). At higher Ca2+ concentrations, when TMEM16A(abc) is maximally activated, and therefore with a reduced depolarization-activated current, the difference between the two isoforms disappears (Fig. 7C).
FIGURE 7.
Properties of TMEM16(ab). A, representative whole cell membrane currents recorded in FRT cells with stable expression of TMEM16A(ab) at the indicated intracellular Ca2+ concentrations. B, current-voltage relationships from similar experiments (mean ± S.E., n = 8–13). pF, picofarads. C, normalized instantaneous current at 100 mV (determined as in Fig. 3D) for TMEM16(ab) compared with the (abc) isoform. Asterisks indicate a significant difference (p < 0.01). D, Ca2+ sensitivity of the (ab) isoform. Plot of membrane conductance versus Ca2+ concentration at the indicated membrane potentials is shown (mean ± S.E., n = 8–13).
We determined the Ca2+ sensitivity of TMEM16(ab) by plotting the conductance versus the intracellular Ca2+ concentration at various membrane potentials (Fig. 7D). In contrast to the other two isoforms, the apparent affinity of TMEM16A(ab) for Ca2+ was not affected by membrane potential, the corresponding Kd values remaining in the range 290–360 nm within the interval between −40 and +100 mV (not shown). The average Kd was 321 ± 13 nm, a value close to that determined for TMEM16A(abc) at positive membrane potentials.
DISCUSSION
The identification of TMEM16A as a membrane protein associated with Cl− transport has begun to clarify the molecular identity of Ca2+-dependent Cl− channels (CaCCs) (23–25). Although a definitive proof needs to be provided, it is highly probable that TMEM16A is part of the channel itself. Indeed, overexpression of TMEM16A causes the appearance of whole cell membrane currents with properties similar to those of native CaCCs. Furthermore, site-specific mutagenesis of TMEM16A protein changes the biophysical properties of the associated membrane currents. In our previous article, we reported the existence of multiple TMEM16A isoforms generated by alternative splicing (23). In the present study, we have determined the pattern of TMEM16A splicing in various human organs and assessed the properties of the corresponding TMEM16A variants. By RT-PCR analysis, we found various levels of inclusion/skipping of exons 6b and 15, coding for the segments b and d of our previous study. In particular, we found that some tissues show a coordinated pattern of alternative splicing regarding the 6b and 15 exons. The five tissues that predominantly include exon 6b (liver, placenta, prostate, thyroid, and trachea) tend also to exclude exon 15 from the mature transcript. This is particularly evident in liver and thyroid where TMEM16A mRNAs are almost entirely ex6b+ and ex15−. On the other hand, skipping of exon 6b is associated with exon 15 inclusion in several but not all other tissues. In brain, the majority of the TMEM16A transcripts are ex6b− and ex15+, and this association is clearly evident in adipose tissue, colon, heart, kidney, lung, and ovary (<25% ex6b, >75% ex15). This suggests a possible tight coordination between the exon 6b and exon 15 alternative splicing both in term of splicing regulation and functional properties of the resulting TMEM16A isoforms. Bioinformatic and experimental evidence indeed have shown a correlation between distant alternative splicing events on the same gene, suggesting the presence of a complex mechanism that relies on cis-acting regulatory elements and transcriptional elongation (29).
In contrast to exons 6b and 15, we found a very restricted alternative expression in brain and skeletal muscle of the unusually short exon 13, thus suggesting that its skipping is regulated by tissue-specific regulatory factors. Because of steric interference between splicing complexes that assemble on the donor and acceptor sites, very few exons have a short length, and their regulation seems to be dependent on intronic splicing regulatory sequences. In mammals, several splicing factors are involved in brain- and/or muscle-specific splicing, such as Fox-1/2 (30), PTBP1/2 (PTB/nPTB) (31), CUGBP1/2, NOVA1 (32), and Muscleblind-like (MBNL) family proteins (33). They can positively or negatively affect alternatively spliced events depending on the location of binding cis-acting regulatory sequences on the nascent transcripts (34). Future studies will address the role of these tissue-specific splicing factors and cis-acting regulatory sequences on alternative splicing of TMEM16A exon 13.
Analysis of the functional properties of TMEM16A isoforms revealed important characteristics related to segments b and c. In particular, the skipping of exon 6b, corresponding to a stretch of 22 amino acids localized in the N terminus of the protein, causes a very important change in the Ca2+-dependent sensitivity of the TMEM16A-dependent currents. Compared with TMEM16A(abc), the (ac) variant has 4-fold higher affinity for Ca2+. This higher Ca2+ sensitivity for TMEM16A(ac) is associated with a larger activity of the corresponding channels at negative membrane potentials. Therefore, it may be postulated that regulation of exon 6b splicing has important consequences in the function of CaCCs. Indeed, the inclusion of segment b would generate channels having a higher threshold for activation by Ca2+. Interestingly, CaCCs with various levels of Ca2+ sensitivity have been described in different cells (11–14). The Ca2+ sensitivity ranges from less than 100 nm to more than 1 μm. According to our data, it may be postulated that this variety of Ca2+ sensitivity is due to alternative splicing of the TMEM16A gene and therefore expression in each cell type of one or more isoforms of the protein. Our analysis of TMEM16A splicing also indicates the coexistence in many organs of ex6b+ and ex6b− transcripts. Future studies will need to assess whether the corresponding isoforms, with and without segment b and therefore with different Ca2+ sensitivity, coexist in the same cells or in different cells within the same organ.
Also, the skipping of exon 13 (segment c) has important consequences on the properties of CaCCs. The isoform without segment c, TMEM16A(ab), generates membrane currents with significantly smaller relaxations at positive and negative membrane potentials. Therefore, the corresponding current-voltage relationships have a reduced outward rectification. Interestingly, membrane currents similar to those associated with the absence of segment c in TMEM16A have already been described in some tissues (9, 17, 19). However, our data on the splicing pattern of TMEM16A indicate that skipping of exon 13 is a rare event, occurring only in a small percentage of brain and skeletal muscle transcripts. Therefore, lack of voltage-dependent activation in CaCCs may be due also to other factors that need to be identified (e.g. expression of other channels, posttranslational modifications of TMEM16A, interaction with regulatory proteins).
Because of the dramatic effect of the absence of segment c on channel characteristics, we studied in more detail the role of this TMEM16A domain by deleting the first half or the second half. Deletion of the first two amino acids of segment c did not alter the channel properties relative to the (abc) variant. In contrast, deletion of the second two residues generated membrane currents similar to those associated with deletion of the whole four-residue segment.
Summarizing, we have found that alternative splicing of TMEM16A is an important mechanism to regulate Ca2+-dependent Cl− channel properties. This mechanism may have important physiological consequences in controlling Cl− transport in various organs. Interestingly, previous studies on native CaCCs have reported a variety of different characteristics, including various levels of Ca2+ sensitivity and voltage dependence (1–4). Our results suggest that such different characteristics may actually be caused by the expression of various TMEM16A isoforms. Expression in the same cell type of more than one isoform or assembly of TMEM16A with other proteins, including possibly TMEM16B (28, 35), may lead to whole cell membrane currents with even more complex characteristics. It may be speculated that changes in the status of a cell, such as those associated with proliferation, differentiation, hormonal stimulation, or pathological processes, may cause a shift in the splicing pattern of TMEM16A, thus modifying the properties of CaCCs.
Our findings also provide useful indications to understand the TMEM16A structure-function relationship. Given the lack of TMEM16A sequence homology to other known proteins, there are no hints to identify the regions and mechanisms underlying channel activity regulation. According to our results, segment b (in the N terminus, close to the first transmembrane domain) and segment c (in the first intracellular loop) may be part of protein regions involved in voltage and Ca2+ sensing. Particularly intriguing is the latter segment, consisting of only four amino acids. This site is adjacent to a highly conserved stretch of four glutamic acid residues. Inclusion of segment c (EAVK) adds a fifth glutamic acid that may be important in enhancing the local density of negative charges. Further studies on this protein site may reveal important functions associated with the first intracellular loop of TMEM16A.
The role of alternative splicing on channel characteristics also has important implications for TMEM16A as a possible pharmacological target. The presence of tissue-specific isoforms may allow the design of drugs with a specific action on a given physiological process thus reducing the possibility of side effects.
Acknowledgments
We thank Drs. Gianrico Farrugia and Amelia Mazzone for useful advice on TMEM16A immunostaining.
This work was supported, in whole or in part, by National Institutes of Health Grant P30 DK072517 and by the Cystic Fibrosis Foundation (to L. J. V. G) and the Fondazione Italiana per la Ricerca sulla Fibrosi Cistica (to L. J. V. G. and F. P.).
- CaCC
- Ca2+-activated Cl− channel
- FRT
- Fischer rat thyroid
- RT
- reverse transcription
- YFP
- yellow fluorescent protein.
REFERENCES
- 1.Hartzell C., Putzier I., Arreola J. (2005) Annu. Rev. Physiol. 67, 719–758 [DOI] [PubMed] [Google Scholar]
- 2.Kidd J. F., Thorn P. (2000) Annu. Rev. Physiol. 62, 493–513 [DOI] [PubMed] [Google Scholar]
- 3.Frings S., Reuter D., Kleene S. J. (2000) Prog. Neurobiol. 60, 247–289 [DOI] [PubMed] [Google Scholar]
- 4.Scott R. H., Sutton K. G., Griffin A., Stapleton S. R., Currie K. P. (1995) Pharmacol. Ther. 66, 535–565 [DOI] [PubMed] [Google Scholar]
- 5.Matsui H., Grubb B. R., Tarran R., Randell S. H., Gatzy J. T., Davis C. W., Boucher R. C. (1998) Cell 95, 1005–1015 [DOI] [PubMed] [Google Scholar]
- 6.Tarran R., Loewen M. E., Paradiso A. M., Olsen J. C., Gray M. A., Argent B. E., Boucher R. C., Gabriel S. E. (2002) J. Gen. Physiol. 120, 407–418 [DOI] [PMC free article] [PubMed] [Google Scholar]
- 7.Greenwood I. A., Ledoux J., Leblanc N. (2001) J. Physiol. 534, 395–408 [DOI] [PMC free article] [PubMed] [Google Scholar]
- 8.Wang Y. X., Kotlikoff M. I. (1997) Proc. Natl. Acad. Sci. U.S.A. 94, 14918–14923 [DOI] [PMC free article] [PubMed] [Google Scholar]
- 9.Hallani M., Lynch J. W., Barry P. H. (1998) J. Membr. Biol. 161, 163–171 [DOI] [PubMed] [Google Scholar]
- 10.Kuruma A., Hartzell H. C. (2000) J. Gen. Physiol. 115, 59–80 [DOI] [PMC free article] [PubMed] [Google Scholar]
- 11.Arreola J., Melvin J. E., Begenisich T. (1996) J. Gen. Physiol. 108, 35–47 [DOI] [PMC free article] [PubMed] [Google Scholar]
- 12.Qu Z., Wei R. W., Hartzell H. C. (2003) Am. J. Physiol. Renal Physiol. 285, F326–F335 [DOI] [PubMed] [Google Scholar]
- 13.Boese S. H., Aziz O., Simmons N. L., Gray M. A. (2004) Am. J. Physiol. Renal Physiol. 286, F682–F692 [DOI] [PubMed] [Google Scholar]
- 14.Angermann J. E., Sanguinetti A. R., Kenyon J. L., Leblanc N., Greenwood I. A. (2006) J. Gen. Physiol. 128, 73–87 [DOI] [PMC free article] [PubMed] [Google Scholar]
- 15.Evans M. G., Marty A. (1986) J. Physiol. 378, 437–460 [DOI] [PMC free article] [PubMed] [Google Scholar]
- 16.Nilius B., Prenen J., Szücs G., Wei L., Tanzi F., Voets T., Droogmans G. (1997) J. Physiol. 498, 381–396 [DOI] [PMC free article] [PubMed] [Google Scholar]
- 17.Kleene S. J., Gesteland R. C. (1991) J. Neurosci. 11, 3624–3629 [DOI] [PMC free article] [PubMed] [Google Scholar]
- 18.Gomez-Hernandez J. M., Stühmer W., Parekh A. B. (1997) J. Physiol. 502, 569–574 [DOI] [PMC free article] [PubMed] [Google Scholar]
- 19.Xie W., Kaetzel M. A., Bruzik K. S., Dedman J. R., Shears S. B., Nelson D. J. (1996) J. Biol. Chem. 271, 14092–14097 [DOI] [PubMed] [Google Scholar]
- 20.Kaneko H., Möhrlen F., Frings S. (2006) J. Gen. Physiol. 127, 737–748 [DOI] [PMC free article] [PubMed] [Google Scholar]
- 21.Ho M. W., Kaetzel M. A., Armstrong D. L., Shears S. B. (2001) J. Biol. Chem. 276, 18673–18680 [DOI] [PubMed] [Google Scholar]
- 22.Eggermont J. (2004) Proc. Am. Thorac. Soc. 1, 22–27 [DOI] [PubMed] [Google Scholar]
- 23.Caputo A., Caci E., Ferrera L., Pedemonte N., Barsanti C., Sondo E., Pfeffer U., Ravazzolo R., Zegarra-Moran O., Galietta L. J. (2008) Science 322, 590–594 [DOI] [PubMed] [Google Scholar]
- 24.Schroeder B. C., Cheng T., Jan Y. N., Jan L. Y. (2008) Cell 134, 1019–1029 [DOI] [PMC free article] [PubMed] [Google Scholar]
- 25.Yang Y. D., Cho H., Koo J. Y., Tak M. H., Cho Y., Shim W. S., Park S. P., Lee J., Lee B., Kim B. M., Raouf R., Shin Y. K., Oh U. (2008) Nature 455, 1210–1215 [DOI] [PubMed] [Google Scholar]
- 26.Rock J. R., O'Neal W. K., Gabriel S. E., Randell S. H., Harfe B. D., Boucher R. C., Grubb B. R. (2009) J. Biol. Chem. 284, 14875–14880 [DOI] [PMC free article] [PubMed] [Google Scholar]
- 27.Taleb O., Feltz P., Bossu J. L., Feltz A. (1988) Pfluegers Arch. 412, 641–646 [DOI] [PubMed] [Google Scholar]
- 28.Pifferi S., Dibattista M., Menini A. (2009) Pfluegers Arch. 458, 1023–1038 [DOI] [PubMed] [Google Scholar]
- 29.Fededa J. P., Petrillo E., Gelfand M. S., Neverov A. D., Kadener S., G., Pelisch F., Baralle F. E., Muro A. F., Kornblihtt A. R. (2005) Mol. Cell 19, 393–404 [DOI] [PubMed] [Google Scholar]
- 30.Jin Y., Suzuki H., Maegawa S., Endo H., Sugano S., Hashimoto K., Yasuda K., Inoue K. (2003) EMBO J. 22, 905–912 [DOI] [PMC free article] [PubMed] [Google Scholar]
- 31.Markovtsov V., Nikolic J. M., Goldman J. A., Turck C. W., Chou M. Y., Black D. L. (2000) Mol. Cell. Biol. 20, 7463–7479 [DOI] [PMC free article] [PubMed] [Google Scholar]
- 32.Jensen K. B., Dredge B. K., Stefani G., Zhong R., Buckanovich R. J., Okano H. J., Yang Y. Y., Darnell R. B. (2000) Neuron 25, 359–371 [DOI] [PubMed] [Google Scholar]
- 33.Ladd A. N., Charlet N., Cooper T. A. (2001) Mol. Cell. Biol. 21, 1285–1296 [DOI] [PMC free article] [PubMed] [Google Scholar]
- 34.Ule J., Stefani G., Mele A., Ruggiu M., Wang X., Taneri B., Gaasterland T., Blencowe B. J., Darnell R. B. (2006) Nature 444, 580–586 [DOI] [PubMed] [Google Scholar]
- 35.Stöhr H., Heisig J. B., Benz P. M., Schöberl S., Milenkovic V. M., Strauss O., Aartsen W. M., Wijnholds J., Weber B. H., Schulz H. L. (2009) J. Neurosci. 29, 6809–6818 [DOI] [PMC free article] [PubMed] [Google Scholar]


