

Abstract
To identify metabolic pathways involved in hepatic lipoapoptosis, metabolic flux analysis using [U-13C5]glutamine as an isotopic tracer was applied to quantify phenotypic changes in H4IIEC3 hepatoma cells treated with either palmitate alone (PA-cells) or both palmitate and oleate in combination (PA/OA-cells). Our results indicate that palmitate inhibited glycolysis and lactate dehydrogenase fluxes while activating citric acid cycle (CAC) flux and glutamine uptake. This decoupling of glycolysis and CAC fluxes occurred during the period following palmitate exposure but preceding the onset of apoptosis. Oleate co-treatment restored most fluxes to their control levels, resulting in steatotic lipid accumulation while preventing apoptosis. In addition, palmitate strongly increased the cytosolic NAD+/NADH ratio, whereas oleate co-treatment had the opposite effect on cellular redox. We next examined the influence of amino acids on these free fatty acid-induced phenotypic changes. Increased medium amino acids enhanced reactive oxygen species (ROS) generation and apoptosis in PA-cells but not in PA/OA-cells. Overloading the medium with non-essential amino acids induced apoptosis, but essential amino acid overloading partially ameliorated apoptosis. Glutamate was the most effective single amino acid in promoting ROS. Amino acid overloading also increased cellular palmitoyl-ceramide; however, ceramide synthesis inhibitors had no effect on measurable indicators of apoptosis. Our results indicate that free fatty acid-induced ROS generation and apoptosis are accompanied by the decoupling of glycolysis and CAC fluxes leading to abnormal cytosolic redox states. Amino acids play a modulatory role in these processes via a mechanism that does not involve ceramide accumulation.
INTRODUCTION
Elevated serum free fatty acids (FFAs)4 cause hepatic apoptosis, which is a prominent feature of non-alcoholic steatohepatitis and correlates with disease severity (1). Previous in vitro studies in Chinese hamster ovary (CHO) cells (2, 3), cardiac myocytes (4, 5), pancreatic β-cells (6), breast cancer cells (7), and hepatic cells (8, 9) have demonstrated that saturated fatty acids (SFAs) but not monounsaturated fatty acids (MUFAs) induce reactive oxygen species (ROS) generation and apoptosis, whereas MUFAs predominately induce steatosis. An earlier study showed that MUFA co-treatment changed the palmitate-induced phenotype from apoptosis to steatosis by diverting SFAs into triglyceride synthesis and thereby reducing apoptosis in CHO cells (2). Increasing the desaturation of cellular fatty acids by stearoyl-CoA desaturase overexpression had an effect similar to that of oleate co-treatment in MIN6 cells (6).
Ceramide accumulation has been considered a primary factor responsible for SFA-induced ROS generation and apoptosis, because ceramide is synthesized de novo from palmitate and serine and also has been shown to activate apoptotic signaling (10, 11). Recent studies, however, have reported that SFAs can induce apoptosis through ROS formation (3) and endoplasmic reticulum stress without altering intracellular ceramide levels (12, 13). Thus, a consensus mechanism linking SFA-induced metabolic alterations to apoptosis has been difficult to establish. To further address these questions, we hypothesized that metabolites or pathways other than those involved with ceramide synthesis may influence ROS generation and the resulting cellular phenotypes associated with elevated SFAs.
The influence of non-lipid substrate availability on FFA-induced pathology is another important issue addressed by this study (14). In particular, amino acid availability is known to acutely and chronically regulate hepatic FFA metabolism via changes in both gene expression and metabolic fluxes. An example of the former is provided by the effect of amino acid deprivation to activate the global transcriptional regulator GCN2 (15, 16). Changes in citric acid cycle (CAC) and anaplerotic fluxes have also been observed as a result of varying extracellular amino acid concentrations (17, 18). We hypothesized that altering amino acid levels could be one way to modulate the response of liver cells to elevated FFA concentrations, thereby providing additional insight into the metabolic deviations leading to apoptosis.
In this study, we first applied stable isotope-based comprehensive metabolic flux analysis to assess metabolic perturbations in H4IIEC3 hepatoma cells cultured with different types of FFA (palmitate or oleate). Then we examined the influence of amino acid availability on FFA-induced phenotypes by culturing H4IIEC3 cells under varying levels of amino acids.
EXPERIMENTAL PROCEDURES
Materials
Fumonisin-B1, cycloserine, sphingomyelinase (Bacillus cereus) and free amino acids were purchased from Sigma. Fatty acid-free bovine serum albumin was purchased from JRH Biosciences (Lenexa, KS). C16 and C17 ceramide were purchased from Avanti Polar Lipids (Alabaster, AL). Amino acid-free Dulbecco's modified Eagle's medium (DMEM) was a gift of Ajinomoto Co., Inc. (Tokyo, Japan). [U-13C5]Glutamine (99 atom % 13C) was purchased from Cambridge Isotope Laboratories (Andover, MA). All silylation reagents used in this study were purchased from Pierce.
Human and Rat Plasma Amino Acids
To formulate our growth medium to mimic the composition of physiological fluids, plasma amino acid concentrations were measured in human and rat samples using an L-8800 automatic amino acid analyzer (Hitachi, Tokyo, Japan). A total of 39 healthy volunteer samples and 29 rat samples were used. Blood samples were collected after overnight fasting. Plasma samples were prepared using EDTA as anticoagulant, treated with 2 volumes of 5% (w/w) trichloroacetic acid, and then centrifuged to remove protein as precipitate. The samples obtained were filtered through an Ultrafree-MC centrifugal filter (Millipore, Billerica, MA). To prepare deproteinized tissue extracts, tissues were homogenized with 5% trichloroacetic acid and processed with the same protocol used for plasma. The samples were kept at 4 °C during all steps to minimize chemical reactions of thiol-metabolites and stored at −80 °C. The studies of human and rat amino acid profiling were conducted by Ajinomoto Co., Inc., and protocols were approved by Ajinomoto Ethical and Animal Care Committees.
Cell Culture
H4IIEC3 cells (American Type Culture Collection, Manassas, VA), rat liver hepatomas, were cultured in DMEM supplemented with 10% fetal bovine serum, 50 units/ml penicillin, and 50 units/ml streptomycin sulfate. To examine the influence of medium amino acids on FFA-induced hepatic phenotypes, the medium was changed to a customized medium containing 25 mm glucose, 2.15 mm amino acids, amino acid-free DMEM, 20 mm HEPES, and 0.5% serum replacement 3 with or without FFA-bovine serum albumin complex (palmitate, palmitate plus oleate). Based on a previous paper (19), amino acid composition was designed to resemble human and rat plasma amino acids (Table 1). Total amino acid content or the relative amino acid composition was varied in some experiments to examine the effects of these parameters.
TABLE 1.
Comparison of physiological and medium amino acids
| Amino acid | Plasma |
Culture medium |
||
|---|---|---|---|---|
| Human | Rat | DMEM | This study | |
| μm | μm | |||
| Essential | ||||
| Histidine | 60–120 | 45–90 | 200 | 50 |
| Isoleucine | 40–105 | 30–115 | 800 | 50 |
| Leucine | 85–185 | 40–195 | 800 | 100 |
| Lysine | 125–310 | 80–285 | 800 | 200 |
| Methionine | 15–40 | 30–100 | 200 | 50 |
| Phenylalanine | 40–75 | 34–85 | 400 | 50 |
| Threonine | 70–215 | 55–270 | 800 | 100 |
| Tryptophan | 45–80 | 30–105 | 100 | 50 |
| Valine | 140–360 | 55–235 | 800 | 150 |
| Non-essential | ||||
| Alanine | 220–610 | 220–460 | 0 | 250 |
| Arginine | 45–150 | 36–143 | 400 | 80 |
| Asparagine | 35–90 | 35–58 | 0 | 50 |
| Aspartate | 3–15 | 38–90 | 0 | 20 |
| Cysteine | 10–45 | 10–56 | 200 | 50 |
| Glutamate | 20–120 | 42–94 | 0 | 50 |
| Glutamine | 375–760 | 375–700 | 4000 | 450 |
| Glycine | 160–390 | 105–460 | 400 | 150 |
| Proline | 90–190 | 100–220 | 0 | 100 |
| Serine | 70–215 | 110–210 | 400 | 100 |
| Tyrosine | 40–85 | 30–100 | 400 | 50 |
| Total | 1876–3471 | 1875–3500 | 10700 | 2150 |
| EAA/NEAA | 0.39–0.68 | 0.30–0.66 | 0.84 | 0.59 |
For isotopic analysis of metabolic flux, [U-13C5]glutamine was used as a tracer substrate. Cells were preconditioned for 6 h in unlabeled medium before washing with phosphate-buffered saline and replenishing with medium containing labeled glutamine. Both medium and cellular metabolites were analyzed by GC-MS at 3, 6, and 9 h.
ROS Measurement
Cellular ROS generation was measured using 2′,7′-dichlorodihydrofluoresceindiacetate (Invitrogen) as described previously (20). 2′,7′-Dichlorodihydrofluoresceindiacetate is a non-polar compound that readily diffuses into cells, where it is hydrolyzed by intracellular esterases to the nonfluorescent dichlorodihydrofluorescein and trapped within the cells. In the presence of a proper oxidant, dichlorodihydrofluorescein is oxidized to the highly fluorescent 2,7-dichlorofluorescein. Cells treated with various fatty acids or amino acids were followed by incubation with 10 μm 2′,7′-dichlorodihydrofluoresceindiacetate for 30 min at 37 °C in the dark and then resuspended with Hanks' balanced salt solution. The fluorescence intensity was measured at an excitation/emission wavelength of 490/530 nm using a FusionTM universal microplate analyzer (PerkinElmer Life Sciences).
Nile Red Staining
Cells were cultured in 96-well plates with or without FFA. After a 24-h incubation, cells were stained by Nile red using AdipoRed reagent (Cambrex, East Rutherford, NJ). Intracellular lipid accumulation was observed using a fluorescence microscope and also quantified using a microplate analyzer at an excitation/emission wavelength of 485/590 nm.
Detection of Apoptotic Markers
Caspase-3/7 activities were measured using the Apo-ONE homogeneous caspase-3/7 assay kit (Promega, Madison, WI) according to the manufacturer's protocol. Briefly, cells were cultured in 96-well plates with or without FFA. After a 16-h incubation, cells were lysed with buffer containing caspase substrate benzyloxycarbonyl-DEVD-R100 and incubated at room temperature. Caspase-3/7 activities were detected at an excitation/emission wavelength of 485/535 nm. For DNA laddering analysis, cells were cultured in 12-well plates, and DNA was extracted using a Suicide trackTM DNA ladder isolation kit (EMD Chemicals, San Diego, CA). The isolated DNA fragments were separated in 1.5% agarose gels and detected by SYBR gold (Invitrogen).
Cell Viability
Cultured cells in 96-well plates were washed twice with phosphate-buffered saline and then incubated with serum-free DMEM for 4 h at 37 °C. Cellular metabolic capacity was measured based on resazurin reduction using the CellTiter-Blue® cell viability assay (Promega).
Metabolite Extraction
We employed a biphasic extraction protocol, with non-polar metabolites partitioning into a chloroform phase and polar metabolites partitioning into a methanol/water phase. Cultured cells in 100-mm dishes were washed twice with ice-cold phosphate-buffered saline and immediately quenched with 1 ml of precooled methanol (−80 °C). Cells were collected in glass tubes with a cell scraper (BD Biosciences). Dishes were resuspended with 1 ml of ice-cold water, and the remaining cells were combined in the same tubes. For protein determination, 20 μl of cell suspension was taken from the sample tubes and stored at −80 °C. Afterward, 15.8 nmol of triheptadecanoin, 2.94 nmol of 5α-cholestane, and 3.5 nmol of N-heptadecanoyl-sphingosine (C17 ceramide) in 30 μl of chloroform (non-polar internal standards) and also 9.9 nmol of ribitol and 11.5 nmol of norvaline in 30 μl of methanol (polar internal standards) were added. After the addition of 1 ml of chloroform, samples were shaken for 30 min at room temperature, and then 3 ml of chloroform and 2 ml of water were added. Vortexed samples were centrifuged at 4,000 × g for 30 min at room temperature. Two 2-ml extracts from the methanol/water phase or non-polar samples from the chloroform phase were separately collected to new tubes and then evaporated to dryness. All samples were stored at −80 °C while awaiting analysis. Protein contents in each sample were quantified using a BCA assay kit (Pierce).
Polar Metabolite Analysis
Derivatization of polar metabolites was performed according to previous reports (21, 22) with the following modifications. One of each pair of dried samples was dissolved in 30 μl of methoxyamine hydrochloride (20 mg/ml in pyridine). Sample solutions were sonicated for 15 min at room temperature and incubated for 120 min at 37 °C. Afterward, 70 μl of N-methyl-N-tert-butyldimethylsilytrifluoroacetamide (MBTSTFA) plus 1% tert-butyldimethylchlorosilane (TBDMCS) was added, and the solutions were further incubated overnight at room temperature.
Gas chromatography-mass spectrometry (GC-MS) analysis was performed using an Agilent 6890N gas chromatograph equipped with a 30-meter DB-35ms capillary column connected to an Agilent 5975B mass spectrometer operating under ionization by electron impact at 70 eV. An injection volume of 1 μl was introduced in splitless mode at an injection temperature of 270 °C. The temperature of the MS source and quadrupole were held at 230 and 150 °C, respectively. The detector was set to scan over the mass range 50–550 m/z. The GC temperature program was optimized to follow a large number of metabolites simultaneously: 5 min at 90 °C, 60-min ramp to 280 °C, and held for 5 min at 280 °C (total 70 min/run).
Non-polar Metabolite Analysis
For ceramide and free fatty acid analysis, dried non-polar samples were dissolved in 1.55 ml of isooctane/methanol/ethyl acetate (20:10:1). To remove triglyceride, samples were applied to a silica gel packed Poly-Prep column (Bio-Rad) as described previously (23, 24). Eluted free lipid fractions were evaporated to dryness. For ceramide analysis, samples were redissolved in 250 μl of phosphate buffer (0.1 m, pH 7.0) containing 0.1 unit of sphingomyelinase and 1 mm MgCl2. Free lipid fractions were extracted three times in 500 μl of isooctane/ethyl acetate (3:1) and then evaporated to dryness. Samples were dissolved in 150 μl of N,O-bis(trimethylsilyl)trifluoroacetamide (BSTFA) plus 1% trimethylchlorosilane (TMCS), acetonitrile (4:1) and then incubated overnight at room temperature. GC-MS analysis of free lipids was performed with the following parameter settings. The temperature of the injection port, MS source, and quadrupole were set at 310, 230, and 150 °C, respectively. The GC temperature program was set as follows: 3 min at 130 °C, 4-min ramp to 190 °C, 3 min at 190 °C, 12.3-min ramp to 264 °C, 5 min at 264 °C, 5.75-min ramp to 287 °C, 8 min at 287 °C, 4.6-min ramp to 310 °C, 3 min at 310 °C, 4.7-min ramp to 325 °C, and 16.6 min at 325 °C (total 70 min/run).
For total cellular fatty acid analysis, dried non-polar samples were dissolved in 250 μl of 0.5 n KOH in methanol and then incubated at 70 °C for 1 h. After the addition of 250 μl of 14% trifluoroborane in methanol, samples were further incubated at 70 °C for 2h. 250 μl of saturated NaCl water was added to the resulting samples, and fatty acid methyl esters were extracted twice in 500 μl of hexane. The temperature program for fatty acid methyl esters was set as follows: 5 min at 100 °C, 5-min ramp to 175 °C, 1 min at 175 °C, 11-min ramp to 208 °C, 3.6 min at 208 °C, 1.4-min ramp to 215 °C, 4 min at 215 °C, 2-min ramp to 215 °C, 7-min ramp to 255 °C, 3-min ramp to 300 °C, and 2 min at 300 °C (total 45 min/run).
Cellular Redox
Cytosolic NAD+/NADH ratio was calculated from the lactate/pyruvate ratio obtained from GC-MS profiling data, assuming that Keq = 1.11 × 10⁻⁴ for lactate dehydrogenase as described (25). Cellular NAD+/NADH ratio was also determined enzymatically using an NAD+/NADH quantification kit (Biovision, Mountain View, CA) according to the manufacturer's protocol. Cultured cells in 24-well plates were washed with ice-cold phosphate-buffered saline and then quenched with 200 μl of extraction buffer. Samples were vortexed and centrifuged at 16,000 × g for 5 min at room temperature. The NAD+/NADH ratio in extracted solutions was determined colorimetrically using a microplate analyzer at 450 nm.
GC-MS Data Analysis
All GC-MS data were analyzed according to Styczynski et al. (26). Briefly, mass spectra were processed by the AMDIS software (available from the National Institute of Standards and Technology web site). The resulting ELU files were further analyzed by the SpectConnect software (available on the MIT web site) developed in our laboratory to identify well conserved peaks among multiple GC-MS chromatograms. Metabolite identification of electron impact-MS peaks was performed using in-house standard libraries along with the NIST05 MS library described in Ref. 27. Two-dimensional clustering of metabolic flux distributions was performed using JMP (SAS Institute Inc., Cary, NC).
GC-MS Nomenclature
In discussing isotopic labeling data obtained by GC-MS, we distinguish between multiply labeled molecules of a given metabolite using the following terminology. Positional isotopomers are molecules with identical global isotopic composition but differing in the position of their heavy atoms. Mass isotopomers differ in the total number of their heavy atoms, resulting in different molecular weights. We refer to the mass isotopomers of a metabolite as M+0, M+1, M+2, etc. in order of increasing weight.
Extracellular Metabolite Determination
Medium glucose, lactate, and glutamine were enzymatically determined using a glucose assay kit (glucose oxidase; Sigma), lactate assay kit (BioVision, Mountain View, CA), and l-glutamine/ammonia rapid assay kit (Megazyme, Wicklow, Ireland), respectively. All measurements were quantified by colorimetric 96-well plate assays. To estimate metabolite uptake or secretion, we obtained time course measurements at 3-h intervals and computed the rate of change during each interval by differencing.
Metabolic Flux Determination
The labeling patterns of metabolic intermediates and by-products that emerge upon feeding an isotopically labeled substrate to cultured cells are directly determined by the relative pathway fluxes in their biochemical network (28). This enables the reconstruction of metabolic flux maps by minimizing the lack of fit between simulated and measured GC-MS data. We applied Metran, a software package developed in our laboratory, to estimate metabolic fluxes from isotope labeling data obtained by GC-MS (29). Metran relies upon the recently developed elementary metabolite unit framework to efficiently simulate the effects of varying fluxes on the labeling state of measurable metabolites (30, 31). The flux parameters of the network model are iteratively adjusted using a Levenberg-Marquardt algorithm until optimal agreement with the experiment is obtained (32). All results were subjected to a χ2 statistical test to assess goodness of fit, and accurate 95% confidence intervals were computed for all estimated parameters by evaluating the sensitivity of the sum of squared residuals to flux variations (33). Refer to the supplemental material for a detailed discussion of the model formulation used to estimate fluxes.
Flux results are presented in terms of net and exchange fluxes. All net fluxes were expressed relative to a pyruvate kinase (PK) flux of 100 to facilitate flux comparisons across treatments. The actual PK flux in each condition was determined from the labeling of pyruvate and CAC intermediates along with the measured [U-13C5]glutamine uptake rate because the PK flux provides the main source of unlabeled material that dilutes the 13C tracer. Carbon loss via oxidative pentose phosphate pathway activity or glycogen deposition was assumed to account for any mismatch between glucose uptake and PK flux. Exchange fluxes represent the extent of reaction reversibility and are computed as min(vf,vr), where vf is the forward reaction rate and vr is the rate in the reverse direction. Exchange fluxes were scaled according to the transformation,
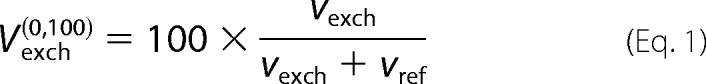 |
where vref is the reference (PK) flux value (34).
Statistics
Unless otherwise indicated, data are expressed as mean ± S.D. Statistical significance was determined by Dunnett's or Tukey's honestly significant differences test according to each experimental design.
RESULTS
FFA Treatments Induce Hepatic ROS Generation and Lipid Accumulation at Physiologic Amino Acid Concentrations
In the present study, we used serum-free medium to mimic the in vivo amino acid composition of human and rat plasma and to uncover physiologically relevant metabolic perturbations caused by FFA treatments. In contrast, typical DMEM culture medium contains unrealistically high amino acid levels and may lead to non-representative phenotypes (Table 1). We first confirmed the practicality of our medium by cultivating H4IIEC3 cells with FFA (100 or 400 μm) and then observing cellular lipids, ROS, and cell viability with Nile red, DCF fluorescence, and resazurin reduction, respectively. Intracellular lipid droplets were observed when cells were incubated for 24 h with palmitate or oleate, but the effect was more pronounced in oleate-treated cells (Fig. 1A). On the other hand, 400 μm palmitate, but not oleate, induced ROS generation and reduced cell viability (Fig. 1B). Concurrent exposure to 50 μm oleate in addition to 400 μm palmitate strongly induced lipid accumulation and also alleviated ROS in comparison with cells treated with palmitate alone (Fig. 1, A and B). The effects varied with FFA concentration because 100 μm palmitate failed to impact either ROS generation or cell viability (Fig. 1B).
FIGURE 1.

FFA-induced apoptosis and steatosis in H4IIEC3 cells under physiologic amino acid conditions. A, microscopic observations of FFA-induced lipid accumulation and ROS generation in H4IIEC3 cells at physiologic amino acid levels. Cells were incubated with 400 μm palmitate, 400 μm oleate, 400 μm palmitate plus 50 μm oleate or without FFA (none) for either 12 h (for ROS detection) or 24 h (for lipid detection). Cellular lipids and ROS were determined using Nile red and DCF fluorescence, respectively. B, quantification of FFA-induced lipid accumulation, ROS generation, and cell viability. H4IIEC3 cells were incubated with 100 or 400 μm palmitate or without FFA (white bar). Also, cells were incubated with 400 μm palmitate with 10 or 50 μm oleate. Lipids, ROS and cell viability were determined using Nile red, DCF fluorescence, and resazurin reduction, respectively. Values are expressed as mean ± S.E. (n = 3). *, p < 0.05 for the comparison with untreated cells (white bars).
Palmitate Leads to Decoupling of Glycolysis and CAC Fluxes
To test whether the induction of apoptotic or steatotic phenotypes by FFA was associated with changes in central carbon metabolism, we carried out metabolic flux analysis of central carbon pathways in preapoptotic cells (at 3, 6, and 9 h) using [U-13C5]glutamine as an isotopic tracer in the presence of physiologic amino acid levels. Here, we confirmed that apoptotic indicators, such as caspase-3/7 activity and DNA laddering, were not changed at least up to 10 h (data not shown). The network model used in this study is shown in Fig. 2A. We first determined external fluxes of glucose uptake, glutamine uptake, and lactate production by measuring extracellular metabolites as described under “Experimental Procedures” (Fig. 2B). Although PA-cells exhibited qualitatively lower glucose uptake compared with untreated cells and PA/OA-cells, significant differences were not detected due to the inherent variability of measuring small changes in the high glucose concentration of our medium (Fig. 2B, top). On the other hand, glutamine uptake was significantly higher in PA-cells (Fig. 2B, middle). Lactate production of both FFA-treated cultures decreased from 3 to 9 h, whereas that of untreated cells remained relatively constant throughout the experiment (Fig. 2B, bottom).
FIGURE 2.

Stable isotopic metabolic flux analysis of central carbon pathways in H4IIEC3 cells. Metabolic flux analysis of central carbon pathways using [U-13C5]glutamine at 3, 6, and 9 h. A, a metabolic network model for flux estimation in hepatoma cultures. A total of 19 net and seven exchange fluxes were calculated as described under “Experimental Procedures.” AcCoA, acetyl-CoA; Akg, α-ketoglutarate; Cit, citrate; Fum, fumarate; G6P, glucose 6-phosphate; Lac, lactate; Mal, malate; Pyr, pyruvate; Suc, succinate; T3P, triose 3-phosphate; AST, aspartate aminotransferase; ACL, ATP-citrate lyase; ADH, α-ketoglutarate dehydrogenase; CS, citrate synthase; FUM, fumarase; GDH, glutamate dehydrogenase; GLN, glutaminase; IDH, isocitrate dehydrogenase; LDH, lactate dehydrogenase; ME, malic enzyme; PDH, pyruvate dehydrogenase; PGI, phosphoglucose isomerase; SDH, succinate dehydrogenase. B, external fluxes of glucose uptake, glutamine uptake, and lactate production calculated from extracellular glucose, glutamine, and lactate measurements, respectively. Values are expressed as μmol/h/106 cells based on measurements over the 3-h intervals 0–3, 3–6, and 6–9 h. C and D, hierarchical clustering analysis of net (C, left) and exchange fluxes (D, left) under different FFA treatments. All net flux values are normalized to the PK flux. The net and exchange fluxes are represented by the color range from 0 (intense green) to 2 (intense red) in C and from 0 (green) to 100% (red) in D, respectively. Representative fluxes are shown on the right-hand sides of C and D. C (right), net fluxes expressed relative to a PK flux of 100. D (right), amino acid turnover. The first plot represents the extent of equilibration between Glu and mitochondrial Akg and the second between Asp and Mal. The first is computed from the GDH exchange flux, whereas the second is calculated from the Asp dilution flux. *, p < 0.05 for the comparison with untreated cells (white bars) or as indicated.
Next, we calculated a total of 19 net and seven exchange fluxes from isotopic labeling patterns of intracellular metabolites, as described under “Experimental Procedures” (Fig. 2, C and D). The ratio of CAC flux to glycolysis is most strongly determined by the GC-MS measurements of CAC intermediates and related amino acids. To understand this, one must recognize that when [U-13C5]glutamine enters the CAC, it will initially give rise to the fully labeled M+5 mass isotopomer of α-ketoglutarate and then M+4 succinate following decarboxylation. As this labeled material continues to cycle, it will lead to lower mass isotopomers, such as M+1 succinate. Increased dilution from unlabeled sources (mainly glucose) results in decreased abundance of these lower mass isotopomers relative to their fully labeled precursors. A good example of this is found in the succinate labeling data shown in Fig. 3, where we found that the ratio of M+1/M+4 mass isotopomers was highest in PA-cells compared with untreated cells and PA/OA-cells. Similar trends were evident in other intermediates, such as malate and aspartate, indicating that exposure to palmitate caused CAC flux to increase relative to glycolysis and that this effect was reversed by oleate co-treatment.
FIGURE 3.

Ratio of M+1 to M+4 mass isotopomers of CAC intermediates. M+1/M+4 peak ratios of succinate, malate, and aspartate were determined by GC-MS and corrected for natural abundance using the method of Fernandez et al. (46). Higher peak ratios indicate elevated CAC flux relative to glycolysis. Values are expressed as mean ± S.E. (n = 3). *, p < 0.05; **, p < 0.01 for the comparison with untreated cells (white bars) or as indicated.
Correlation analysis revealed that untreated cells and PA/OA-cells exhibit similar metabolic flux distributions, where each condition was hierarchically clustered based on the similarity of their measured flux patterns (Fig. 2C, left). On the other hand, the flux distribution of PA-cells diverged markedly from the other groups, particularly at the 9 h time point, where palmitate treatment appears to strongly down-regulate glycolytic and lactate dehydrogenase fluxes while up-regulating mitochondrial CAC and anaplerotic fluxes (Fig. 2C, right). FFA treatments also altered exchange fluxes (Fig. 2D, left), which was detected by the reduced isotopic equilibration of glutamate and aspartate with their corresponding keto acids at 9 h (Fig. 2D, right). This could indicate reduced aspartate/malate shuttle activity because this cycle results in exchange between Glu/Akg and Asp/Mal. Taken as a whole, these data indicate that palmitate strongly induced metabolic decoupling by down-regulating glycolysis and up-regulating CAC fluxes.
Palmitate and Oleate Induce Opposing Changes to Cellular Redox
We estimated cytosolic NAD+/NADH from the lactate/pyruvate ratio obtained by GC-MS analysis as indicated under “Experimental Procedures.” The NAD+/NADH ratio was maintained at high levels in PA-cells throughout the cultivation, whereas in contrast, it was consistently low in PA/OA-cells (Fig. 4, A and B). These data indicate that metabolic changes induced by both palmitate and oleate are associated with changes in cellular redox.
FIGURE 4.

Palmitate disturbs cytosolic redox in H4IIEC3 cells. A, lactate/pyruvate ratio was determined from GC-MS analysis. B, cytosolic NAD+/NADH was calculated from the lactate/pyruvate values, assuming Keq = 1.11 × 10⁻⁴ for lactate dehydrogenase. Values in A and B are expressed as mean ± S.D. (n = 5). *, p < 0.05 for the comparison with untreated cells (white circles).
To test whether the observed cytosolic flux and redox changes induced by oleate co-treatment affect triglyceride synthesis, we first determined total cellular fatty acids and FFA. Total cellular palmitate and oleate contents were increased in PA/OA-cells relative to PA-cells (Table 2). However, free palmitate and stearate as well as total FFA were decreased (Table 2). We next determined free intracellular glycerol 3-phosphate as well as free glycerol in palmitate-treated cells both in the presence and absence of oleate. The results clearly show that oleate co-treatment significantly increased the glycerol 3-phosphate and free glycerol pool sizes (Table 3). These data indicate that oleate co-treatment reduced the free SFA pool by enhancing triglyceride incorporation. This is consistent with the ability of oleate to restore cytosolic redox because glycerol 3-phosphate production depends upon reducing power supplied by cytosolic NADH.
TABLE 2.
Fatty acid composition in triglycerides
Data represent mean ± S.D.
| Fatty acid | Treatment |
||
|---|---|---|---|
| None | 400 μm palmitate | 400 μm palmitate + 50 μm oleate | |
| nmol/mg protein | |||
| Total lipids | |||
| 14:0 | 3.0 ± 0.2a | 6.5 ± 0.7b | 8.6 ± 0.5b |
| 16:0 | 27.4 ± 1.7a | 114.3 ± 8.2b | 150.4 ± 3.8c |
| 16:1n-7 | 3.5 ± 0.2a | 36.1 ± 2.1b | 36.6 ± 1.5b |
| 18:0 | 27.0 ± 1.5a | 36.8 ± 1.8b | 41.3 ± 1.4b |
| 18:1n-9 | 10.3 ± 1.5a | 18.1 ± 1.3a | 43.0 ± 1.3b |
| 20:0 | 0.2 ± 0.0 | 0.2 ± 0.0 | 0.3 ± 0.0 |
| 20:1 | 0.1 ± 0.0 | 0.1 ± 0.0 | 0.2 ± 0.0 |
| 20:3 | 0.3 ± 0.1 | 0.3 ± 0.1 | 0.3 ± 0.0 |
| 20:4 | 1.1 ± 0.0a | 1.7 ± 0.1b | 1.8 ± 0.1b |
| Free lipids | |||
| 14:0 | 1.4 ± 0.3a | 3.3 ± 0.3b | 1.9 ± 0.2a |
| 16:0 | 12.6 ± 2.7a | 31.4 ± 2.7c | 21.4 ± 1.5b |
| 18:0 | 13.1 ± 2.9a | 31.8 ± 1.9c | 20.9 ± 1.5b |
| 18:1n-9 | 1.7 ± 0.5a | 3.9 ± 0.3b | 4.3 ± 0.6b |
| 20:0 | 0.3 ± 0.1 | 0.8 ± 0.1 | 0.5 ± 0.1 |
| 20:4 | 0.01 ± 0.01 | 0.04 ± 0.02 | 0.02 ± 0.01 |
| Total free | 29.0 ± 6.5a | 71.2 ± 4.9c | 49.0 ± 3.4b |
a–c Means in columns without a common letter differ; p < 0.05.
TABLE 3.
Cellular free glycerol and glycerol 3-phosphate
Metabolites were measured at 12 h. Data represent mean ± S.E.
| Treatment |
|||
|---|---|---|---|
| None | 400 μm palmitate | 400 μm palmitate + 50 μm oleate | |
| nmol/mg protein | |||
| Glycerol 3-phosphate | 1.4 ± 0.1a | 1.8 ± 0.1b | 4.6 ± 0.4c |
| Free glycerol | 1.5 ± 0.3a | 2.5 ± 0.4b | 6.6 ± 1.2c |
a–c Means in columns without a common letter differ; p < 0.05.
Amino Acids Modulate FFA-induced Metabolic Alterations
To test the effects of amino acid availability on FFA-induced metabolic changes, we supplemented H4IIEC3 cells with various amino acid mixtures and measured the impact on central carbon fluxes, ROS generation, and apoptosis. First, non-essential amino acid (NEAA) or essential amino acid (EAA) mixtures were separately added into the basal medium shown in Table 1. The NEAA and EAA mixtures were prepared according to the amino acid composition of the basal medium. EAA supplementation significantly increased glucose uptake and lactate dehydrogenase fluxes while decreasing glutamine uptake (Fig. 5, A and B). On the other hand, NEAA supplementation significantly enhanced palmitate-induced flux alterations by reducing glucose uptake and increasing glutamine uptake (Fig. 5A), leading to further decoupling between glycolysis and CAC fluxes (Fig. 5B). Therefore, these data indicate that medium amino acid availability can modulate the decoupling between central metabolic pathways in palmitate-treated hepatic cells.
FIGURE 5.

Amino acid levels affect FFA-induced metabolic alterations in H4IIEC3 cells. Effect of medium EAA and NEAA availability on palmitate-treated cells. A, external fluxes expressed as μmol/h/106 cells. B, internal net fluxes relative to a PK flux of 100. Metabolic flux analysis of central carbon pathways were determined using [U-13C5]glutamine as described in the legend to Fig. 2. H4IIEC3 cells were incubated with 400 μm palmitate. Medium EAA (0.8 mm) and NEAA (1.35 mm) mixtures were prepared based on the physiological amino acid compositions presented in Table 1 and supplemented into amino acid-free medium. *, p < 0.05 for the comparison with control PA-treated cells (black bar or symbols). ACL, ATP-citrate lyase; CS, citrate synthase; FUM, fumarase; GDH, glutamate dehydrogenase; ME, malic enzyme; SDH, succinate dehydrogenase; LDH, lactate dehydrogenase.
Amino Acid Levels Affect FFA-induced Hepatic Apoptosis
Metabolic flux analysis indicated the importance of anaplerosis and amino acid availability in the early phase of palmitate-induced apoptosis. To further explore this result, we varied the total concentration of medium amino acids (1.08, 2.15, or 8.60 mm) in the presence of 400 μm palmitate. Cell viability, cellular lipids, and ROS generation were monitored using resazurin reduction, Nile red, and DCF fluorescence, respectively. Amino acids promoted ROS generation in PA-cells, but ROS levels remained low in PA/OA-cells and did not respond to changing amino acid concentrations (Fig. 6A). Lowering medium amino acids below physiological levels significantly reduced ROS formation in PA-cells, returning ROS to that of FFA-untreated cells (Fig. 6A). Similar effects were observed in stearate-treated H4IIEC3 cells and palmitate-treated mouse hepatocytes (data not shown). Furthermore, oleate normalized amino acid-dependent caspase-3/7 activation and DNA fragmentation in palmitate-treated H4IIEC3 cells (Fig. 6B). Thus, these data indicate that amino acid and oleate availabilities simultaneously influence palmitate-induced apoptosis and steatosis.
FIGURE 6.

Amino acid levels affect FFA-induced ROS generation and apoptosis in H4IIEC3 cells. Influence of amino acid availability on FFA-induced ROS generation (A) and also caspase-3/7 activity and DNA laddering (B). H4IIEC3 cells were incubated with 400 μm palmitate both with and without 50 μm oleate and under varying concentrations of amino acids (1.08, 2.15, or 8.6 mm). DCF fluorescence was determined after a 12-h incubation, whereas caspase-3/7 activity and DNA laddering were measured after a 24-h incubation. In the electrophoresis gel images (B, right panels), the label of each lane corresponds to the conditions in the bar graph of caspase-3/7 activity (B, left panels) except for the size marker (M). Amino acid concentrations are expressed as a magnification ratio in comparison with their physiological level (2.15 mm). Values are expressed as mean ± S.E. (n = 3). *, p < 0.05; **, p < 0.01 for the comparison with untreated cells (white bars) or as indicated.
To assess the modulatory effects of different classes of amino acids on the palmitate-induced apoptotic phenotype, H4IIEC3 cultures were supplemented with NEAA and EAA mixtures as previously described. EAA supplementation partially normalized caspase-3/7 activity and cell viability in a dose-dependent manner, whereas NEAA supplementation had no significant effect on these readouts (Fig. 7).
FIGURE 7.

NEAA, but not EAA, promotes FFA-induced apoptosis in H4IIEC3 cells. Shown is the effect of medium NEAA and EAA levels on palmitate-induced apoptosis. H4IIEC3 cells were incubated with or without 400 μm palmitate under varying amino acid compositions for 24 h, and then cell viability and caspase-3/7 activity were determined. Medium EAA (0.8 mm) and NEAA (1.35 mm) mixtures were prepared based on the physiological amino acid compositions presented in Table 1 and supplemented into amino acid-free medium according to the indicated magnifications. Values are expressed as mean ± S.E. (n = 3). *, p < 0.05; **, p < 0.01 for the comparison with untreated cells (white bars) or as indicated.
To analyze the relationship between cellular amino acid pools and apoptosis, an elevated amount of each single amino acid (800 μm) was added to low (“½×” = 1.08 mm) amino acid medium in the presence or absence of palmitate. Low amino acid medium slightly reduced cell viability independent of palmitate co-treatment (data not shown). In palmitate-untreated cells, the addition of most single amino acids improved cell viability (Fig. 8A, top). However, in the presence of palmitate, glutamate supplementation led to a significant decrease in cell viability (Fig. 8A, bottom). In addition, glutamate significantly induced ROS generation and caspase-3/7 activity (Fig. 8B). Several other NEAAs exhibited similar effects in the presence of palmitate, but their impacts were less pronounced and in most cases were not statistically significant. These data suggest that the intracellular glutamate pool or possibly anaplerotic flux into the CAC via glutamate can be an important factor in controlling the palmitate-induced apoptotic process.
FIGURE 8.

Cellular glutamate metabolism may be important in FFA-induced ROS generation and apoptosis. Shown is the effect of single amino acid overloading on palmitate-induced ROS generation and apoptosis. Each single amino acid (800 μm) was supplemented into 0.5× basal amino acid medium (1.08 mm) with 400 μm palmitate. After a 12-h incubation, cell viability (A), ROS generation (B, top), and caspase-3/7 activity (B, bottom) were determined (n = 6). White, gray, and black bars, vehicle-, EAA-, and NEAA-treated cells, respectively. Values are expressed as mean ± S.E. *, p < 0.05; **, p < 0.01 for the comparison with vehicle condition (white bar).
Influence of Amino Acids on FFA-induced Apoptosis Is Independent of Ceramide
Ceramide, which is a known apoptosis-inducing metabolite, is synthesized de novo from palmitate and serine. To examine the contribution of ceramide toward the apoptotic phenotype in PA-cells, we introduced fumonisin-B1 and cycloserine, known ceramide synthesis inhibitors, to our cultures and observed caspase-3/7 activity under different levels of amino acids. Increased medium amino acids enhanced intracellular palmitoyl-ceramide content in a dose-dependent manner (Fig. 9A). Both ceramide synthesis inhibitors completely suppressed C16 ceramide content (Fig. 9A) but failed to repress caspase-3/7 activation and ROS formation (Fig. 9B). These results suggest that amino acid availability impacts ceramide levels in palmitate-treated cells but that the modulatory effect of amino acids on the apoptotic phenotype is not mediated by ceramide.
FIGURE 9.

Influence of amino acid availability on FFA-induced apoptosis is independent of ceramide. A, the influence of medium amino acids and de novo ceramide synthesis inhibition on intracellular palmitoyl-ceramide in H4IIEC3 cells. Ceramide was determined by GC-MS analysis as described under “Experimental Procedures.” Values are expressed as mean ± S.E. (n = 3). *, p < 0.05 for the comparison with untreated cells. B, effect of de novo ceramide synthesis inhibitors on apoptosis in palmitate-treated cells. Cells were incubated with either 1 mm cycloserine or 50 μm fumonisin-B1 under varying amino acid levels with or without 400 μm palmitate. DCF fluorescence and caspase-3/7 activity were measured. Values are expressed as mean ± S.E. (n = 4). Amino acid concentrations are expressed as a magnification ratio in comparison with physiological amino acids (2.15 mm). **, p < 0.01 for the comparison with each palmitate-untreated control (white bars).
DISCUSSION
The mechanisms by which FFAs induce apoptosis in hepatocytes are of importance because of their potential relevance to non-alcoholic steatohepatitis (1, 35). Previous studies of FFA-induced apoptosis have focused on neutral lipid deposition (2), de novo ceramide synthesis (36), ROS generation (3), and recently ER stress (12). ROS have a critical role in most proposed mechanisms; however, the mechanism of ROS generation remains unclear. We analyzed metabolic pathways in preapoptotic cells to elucidate physiological events leading to ROS formation and apoptosis. In addition, we expected that manipulation of extracellular amino acid levels would provide new insights into FFA-induced metabolic perturbations because of their ability to modulate lipid homeostasis. To this end, we used GC-MS-based stable isotopic analysis of metabolic fluxes in central carbon pathways to uncover metabolic disturbances preceding the onset of apoptotic or steatotic phenotypes. Our results clearly point to the activation of CAC fluxes by palmitate (PA-cells) concomitant with reduced glycolysis and increased cytosolic NAD+/NADH ratio. The decoupling between glycolysis and CAC fluxes was normalized by oleate co-supplementation (PA/OA-cells). Also, it was found that amino acids play a modulatory role in these processes, possibly through the control of central carbon fluxes. A schematic showing the proposed pathways of FFA-induced apoptosis is presented in Fig. 10.
FIGURE 10.

Proposed metabolic pathways causing SFA-induced apoptosis and loci of amino acid control. SFAs inhibit glycolysis flux and promote the decoupling of glycolysis and CAC (TCA cycle) fluxes associated with decreased cytosolic NAD+/NADH. NEAAs, such as glutamate, strongly enhance this process, probably through CAC activation. High cytosolic NAD+/NADH prevents lactate and glycerol 3-phosphate formation from pyruvate and DHAP, respectively. The decreased glycerol pool might also reduce triglyceride synthesis and increase FFA accumulation and ceramide synthesis. Ceramide synthesis is dependent upon non-essential amino acid availability but is not involved in apoptotic pathways. The MUFA oleate can prevent SFA-induced decoupling of glycolysis and CAC fluxes and normalize cytosolic redox possibly by reversing glycolysis inhibition.
A recent study demonstrated the application of metabolic flux analysis to long term palmitate-treated human hepatoma HepG2 cells using conventional stoichiometric modeling with medium metabolite analysis (37). According to this work, 1–3 days of palmitate treatment failed to change glycolysis and CAC fluxes, whereas increased β-oxidation and ketone body formation were observed (37). However, we realized that there are at least two points to consider in regard to this analysis. First, FFA-induced apoptosis normally completes within 24 h, culminating in cell death. Therefore, the time scale of the aforementioned experiment was too long to observe changes in the flux phenotype that precede the onset of apoptosis. Second, once cells have undergone apoptosis, they may release intracellular metabolites into the medium. This could invalidate measurements of extracellular substrate depletion and product accumulation that are used in the subsequent flux analysis. In the present study, we demonstrate metabolic flux analysis of central carbon pathways using 13C5 glutamine as a labeled substrate from short (3 h) to long (9 h) periods in both PA- and PA/OA-cells. However, the long time points still precede the onset of apoptosis. Our data indicate that palmitate can induce decoupling of central metabolism at 9 h by inhibiting glycolysis and activating CAC fluxes. Furthermore, increased CAC flux seems to derive from increased glutamine uptake rather than increased fatty acid oxidation. This might explain the finding of Srivistava and Chan (37) that inhibition of β-oxidation in HepG2 cells failed to suppress palmitate lipotoxicity.
Oleate co-treatment has been reported to prevent palmitate-induced apoptosis while promoting steatosis by diverting palmitate away from apoptotic pathways and toward triglyceride synthesis (2). However, the mechanism by which oleate changes the metabolic fate of palmitate is still unclear. Our data reveal that decoupling of glycolysis and CAC fluxes by palmitate is normalized by oleate co-treatment in PA/OA-cells (Fig. 10). Particularly, diminished lactate dehydrogenase flux in PA-cells was restored in PA/OA-cells. Our data also reveal that oleate co-treatment increases the intracellular glycerol 3-phosphate and free glycerol pools, which are required for triglyceride synthesis. Both the production of lactate by lactate dehydrogenase and the production of glycerol-3-phosphate from DHAP depend upon cytosolic NADH. Thus, our data indicate that restoration of glycolytic fluxes by oleate plays a critical role in promoting triglyceride synthesis and steatosis while reducing apoptosis in PA/OA-cells, at least in part, by normalizing the cytosolic redox state (Fig. 10).
Studies of glycolysis inhibition by FFAs in hepatocytes have been previously reported (38, 39). An earlier study showed that FFA treatment in rat hepatocytes inhibits pyruvate formation from glucose, suggesting that FFA oxidation competes with glucose utilization (38). The authors attributed this result to the inhibitory effect of increased citrate levels on phosphofructokinase activity. They argue that increased flux to acetyl-CoA derived from fatty acid oxidation will not only produce the observed increases in citrate concentration but will also enhance flux through pyruvate carboxylase, thus shifting the cell toward a more gluconeogenic state. Our data indicate that palmitate treatment could increase not only pyruvate carboxylase flux relative to glycolysis but also many other CAC and anaplerotic fluxes. Another recent study examined the influence of FFAs on glucokinase activity and glycolysis in rat hepatocytes (39). In that study, 150 μm palmitate lowered the glucokinase activity of rat hepatocytes in the presence of 2 nm insulin. Oleate had no effect on glucokinase activity, indicating that the influence of FFAs on glycolysis is species-dependent. In the same study, palmitate-treated hepatocytes did not show changes in the overall glycolytic rate in response to glucokinase down-regulation. However, our hypothesis is still reasonable, considering the fact that treatment of H4IIEC3 cells with lower palmitate levels (100 μm) had no effect on cellular phenotypes in our study. Higher palmitate levels may be required to reduce glycolysis in hepatocytes as well. Inherent differences between hepatocyte and hepatoma metabolisms should also be considered in this regard. Hansson et al. (40) compared glucose and FFA metabolism in McA-RH7777 hepatomas and rat hepatocytes using isotopic tracers. They showed that although FFA uptake was higher in hepatomas than in hepatocytes, β-oxidation flux was lower in hepatomas. In the same study, glucose uptake was lower, but its oxidation was higher in hepatomas. Also, triglyceride synthesis was higher in hepatomas. Considering these results, hepatomas might be more sensitive to free lipid toxicity because of their weak capacity for FFA oxidation. In addition, hepatomas seem to depend on glucose, rather than fatty acids, as their major energy source, indicating the importance of glycolysis in hepatoma metabolism. In fact, our preliminary data show that induction of cell death and ROS formation by palmitate is much stronger in hepatomas than in hepatocytes (supplemental Fig. S1).
Although the experiments presented in this article were conducted in high glucose medium, in preliminary studies we examined both low (5 mm) and high (25 mm) concentrations and did not observe differences in the ability of palmitate to induce ROS and cell death (data not shown). Furthermore, a previous study on myocyte cells showed no difference between low and high glucose in regard to palmitate-induced apoptosis (4). Thus, the effects of palmitate do not appear to stem from glucose toxicity or to depend strongly on changes in glucose concentration.
EAAs affect fatty acid synthase genes in HepG2 cells (41), and recent studies show systematic regulation of lipid pathways by EAA through a GCN2-dependent pathway (15). Furthermore, amino acids are known to affect metabolic fluxes in glucose and lipid pathways (18, 42). It was reported that the NEAAs glutamine, alanine, and proline promote de novo lipogenesis in hepatocyte and mouse hepatoma cells (42). Thus, the influence of amino acids on lipid metabolism and related metabolic disorders is an issue of current importance. However, there has not been a systematic study investigating how amino acids affect lipid toxicity. In the present study, we focused on the role of amino acids in controlling metabolic fluxes, rather than gene expression, in lipoapoptotic cells because we assumed that breakdown of metabolic homeostasis by FFAs could trigger ROS generation and apoptosis and also that these effects could be modulated by the medium amino acid composition. In preliminary studies, we examined both EAA and NEAA supplementation in FFA-untreated H4IIEC3 cells but did not observe changes in ROS production or cell viability (data not shown). However, our present data reveal that increasing the total amino acid concentration promotes ROS generation and apoptosis in palmitate-treated cells. Furthermore, NEAA supplementation was shown to exacerbate the palmitate-induced decoupling of glycolysis and CAC fluxes, whereas EAA supplementation protected against these effects. Thus, the total amino acid concentration and, in particular, the abundance of NEAA relative to EAA appear to modulate the metabolic and apoptotic effects of palmitate. Induction of ROS generation by NEAA was also confirmed in mouse primary hepatocytes (see supplemental Fig. S1).
We further examined the effects of single amino acid overloading in palmitate-treated cells and found that glutamate was the most effective single amino acid in promoting palmitate-induced ROS generation. Of course, it is unlikely that such high extracellular glutamate availability is directly involved in FFA-induced apoptosis in vivo due to its lower abundance in circulation. However, it is possible that altered aminotransferase activities or changes in other amino acid catabolic pathways might affect the intracellular glutamate pool and thereby promote FFA-induced apoptosis. It should be noted that the effect of glutamate to promote ROS generation and caspase activation and to reduce cell viability only occurred in palmitate-treated cells, indicating that the effect is dependent on palmitate.
As for EAA, hepatocytes are known to have unique limitations in their amino acid catabolic pathways; for instance, they have no or only weak branched-chain amino acid aminotransferase activities (43). In addition, lysine, the most abundant ketogenic amino acid, is oxidized only in the mitochondrial matrix (44) and is expected to compete with FFA oxidation. Of course, our present data and the previously reported studies are not enough to explain differences in the efficacy of each amino acid, but it is highly likely that the anaplerotic flux partitioning of amino acids into the CAC could be an important factor.
To investigate the contribution of palmitate oxidation to central pathways, we also employed metabolic flux analysis using 13C16 palmitate in H4IIEC3 cells (data not shown). Only a very small amount of labeling, however, was detected in CAC intermediates, indicating that the oxidation of extracellular palmitate was not a major contributor to the enhanced CAC fluxes we observed. On the contrary, our data indicate that the effects of palmitate to increase CAC activity are mediated primarily through increased anaplerotic flux from glutamine. This lends further support to the hypothesis that differences in anaplerotic metabolism may be a key factor behind the ability of certain classes of amino acids to modulate lipotoxicity in different ways. In addition, isotopic exchange from α-ketoglutarate to glutamate and from malate to aspartate was significantly lower in both PA- and PA/OA-cells. This indicates that FFA treatments could reduce glutamate and aspartate exchange pathways, such as the aspartate/malate shuttle. Therefore, the consequences of reduced aspartate/malate shuttling to alter cytosolic NAD+/NADH might be another possible explanation for the observed effects of amino acid availability.
Ceramide synthesis inhibitors had no effect on palmitate-induced ROS generation and caspase-3/7 activation under increased levels of medium amino acids, although they completely suppressed cellular ceramide. Where NEAA loading effectively increased cellular ceramide, EAA failed to bring about a change (data not shown). This indicates that cellular ceramide is influenced by medium amino acid availability, but it is not involved in both palmitate- and amino acid-induced phenotypic changes, at least in our model. Therefore, our data suggest that palmitate toxicity can be modulated by amino acids as well as oleate, not through ceramide synthesis but possibly through activation of CAC fluxes (Fig. 10). This suggests that manipulation of dietary amino acids could be a possible way to treat NAFLD and non-alcoholic steatohepatitis.
Only a few metabolomic studies have been reported in mammalian cells (45). This may be due to practical difficulties surrounding sample preparation and data analysis. Our laboratory has previously developed two computational programs to facilitate metabolomic data analysis: SpectConnect for GC-MS-based metabolic profiling (26) and Metran for stable isotopic flux analysis (29). In the present study, we applied these tools for pathway analysis in lipoapoptotic cells and successfully identified phenotype-specific changes. We believe that our methods can be powerful tools for metabolic discovery in various mammalian cell models.
Supplementary Material
Acknowledgments
We thank Dr. Takehana and Ajinomoto Co., Inc. for the gift of amino acid-free DMEM. Also, we thank Dr. Kimura and Dr. Ando for human and rat plasma amino acid profiles.
This work was supported, in whole or in part, by National Institutes of Health Grants DK075850 and ES013925.

The on-line version of this article (available at http://www.jbc.org) contains supplemental Tables S1–S9 and Figs. S1–S7.
- FFA
- free fatty acid
- CHO
- Chinese hamster ovary
- DMEM
- Dulbecco's modified Eagle's medium
- EAA
- essential amino acid
- GC
- gas chromatography
- MS
- mass spectrometry
- MUFA
- monounsaturated fatty acid
- NEAA
- non-essential amino acid
- PA-cell
- H4IIEC3 hepatoma cell treated with palmitate alone
- PA/OA-cell
- H4IIEC3 hepatoma cell treated with both palmitate and oleate in combination
- ROS
- reactive oxygen species
- SFA
- saturated fatty acid
- PK
- pyruvate kinase
- CAC
- citric acid cycle.
REFERENCES
- 1.Wieckowska A., McCullough A. J., Feldstein A. E. (2007) Hepatology 46, 582–589 [DOI] [PubMed] [Google Scholar]
- 2.Listenberger L. L., Han X., Lewis S. E., Cases S., Farese R. V., Jr., Ory D. S., Schaffer J. E. (2003) Proc. Natl. Acad. Sci. U.S.A. 100, 3077–3082 [DOI] [PMC free article] [PubMed] [Google Scholar]
- 3.Listenberger L. L., Ory D. S., Schaffer J. E. (2001) J. Biol. Chem. 276, 14890–14895 [DOI] [PubMed] [Google Scholar]
- 4.Miller T. A., LeBrasseur N. K., Cote G. M., Trucillo M. P., Pimentel D. R., Ido Y., Ruderman N. B., Sawyer D. B. (2005) Biochem. Biophys. Res. Commun. 336, 309–315 [DOI] [PubMed] [Google Scholar]
- 5.Okere I. C., Chandler M. P., McElfresh T. A., Rennison J. H., Sharov V., Sabbah H. N., Tserng K. Y., Hoit B. D., Ernsberger P., Young M. E., Stanley W. C. (2006) Am. J. Physiol. Heart Circ. Physiol. 291, H38–H44 [DOI] [PubMed] [Google Scholar]
- 6.Busch A. K., Gurisik E., Cordery D. V., Sudlow M., Denyer G. S., Laybutt D. R., Hughes W. E., Biden T. J. (2005) Diabetes 54, 2917–2924 [DOI] [PubMed] [Google Scholar]
- 7.Hardy S., El-Assaad W., Przybytkowski E., Joly E., Prentki M., Langelier Y. (2003) J. Biol. Chem. 278, 31861–31870 [DOI] [PubMed] [Google Scholar]
- 8.Barreyro F. J., Kobayashi S., Bronk S. F., Werneburg N. W., Malhi H., Gores G. J. (2007) J. Biol. Chem. 282, 27141–27154 [DOI] [PubMed] [Google Scholar]
- 9.Malhi H., Bronk S. F., Werneburg N. W., Gores G. J. (2006) J. Biol. Chem. 281, 12093–12101 [DOI] [PubMed] [Google Scholar]
- 10.Unger R. H., Zhou Y. T. (2001) Diabetes 50, Suppl. 1, S118–S121 [DOI] [PubMed] [Google Scholar]
- 11.Zhou Y. T., Grayburn P., Karim A., Shimabukuro M., Higa M., Baetens D., Orci L., Unger R. H. (2000) Proc. Natl. Acad. Sci. U.S.A. 97, 1784–1789 [DOI] [PMC free article] [PubMed] [Google Scholar]
- 12.Guo W., Wong S., Xie W., Lei T., Luo Z. (2007) Am. J. Physiol. Endocrinol. Metab. 293, E576–E586 [DOI] [PubMed] [Google Scholar]
- 13.Wei Y., Wang D., Topczewski F., Pagliassotti M. J. (2006) Am. J. Physiol. Endocrinol. Metab. 291, E275–E281 [DOI] [PubMed] [Google Scholar]
- 14.Zivkovic A. M., German J. B., Sanyal A. J. (2007) Am. J. Clin. Nutr. 86, 285–300 [DOI] [PubMed] [Google Scholar]
- 15.Guo F., Cavener D. R. (2007) Cell Metab. 5, 103–114 [DOI] [PubMed] [Google Scholar]
- 16.Kimball S. R., Jefferson L. S. (2006) Am. J. Clin. Nutr. 83, 500S–507S [DOI] [PubMed] [Google Scholar]
- 17.Chan C., Berthiaume F., Lee K., Yarmush M. L. (2003) Metab. Eng. 5, 1–15 [DOI] [PubMed] [Google Scholar]
- 18.Wong M. S., Raab R. M., Rigoutsos I., Stephanopoulos G. N., Kelleher J. K. (2004) Physiol. Genomics 16, 247–255 [DOI] [PubMed] [Google Scholar]
- 19.Jousse C., Bruhat A., Ferrara M., Fafournoux P. (1998) Biochem. J. 334, 147–153 [DOI] [PMC free article] [PubMed] [Google Scholar]
- 20.Sudhandiran G., Shaha C. (2003) J. Biol. Chem. 278, 25120–25132 [DOI] [PubMed] [Google Scholar]
- 21.Antoniewicz M. R., Kelleher J. K., Stephanopoulos G. (2007) Anal. Chem. 79, 7554–7559 [DOI] [PubMed] [Google Scholar]
- 22.Fiehn O., Kopka J., Dörmann P., Altmann T., Trethewey R. N., Willmitzer L. (2000) Nat. Biotechnol. 18, 1157–1161 [DOI] [PubMed] [Google Scholar]
- 23.Tserng K. Y., Griffin R. (2003) Anal. Biochem. 323, 84–93 [DOI] [PubMed] [Google Scholar]
- 24.Vieu C., Tercé F., Chevy F., Rolland C., Barbaras R., Chap H., Wolf C., Perret B., Collet X. (2002) J. Lipid Res. 43, 510–522 [PubMed] [Google Scholar]
- 25.Siess E. A., Brocks D. G., Lattke H. K., Wieland O. H. (1977) Biochem. J. 166, 225–235 [DOI] [PMC free article] [PubMed] [Google Scholar]
- 26.Styczynski M. P., Moxley J. F., Tong L. V., Walther J. L., Jensen K. L., Stephanopoulos G. N. (2007) Anal. Chem. 79, 966–973 [DOI] [PubMed] [Google Scholar]
- 27.Tikunov Y., Lommen A., de Vos C. H., Verhoeven H. A., Bino R. J., Hall R. D., Bovy A. G. (2005) Plant Physiol. 139, 1125–1137 [DOI] [PMC free article] [PubMed] [Google Scholar]
- 28.Wiechert W., Möllney M., Isermann N., Wurzel M., de Graaf A. A. (1999) Biotechnol. Bioeng. 66, 69–85 [PubMed] [Google Scholar]
- 29.Yoo H., Antoniewicz M. R., Stephanopoulos G., Kelleher J. K. (2008) J. Biol. Chem. 283, 20621–20627 [DOI] [PMC free article] [PubMed] [Google Scholar]
- 30.Antoniewicz M. R., Kraynie D. F., Laffend L. A., González-Lergier J., Kelleher J. K., Stephanopoulos G. (2007) Metab. Eng. 9, 277–292 [DOI] [PMC free article] [PubMed] [Google Scholar]
- 31.Young J. D., Walther J. L., Antoniewicz M. R., Yoo H., Stephanopoulos G. (2008) Biotechnol. Bioeng. 99, 686–699 [DOI] [PubMed] [Google Scholar]
- 32.Madsen K., Nielsen H. B., Tingleff O. (2004) Methods for Non-linear Least Squares Problems, 2nd Ed., pp. 24–29, Technical University of Denmark, Lyngby, Denmark [Google Scholar]
- 33.Antoniewicz M. R., Kelleher J. K., Stephanopoulos G. (2006) Metab. Eng. 8, 324–337 [DOI] [PubMed] [Google Scholar]
- 34.Wiechert W., Siefke C., de Graaf A. A., Marx A. (1997) Biotechnol. Bioeng. 55, 118–135 [DOI] [PubMed] [Google Scholar]
- 35.Farrell G. C., Larter C. Z. (2006) Hepatology 43, Suppl. 1., S99–S112 [DOI] [PubMed] [Google Scholar]
- 36.Turpin S. M., Lancaster G. I., Darby I., Febbraio M. A., Watt M. J. (2006) Am. J. Physiol. Endocrinol. Metab. 291, E1341–E1350 [DOI] [PubMed] [Google Scholar]
- 37.Srivastava S., Chan C. (2008) Biotechnol. Bioeng. 99, 399–410 [DOI] [PMC free article] [PubMed] [Google Scholar]
- 38.Morand C., Besson C., Demigne C., Remesy C. (1994) Arch. Biochem. Biophys. 309, 254–260 [DOI] [PubMed] [Google Scholar]
- 39.Swagell C. D., Morris C. P., Henly D. C. (2006) Nutrition 22, 672–678 [DOI] [PubMed] [Google Scholar]
- 40.Hansson P. K., Asztély A. K., Clapham J. C., Schreyer S. A. (2004) Biochim. Biophys. Acta 1684, 54–62 [DOI] [PubMed] [Google Scholar]
- 41.Dudek S. M., Semenkovich C. F. (1995) J. Biol. Chem. 270, 29323–29329 [DOI] [PubMed] [Google Scholar]
- 42.Baquet A., Lavoinne A., Hue L. (1991) Biochem. J. 273, 57–62 [DOI] [PMC free article] [PubMed] [Google Scholar]
- 43.Suryawan A., Hawes J. W., Harris R. A., Shimomura Y., Jenkins A. E., Hutson S. M. (1998) Am. J. Clin. Nutr. 68, 72–81 [DOI] [PubMed] [Google Scholar]
- 44.Blemings K. P., Crenshaw T. D., Swick R. W., Benevenga N. J. (1994) J. Nutr. 124, 1215–1221 [DOI] [PubMed] [Google Scholar]
- 45.Ramanathan A., Wang C., Schreiber S. L. (2005) Proc. Natl. Acad. Sci. U.S.A. 102, 5992–5997 [DOI] [PMC free article] [PubMed] [Google Scholar]
- 46.Fernandez C. A., Des Rosiers C., Previs S. F., David F., Brunengraber H. (1996) J. Mass Spectrom. 31, 255–262 [DOI] [PubMed] [Google Scholar]
Associated Data
This section collects any data citations, data availability statements, or supplementary materials included in this article.