

Abstract
Dynamic nuclear polarization of 13C-labeled cell substrates has been shown to massively increase their sensitivity to detection in NMR experiments. The sensitivity gain is sufficiently large that if these polarized molecules are injected intravenously, their spatial distribution and subsequent conversion into other cell metabolites can be imaged. We have used this method to image the conversion of fumarate to malate in a murine lymphoma tumor in vivo after i.v. injection of hyperpolarized [1,4-13C2]fumarate. In isolated lymphoma cells, the rate of labeled malate production was unaffected by coadministration of succinate, which competes with fumarate for transport into the cell. There was, however, a correlation with the percentage of cells that had lost plasma membrane integrity, suggesting that the production of labeled malate from fumarate is a sensitive marker of cellular necrosis. Twenty-four hours after treating implanted lymphoma tumors with etoposide, at which point there were significant levels of tumor cell necrosis, there was a 2.4-fold increase in hyperpolarized [1,4-13C2]malate production compared with the untreated tumors. Therefore, the formation of hyperpolarized 13C-labeled malate from [1,4-13C2]fumarate appears to be a sensitive marker of tumor cell death in vivo and could be used to detect the early response of tumors to treatment. Given that fumarate is an endogenous molecule, this technique has the potential to be used clinically.
Keywords: magnetic resonance imaging, spectroscopy, metabolism, cell death, lymphoma
The discovery of imaging biomarkers that are early indicators of long-term treatment response in cancer should improve patient mortality and accelerate the development of new drugs. Treatment response has traditionally been assessed by measuring changes in tumor size (1); increasingly, functional and molecular information is also being used to assess treatment response as these parameters often respond earlier than size measurements alone (2). For example, uptake of the glucose analog 18F-labeled 2-fluoro-2-deoxy-d-glucose (FDG) can be imaged noninvasively by PET and is now used as a marker of disease progression for some clinical indications (1). However, not all tumors demonstrate avid FDG uptake; therefore, the development of new biomarkers for detecting treatment response is required.
Treatment response has been detected by imaging apoptosis (2), but it is becoming clear that cancer cells also die by nonapoptotic mechanisms, such as necrosis, and that this necrosis is a more controlled phenomenon than was thought (3, 4). Moreover, there is some indirect evidence that necrosis may play a role in tumor development (5). Although diffusion-weighted MRI appears to detect the loss of cellularity, which is the end result of extensive cellular necrosis (6), there is currently no method for specifically imaging early necrosis in vivo (4).
MR spectroscopy (MRS) has been used to investigate the biochemical changes associated with disease, but a major limitation has been its very low sensitivity (7). Dynamic nuclear polarization (DNP) can increase the polarization of nuclear spins by >10,000-fold, and recently it has been applied to 13C-labeled molecules in solution (8). The increase in polarization is sufficient to allow the spatial distribution of a hyperpolarized 13C-labeled molecule to be imaged after its i.v. injection and the metabolites formed from it. The technique has been used to image the metabolism of several molecules in tumors (9–13). We have shown that the decreased flux of hyperpolarized 13C label between pyruvate and lactate, in the reaction catalyzed by lactate dehydrogenase (LDH), is an early treatment response marker in murine lymphoma (10, 14).
Fumarate, a tricarboxylic acid cycle intermediate, is hydrated to produce malate in the reaction catalyzed by fumarase (or fumarate hydratase, EC 4.2.1.2). Fumarate has been hyperpolarized by using DNP, and its metabolism to malate has been observed in vivo in skeletal muscle and tumors.* We show here that malate production from fumarate is increased in treated lymphoma cells and tumors and that this increase is caused by tumor cell necrosis. We propose that hyperpolarized [1,4-13C2]fumarate could be used in the clinic to detect early tumor response to treatment and other pathological states in which cell death plays a role, such as toxic insults or ischemia.
Results
Cell Experiments.
[1,4-13C2]fumarate was polarized to between 26% and 35%. After injection of [1,4-13C2]fumarate into treated and untreated murine lymphoma (EL-4) cell suspensions, signal from hyperpolarized [1,4-13C2]malate was observed; however, the malate signal in untreated cells was only just discernable (Fig. 1A). At 16 h after treatment with etoposide, there was a large increase in the rate of malate production (Fig. 1B). In separate experiments where the cells had been lysed by freeze-thawing, there was a further increase in the rate of malate production (Fig. 1C). These data are plotted as the ratio of the average of the [1-13C] and [4-13C]malate peak intensities divided by the total 13C signal (± SD, n = 3; Fig. 2A). Coadministration of 50 mM succinate, which is transported into the cells on the same transporter as fumarate (15–20), had no significant effect on the rate of labeled malate production (Fig. 2A). However, the low level of malate production in untreated cells meant that it was difficult to determine whether succinate had an effect in these cell preparations.
Fig. 1.

13C spectra acquired over a period of 1 min after injection of hyperpolarized [1,4-13C2]fumarate into suspensions of intact murine lymphoma cells (≈5 × 10⁷ cells) or lysed cells; these are representative spectra from the data shown in Fig. 2. For clarity, only every third spectrum is shown and each series has been scaled to the maximum fumarate signal. (A) Untreated cells. (B) Cells 16 h after etoposide treatment. (C) Lysed cells. The truncated signal from the hyperpolarized [1,4-13C2]fumarate is at 175.4 ppm, the signal from [1-13C]malate at ≈181.8 ppm, and the signal from [4-13C]malate at ≈180.6 ppm.
Fig. 2.

Effect of drug treatment and induction of cellular necrosis on 13C label flux between [1,4-13C2]fumarate and [1,4-13C2]malate in EL-4 lymphoma cell suspensions. (A) Ratio of the average [1-13C] and [4-13C]malate peak intensity/total hyperpolarized 13C signal intensity (± SD, n = 3). It has been corrected for total cell number, which includes viable, apoptotic, and necrotic cell populations. Untreated cells (circles), cells 16 h after etoposide treatment (triangles), and lysed cells (squares). The open symbols refer to experiments performed with 10 mM hyperpolarized [1,4-13C2]fumarate only, and the filled symbols show experiments performed with the coadministration of 50 mM nonhyperpolarized and unlabeled succinate; for clarity, the open symbols have been offset by −0.5 s and the filled symbols have been offset by +0.5 s. (B) Rate of malate production (calculated from the initial slope of malate amplitude/total 13C signal over time) plotted against the percentage of cell necrosis in each experiment. The conditions used to vary the levels of necrosis are described in Materials and Methods.
The [1,4-13C2]fumarate and [1,4-13C2]malate peak intensities were fitted to a two-site exchange model (10) to obtain a rate constant describing flux of hyperpolarized 13C label between fumarate and malate:
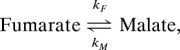 |
where kF is the apparent rate constant for the conversion of fumarate to malate and kM is the apparent rate constant for the reverse reaction. The decay of the hyperpolarized signal from fumarate and malate is described by the time constants TF and TM, respectively. This model is described in further detail in Materials and Methods.
Because of the relatively large number of variables, some of these parameters were fixed to reduce errors in the fitting. For example, in one variant of the model, it was assumed that kM = 0 because initially there was much more fumarate present than malate; consequently only kF, TF, and TM were derived. Using this approach, TF was calculated to be 24.1 ± 2.1 s (± SD, n = 18) and TM was 18.4 ± 7.0 s (n = 12, P < 0.01). For TM, the data were also fitted by assuming that TF = TM, which gave values for TF (and hence TM) of 23.9 ± 2.0 s. Using the latter approach, the rate constant kF was 19 times higher in the etoposide-treated cells (0.056 ± 0.053 × 10⁻¹⁰ s−1·cell−1, n = 3) as compared with the untreated cells (0.003 ± 0.002 × 10⁻¹⁰ s−1·cell−1, n = 3, P < 0.01). In lysed cells the rate of label flux between fumarate and malate was 62 times higher than in the untreated group (0.177 ± 0.017 × 10⁻¹⁰ s−1 cell−1, n = 3, P < 0.01). These results for kF were similar to those obtained by assuming that kM = 0 (and fitting TM and TF separately). There was no significant difference in the flux rates obtained after the addition of succinate (see Fig. 2A), regardless of whether kF was fitted by assuming kM = 0 or not.
Cell necrosis was measured at the end of these flux determinations from the number of cells permeable to trypan blue. Trypan blue uptake increased sequentially in control cells (n = 3), cells treated with etoposide for 14 h (n = 2), cells treated with etoposide for 16 h (n = 3), and lysed cell samples (n = 3). There was a good correlation between the rate of malate production and the level of necrosis (R2 = 0.89; Fig. 2B).
Tumors and Tumor Imaging.
After i.v. injection of hyperpolarized [1,4-13C2]fumarate, signal from [1,4-13C2]malate was observed in spectra obtained from untreated (n = 5; Fig. 3A) and treated (n = 5, 24 ± 2 h after etoposide administration; Fig. 3B) EL-4 tumors; three of the treated mice had also been used to acquire control spectra the previous day.
Fig. 3.

13C spectra acquired from slices through subcutaneous murine lymphoma tumors. (A and B) Untreated (A) and etopside-treated (B) tumors 30 s after the i.v. injection of hyperpolarized [1,4-13C2]fumarate; these are representative spectra from the experiments shown in C and D. The signal from hyperpolarized fumarate is seen at 175.4 ppm, the signal from [1-13C]malate is seen at ≈181.8 ppm, and the signal from [4-13C]malate is seen at ≈180.6 ppm. An unidentified contaminant is seen at ≈177 ppm. (C) Total hyperpolarized 13C malate signal over time (i.e., the summed intensities of [1-13C] and [4-13C]malate) normalized to the maximum [1,4-13C2]fumarate signal for untreated (○) and etoposide-treated (■) animals (± SD, n = 5). (D) Hyperpolarized [1,4-13C2]fumarate signal in the same animals as in C. The superimposed curves represent the average fits for both the fumarate and the malate resonances using the kinetic modeling described in the text (assuming TM = TF). The solid line represents treated animals, and the dashed line represents untreated animals.
The maximum malate signal was seen later in the controls (33 ± 4 s after fumarate injection) compared with the treated animals (27 ± 2 s; P < 0.01; Fig. 3C). When normalized to the maximum fumarate signal, the maximum malate signal was 59% higher in the treated (0.23 ± 0.04) compared with the untreated tumors (0.15 ± 0.04, P < 0.01). Plots of the normalized fumarate signal over time showed that this signal peaked at approximately the same time in treated and untreated tumors but that there was a more rapid signal decline in the treated group (Fig. 3D).
The data obtained in vivo were also fitted to a kinetic model, as described in Materials and Methods, and the average fitted curves are shown superimposed over the data in Fig. 3 C and D. Again, to reduce the number of variables, TM was assumed to be equal to TF. Using this model, there was no significant difference in TF (and hence TM) between the treated (36.7 ± 3.3 s) and the untreated (40.1 ± 2.7 s) animals (n = 5, P = 0.11). The difference between these values and those obtained in vitro can be explained by the different field strengths used for these experiments (2.35 vs. 9.4 T). The rate constant kF was 0.007 ± 0.002 s−1 in untreated tumors and this constant increased by a factor of 2.4 to 0.018 ± 0.004 s−1 in drug-treated tumors (n = 5, P < 0.001). There was a similar 2.5-fold increase in the reverse rate constant (kM) in the treated group (0.018 ± 0.005 s−1) compared with the controls (0.007 ± 0.006 s−1, P < 0.05). The similarity of the relative changes in the forward and reverse rate constants is consistent with an increase in the concentration of fumarase available to its substrates. There was no difference in the calculated rate of flow of hyperpolarized fumarate into the tumor (kB; see Materials and Methods), between the treated (0.27 ± 0.14 s−1) and the untreated groups (0.19 ± 0.05 s−1, P = 0.23). Even if all of the variables were fitted independently, a similar 2.3-fold increase in kF was seen after drug treatment (P < 0.001).
13C chemical shift images (CSIs) acquired at ≈30 s after the injection of hyperpolarized [1,4-13C2]fumarate showed that the fumarate could be observed throughout the animals but that the hyperpolarized malate signal was predominately within the tumors (Fig. 4). After treatment, there was a large increase in the malate signal, and to some extent it extended beyond the anatomical boundary of the tumor, as defined by the 1H MR image.
Fig. 4.

Representative transverse images from untreated (A) and etoposide-treated (B) mice with s.c.-implanted lymphoma tumors. The 1H image shows the anatomical location of the tumor, outlined in white. Adjacent to this are false-color CSIs superimposed on the 1H image, which demonstrate the spatial distribution of the total hyperpolarized 13C malate and 13C fumarate signals. The color scale indicates the relative signal intensity compared with the maximum intensity in each image. To reduce the effects of noise, voxels with signal intensities ≤20% of the maximum signal intensity were removed from the image. Although the images have been scaled to their respective maxima, the maximum malate signal intensity in each experiment is ≈10–25% of the maximum fumarate signal.
In separate experiments at 9.4 T, it was demonstrated that only ≈2% of the total hyperpolarized 13C signal was seen as malate outside of the tumor. The average malate/fumarate ratios obtained by placing the surface coil over the liver rather than the tumor were 0.020 ± 0.019 (n = 3, tumor-bearing animals pre- treatment), 0.020 ± 0.017 (n = 3, tumor-bearing animals 24 h posttreatment; 0.022 ± 0.016 (n = 3, control animals pretreatment), and 0.017 ± 0.007 (n = 2, control animals 24 h posttreatment). There was no significant difference between these groups (P > 0.66), confirming that the majority of the malate signal measured by the surface coil over the tumor arises from within the tumor rather than being washed in from another organ, such as the liver.
Enzyme Activities in Tissue Extracts.
There was significantly lower fumarase activity in treated tumors (277 ± 18 unit/g protein, n = 6) as compared with controls (319 ± 30 unit/g protein, n = 5, P = 0.02). The fumarase activity in muscle (taken from control animals) was 312 ± 35 unit/g protein (n = 4). There was also significantly lower malate dehydrogenase (MDH) activity in treated tumors (227 ± 32 units/g protein, n = 6) as compared with controls (274 ± 20 units/g protein, n = 5, P = 0.02) and both were significantly lower than muscle MDH activity (340 ± 38 units/g protein, n = 4, P < 0.01 in both cases).
Discussion
The introduction of new drugs and the tailoring of these treatments to individual patients, often termed personalized medicine, has led to the need for early, sensitive, and specific biomarkers of treatment response that are good predictors of final outcome (2). FDG-PET has proved useful for monitoring treatment response in many tumor types (21–25). However, it involves a significant dose of ionizing radiation and is of limited value in some tumor types such as prostate cancer (26). Consequently, there is a need for alternative imaging techniques to assess treatment response. One such method is dissolution DNP, which has been used in conjunction with MRI to noninvasively image carbon metabolism in living systems (12, 13, 27). Importantly, this technique does not involve ionizing radiation and exploits endogenous molecules, some of which are already injected into humans. The first example of DNP as an early treatment response biomarker was in the murine lymphoma tumor model used in this study (10). Flux of hyperpolarized 13C label between [1-13C]pyruvate and [1-13C]lactate, in the reaction catalyzed by LDH, showed an early decrease in rate after drug treatment. Subsequent studies have shown that decreased label flux between pyruvate and lactate may be seen after therapy in other tumors, such as mouse models of breast and prostate cancer (28, 29). In the transgenic adenocarcinoma of mouse prostate cancer model, the pretreatment lactate/pyruvate ratio was a predictor of treatment outcome (28); furthermore, pyruvate-lactate flux is a potential marker of prostate tumor progression with levels of hyperpolarized lactate increasing with tumor grade (9).
Although measurements of hyperpolarized 13C label flux between pyruvate and lactate have been used successfully to detect tumor treatment response, the technique relies on negative contrast, i.e., a decrease in the level of labeled lactate after treatment. A technique that results in increased formation of a labeled molecule after treatment could be more sensitive, particularly if there was a low level of signal before treatment. Furthermore, a technique that gives positive contrast is less likely to be confounded by changes in tissue perfusion; for example, in the polarized pyruvate experiment, a decrease in tissue perfusion may produce a decrease in the rate of labeled lactate formation, which could be misinterpreted as a positive response of the tumor cells to treatment.
We have shown here that after injection of hyperpolarized [1,4-13C2]fumarate into tumor cell suspensions and tumor-bearing mice the production of hyperpolarized [1,4-13C2]malate can be detected in real time. In treated cells undergoing drug-induced cell death there was a 19-fold increase in the rate constant describing flux of fumarate to malate. Spectroscopic measurements in tumors at ≈24 h after drug treatment showed a 2.4-fold increase in the rate of malate production compared with untreated controls, which was confirmed by imaging studies. Production of malate was heterogeneous within the tumor, and some malate production was also observed outside the tumor boundary, as defined by the corresponding 1H MR image. This malate outside of the tumor may reflect loss of tumor fumarase into the extracellular space of the surrounding tissue or leakage of labeled malate into this region. Furthermore, some areas of the tumor showed only a low fumarate signal, despite the presence of significant labeled malate production. This low fumarate signal may be caused by variations in tissue perfusion and rapid fumarate consumption: highly necrotic areas are likely to have poor perfusion and high extracellular fumarase activity, which may rapidly convert the small amount of fumarate present to malate.
The much larger treatment response observed in vitro compared with the tumors in vivo likely reflects the pharmacodynamics of the drug: the tumor cells in vivo are exposed to lower concentrations of the drug for a shorter period. Also, it is likely that variations in drug delivery could explain the significant heterogeneity in response within the tumor compared with the relatively homogeneous response to the drug observed in vitro.
Succinate could also be formed from fumarate in the reaction catalyzed by succinate dehydrogenase; however, this was not observed in these studies. Fumarase exists as both cytosolic and mitochondrial isoforms and the relative activity of these two isoforms can vary markedly between tissues and between species (30, 31). The increase in labeled malate production in treated tumors cannot be explained by changes in fumarase activity, because a decrease in enzyme activity was observed in extracts of treated tumors. The decrease in fumarase activity corresponded closely to the decrease in MDH activity, suggesting that it might simply be caused by leakage of the enzymes from necrotic cells. However, the increase in labeled malate production can be explained by increased access of fumarate to the enzyme. When the plasma membrane permeability barrier was removed by the onset of necrosis in isolated lymphoma cells, there was a marked increase in the rate of hyperpolarized [1,4-13C2]malate production and this rate correlated with the extent of necrosis (Fig. 2B). Fumarate is transported across the plasma membrane by the sodium-dependent dicarboxylate acid transporter, which also transports succinate (15–20); fumarate transport across the mitochondrial membrane occurs in exchange for malate, inorganic phosphate, or aspartate (32). Consistent with the hypothesis that necrosis mediates increased hyperpolarized [1,4-13C2]malate production, the presence of succinate had no effect on the rate of label flux between fumarate and malate when it was coadministered with the hyperpolarized [1,4-13C2]fumarate to tumor cell suspensions.
Several factors make the fumarase reaction suitable as an in vivo biomarker of tissue necrosis: first, no coenzymes or cosubstrates (other than water) are required for the reaction, so therefore even during cell death the enzyme will continue to function; second, the equilibrium constant for the reaction is ≈4, which favors the formation of malate (33), and third, fumarase is exclusively intracellular.
It seems likely that necrosis is also responsible for the increased production of malate after drug treatment in vivo. The plasma membrane may become permeable to small molecules, such as fumarate, allowing the hyperpolarized fumarate to bypass the plasma membrane transporter. Alternatively, fumarase may be released into the tumor interstitium, where it may bind to the extracellular matrix or remain transiently because of poor tissue perfusion. Increased malate production could also be caused by mitochondrial membrane rupture, which occurs before plasma membrane damage after the onset of necrosis and would release the enzyme into the cytosol. However, the fact that coadministration of succinate did not inhibit the rate of malate production in cell suspensions suggests that it is not the major mechanism.
Previous histological analysis of tumor sections in this tumor model have shown that etoposide treatment typically results in an increase in the combined apoptotic and necrotic cell fraction from ≈5% in control tumors to ≈30% at 24 h after drug treatment (14, 34); however, it is difficult to distinguish between apoptotic and necrotic cells in these sections. The 2.4-fold increase in fumarate-malate flux that was observed here in drug-treated tumors is consistent with this finding and suggests that a significant proportion of this 30% represents necrosis. Although diffusion-weighted MRI measures loss of cellularity, the downstream consequence of necrosis, previous work in this tumor model has shown that there are only relatively small changes in diffusion-weighted MRI 24 h after treatment: the apparent diffusion coefficient of water increases ≈20% (35).
Differentiating apoptosis from necrosis by using an imaging probe is difficult. Detection of apoptosis in vivo has largely relied on the externalization of phosphatidylserine (PS) from the inner to the outer leaflet of the plasma membrane bilayer, where it can be bound by an appropriately labeled imaging probe (36, 37). However, necrosis also results in PS in the inner leaflet becoming accessible to these agents (4); therefore, imaging probes that target PS usually measure both necrosis and apoptosis. There is a growing appreciation of the role of nonapoptotic and caspase-independent mechanisms in treatment response (5, 38). Necrosis can be induced by anticancer drugs, such as DNA-alkylating agents, and some human chemotherapeutic drugs have been shown to produce a larger degree of necrosis than apoptosis and this necrotic cell death may be associated with better survival (5, 39). Furthermore, because necrosis can lead to inflammation, and a sustained inflammatory response can stimulate tumor development, there is indirect evidence for a role of necrosis in tumor development (5).
In conclusion, we have demonstrated a positive contrast agent for detecting tumor cell necrosis in vivo by measuring the production of malate from hyperpolarized 13C-labeled fumarate. Preliminary measurements with a human breast tumor cell line have shown that the technique produces similar results in another tumor type (29). Potentially, this could be used in conjunction with measurements of pyruvate-lactate flux to probe two stages of cell death as a measure of treatment response. It may also have applications in other diseases where necrosis is a pathological feature such as inflammation, infection, or ischemia (4). The clinical potential of the technique is supported by the fact that fumarate is already used as a counter ion in a number of drug preparations and oral fumarate esters are used in the treatment of psoriasis and multiple sclerosis (40, 41). The first in-human trials of DNP are due to take place within the next year (42).
Materials and Methods
Polarization of Fumaric Acid.
All chemicals were obtained from Sigma/Aldrich unless stated otherwise. [1,4-13C2]fumaric acid (3.23 mmol; Cambridge Isotope Laboratories) was dissolved in 8.74 mmol of DMSO containing 11.48 μmol of a trityl radical (AH111501; GE Healthcare) and 0.48 μmol of a gadolinium chelate [Gd-3; GE Healthcare (11)]. The solution was sonicated and centrifuged, and a 40 mg aliquot was hyperpolarized by using a method similar to that described (8, 10). Briefly, the sample was cooled to ≈1.2 K while irradiated with microwaves at 93.975 GHz and 100 mW for 1 h and then dissolved in 6 mL of buffer containing 40 mM phosphate, 50 mM sodium chloride, and 40 mM sodium hydroxide, pH 7.4 at 10 bar and 180 °C. The resulting solution contained 20 mM [1,4-13C2]fumarate, which was then cooled to ≈37 °C before injection into either a cell suspension or i.v. into a tumor-bearing animal. The level of polarization was determined by comparing the signal intensity from the hyperpolarized sample to that observed at thermal equilibrium (12).
Cell Experiments.
EL-4 murine lymphoma cells were grown in RPMI medium 1640 (Invitrogen) supplemented with 10% FCS (PAA Laboratories), 100 units/mL penicillin, and 100 μg/mL streptomycin (Invitrogen). Cells (≈5 × 10⁷) were washed once in medium at 37 °C and then resuspended in 2 mL of the same medium before transfer to a 10-mm NMR tube. The tube was placed in a broadband probe (Varian) tuned to 101 MHz, in a vertical wide-bore (8.9 cm) Oxford Instruments magnet (9.4 T) interfaced to a Varian INOVA spectrometer. The sample temperature was 37 °C, and 2 mL of the hyperpolarized [1,4-13C2]fumarate solution was injected via a fine bore tube; the final concentration of fumarate was therefore 10 mM. 13C spectra were acquired with proton-decoupling and low flip-angle RF pulses (14°): 2-μs pulse width; 2-s repetition time; 4-kHz spectral width collected into 2,040 data points; 5-Hz exponential line broadening.
The area under each peak was used to calculate the concentrations of labeled metabolites. [1,4-13C2]fumarate produces a single peak, whereas [1,4-13C2]malate gives two resonances, because the carbons are inequivalent (Fig. 1). These were combined to produce a single intensity measurement, which assumes that the 13C at C1 and C4 has similar T1 relaxation times. The signal intensities were fitted to a two-site exchange model to obtain a rate constant describing flux of hyperpolarized 13C label between fumarate and malate. kF is the apparent rate constant for the conversion of fumarate to malate, and kM is the apparent rate constant for the reverse reaction. These are apparent rate constants because they not only describe flux in the fumarase-catalyzed reaction but also substrate transport across the plasma and mitochondrial membranes. The decay of hyperpolarization in fumarate and malate is described by the time constants TF and TM, respectively. For the purposes of comparison, the data were plotted as the hyperpolarized 13C-labeled malate signal divided by the total hyperpolarized 13C-labeled signal over time (± SD). The rate of malate production was calculated from the initial slope of this curve (Fig. 2).
For cell experiments involving coadministration of 50 mM sodium succinate (at pH 7.5), the succinate was added simultaneously with the labeled fumarate. At the end of each experiment, the cells were counted with a hemocytometer, and cell viability was assessed by using trypan blue (0.4%, in 0.81% sodium chloride and 0.06% potassium phosphate). Drug-treated cells were incubated with 15 μM etoposide (Eposin, 20 mg/mL; PCH Pharmachemie) for between 14 and 16 h before the NMR experiment. Lysed cell extracts were prepared by freeze-thawing the cells twice before returning them to 37 °C.
Tumor Experiments.
Tumors were grown by implanting ≈5 × 10⁶ EL-4 cells s.c. into female C57BL/6 mice and imaged 9 days after cell implantation. All procedures were carried out in accordance with the Animals (Scientific Procedures) Act of 1986 (U.K.) and were designed with reference to the U.K. Coordinating Committee on Cancer Research Guidelines for the Welfare of Animals in Experimental Neoplasia. 13C spectra were acquired at 2.35 T (Bruker Biospec Avance II) by using a 20-mm diameter surface coil placed around the tumor. Animals were anesthetized with 2% isoflurane and a 1:1 mixture of N2O and O2. Breathing rate and body temperature were monitored throughout the experiments (SA Instruments). Hyperpolarized [1,4-13C2]fumarate (200 μL) was injected i.v. via a tail vein catheter over a period of 6 s. Slice-selective free induction decays were acquired with a 10° flip angle RF pulse, repetition time (TR) 3 s, 60 repetitions, and slice thickness of 5 mm. On day 10, the mice were injected i.p. with 2 mg of etoposide (300 μL diluted 1:2 in saline). At 22–26 h after etoposide treatment, the MR experiments were repeated after another injection of hyperpolarized [1,4-13C2]fumarate. Spectra were analyzed in the time domain by using a java-based MR user interface (jMRUI). Signal amplitudes for [1,4-13C2]fumarate and the combined signal from [1-13C]malate and [4-13C]malate were fitted to a modified two-site exchange model and the apparent exchange rate constants (kF and kM), and the T1 relaxation times (TF and TM) were obtained. The exchange rate constants in vivo will be affected not only by membrane transport but also by the arterial input function, which was incorporated into the model shown below
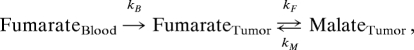 |
where kB is the rate of inflow of hyperpolarized fumarate into the tumor during i.v. injection of fumarate (which took place over the first 6 s). This model assumes that only fumarate (and not malate) perfuses into the tumor and that the washout of fumarate and malate from the tumor is negligible.
13C CSIs were acquired from two 5-mm transverse slices through each tumor 30 s after injection with hyperpolarized [1,4-13C2]fumarate. The imaging sequence was the same as that used for the spectroscopic measurements, with additional phase-encoding gradients preceding signal acquisition: field of view 35 × 35 mm; elliptical centric k-space acquisition; total acquisition time 5 s. False-color images were produced for each metabolite by using a CSI data matrix of 16 × 16, and the images were zero-filled by using a linear interpolation algorithm but no correction was made for loss of signal caused by T1 decay. Both the malate and fumarate signals in each voxel were normalized to the voxel containing the maximum malate or fumarate signal in the respective image. To reduce the effects of noise, voxels with signal intensities that were ≤20% of the maximum signal intensity were removed from the image.
Enzyme Assays.
Tumors were freeze-clamped for measurements of fumarase and MDH activity. The animals were prepared in an identical way as those used in the MR experiments: 200 μL of 20 mM hyperpolarized [1,4-13C2]fumarate was injected and after 30 s (which equates to the time point at which the images were acquired), the mice were killed by cervical dislocation, and the tumors and some muscle tissue were freeze-clamped in liquid nitrogen-cooled tongs. Each frozen sample was homogenized in four times its weight of PBS at 4 °C and 200 μL of this homogenized solution was sonicated (Vibra-Cell; Sonics) on ice for 1 min. After centrifugation for 10 min at 10,000 × g, 120 μL of the supernatant was removed for measurement of enzyme activity.
Fumarase activity was assayed spectrophotometrically by measuring the conversion of malate to fumarate from the increase in absorbance at 240 nm (43). Thirty-three microliters of a 1:10 dilution of tissue extract was added to 100 μL of 100 mM sodium phosphate buffer (pH 7.6) containing 50 mM malate; the absorbance change was recorded for 2 min at 25 °C. Fumarase activity is expressed as units/g protein, using an extinction coefficient for fumarate of 2.44 cm2/μmol.
MDH activity was also assayed spectrophotometrically by measuring the oxidation of NADH accompanying the conversion of oxaloacetate to malate (44). Tissue extract (20 μL of a 1:10 dilution) was added to 3 mL of 50 mM phosphate buffer (pH 7.5) containing 50 μL of a 10 mg/mL solution of NADH (pH 7.5) and 100 μL of a 2 mg/mL solution of oxaloacetate. The decrease in NADH absorbance at 340 nm was measured over a period of 2 min at 37 °C. MDH activity is expressed as units/g protein, using an extinction coefficient for NADH of 6.22 cm2/μmol. Protein content was determined by using bicinchoninic acid and copper (II) sulfate (BCA1; Sigma).
Statistical analyses were performed by using Student's t test and correlation coefficients (Excel, Microsoft).
Acknowledgments.
We thank Jan Henrik Ardenkjær-Larsen for help and advice. This work was supported by a Cancer Research U.K. grant (to K.M.B.) and GE Healthcare. F.A.G. was supported by grants from Cancer Research U.K., the Royal College of Radiologists U.K., and the National Institute for Health Research Cambridge Biomedical Research Centre. T.H.W. was supported by a Biotechnology and Biological Sciences Research Council U.K. Collaborative Awards in Science and Engineering studentship with GE Healthcare. S.K.N. was supported by a Minority Health and Health Disparities International Research Training grant from the National Institutes of Health to the University of Arizona.
Footnotes
Conflict of interest statement: Grant funding was provided by GE Healthcare.
Lerche M, Experimental Nuclear Magnetic Resonance Conference, March 14–19, 2008, Pacific Grove, CA.
References
- 1.Eisenhauer EA, et al. New response evaluation criteria in solid tumors: Revised RECIST guideline (version 1.1) Eur J Cancer. 2009;45:228–247. doi: 10.1016/j.ejca.2008.10.026. [DOI] [PubMed] [Google Scholar]
- 2.Brindle K. New approaches for imaging tumor responses to treatment. Nat Rev Cancer. 2008;8:94–107. doi: 10.1038/nrc2289. [DOI] [PubMed] [Google Scholar]
- 3.Sun X, et al. Selective induction of necrotic cell death in cancer cells by βa-lapachone through activation of DNA damage response pathway. Cell Cycle. 2006;5:2029–2035. doi: 10.4161/cc.5.17.3312. [DOI] [PubMed] [Google Scholar]
- 4.Verheij M. Clinical biomarkers and imaging for radiotherapy-induced cell death. Cancer Metastasis Rev. 2008;27:471–480. doi: 10.1007/s10555-008-9131-1. [DOI] [PubMed] [Google Scholar]
- 5.de Bruin EC, Medema JP. Apoptosis and nonapoptotic deaths in cancer development and treatment response. Cancer Treat Rev. 2008;34:737–749. doi: 10.1016/j.ctrv.2008.07.001. [DOI] [PubMed] [Google Scholar]
- 6.Koh DM, Collins DJ. Diffusion-weighted MRI in the body: Applications and challenges in oncology. Am J Roentgenol. 2007;188:1622–1635. doi: 10.2214/AJR.06.1403. [DOI] [PubMed] [Google Scholar]
- 7.Radda GK. The use of NMR spectroscopy for the understanding of disease. Science. 1986;233:640–645. doi: 10.1126/science.3726553. [DOI] [PubMed] [Google Scholar]
- 8.Ardenkjaer-Larsen JH, et al. Increase in signal-to-noise ratio of >10,000 times in liquid-state NMR. Proc Natl Acad Sci USA. 2003;100:10158–10163. doi: 10.1073/pnas.1733835100. [DOI] [PMC free article] [PubMed] [Google Scholar]
- 9.Albers MJ, et al. Hyperpolarized 13C lactate, pyruvate, and alanine: Noninvasive biomarkers for prostate cancer detection and grading. Cancer Res. 2008;68:8607–8615. doi: 10.1158/0008-5472.CAN-08-0749. [DOI] [PMC free article] [PubMed] [Google Scholar]
- 10.Day SE, et al. Detecting tumor response to treatment using hyperpolarized 13C magnetic resonance imaging and spectroscopy. Nat Med. 2007;13:1382–1387. doi: 10.1038/nm1650. [DOI] [PubMed] [Google Scholar]
- 11.Gallagher FA, et al. Magnetic resonance imaging of pH in vivo using hyperpolarized 13C-labeled bicarbonate. Nature. 2008;453:940–943. doi: 10.1038/nature07017. [DOI] [PubMed] [Google Scholar]
- 12.Gallagher FA, Kettunen MI, Day SE, Lerche M, Brindle KM. 13C magnetic resonance spectroscopy measurements of glutaminase activity in human hepatocellular carcinoma cells using hyperpolarized 13C-labeled glutamine. Magn Reson Med. 2008;60:253–257. doi: 10.1002/mrm.21650. [DOI] [PubMed] [Google Scholar]
- 13.Golman K, Zandt RI, Lerche M, Pehrson R, Ardenkjaer-Larsen JH. Metabolic imaging by hyperpolarized 13C magnetic resonance imaging for in vivo tumor diagnosis. Cancer Res. 2006;66:10855–10860. doi: 10.1158/0008-5472.CAN-06-2564. [DOI] [PubMed] [Google Scholar]
- 14.Witney TH, et al. A comparison between radiolabeled fluorodeoxyglucose uptake and hyperpolarized 13C-labeled pyruvate utilization as methods for detecting tumor response to treatment. Neoplasia. 2009;6:574–582. doi: 10.1593/neo.09254. [DOI] [PMC free article] [PubMed] [Google Scholar]
- 15.Kekuda R, et al. Primary structure and functional characteristics of a mammalian sodium-coupled high affinity dicarboxylate transporter. J Biol Chem. 1999;274:3422–3429. doi: 10.1074/jbc.274.6.3422. [DOI] [PubMed] [Google Scholar]
- 16.Kippen I, Hirayama B, Klinenberg JR, Wright EM. Transport of tricarboxylic acid cycle intermediates by membrane vesicles from renal brush border. Proc Natl Acad Sci USA. 1979;76:3397–3400. doi: 10.1073/pnas.76.7.3397. [DOI] [PMC free article] [PubMed] [Google Scholar]
- 17.Wolffram S, Hagemann C, Grenacher B, Scharrer E. Characterization of the transport of tri- and dicarboxylates by pig intestinal brush-border membrane vesicles. Comp Biochem Physiol Comp Physiol. 1992;101:759–767. doi: 10.1016/0300-9629(92)90355-t. [DOI] [PubMed] [Google Scholar]
- 18.Wright EM, Wright SH, Hirayama B, Kippen I. Interactions between lithium and renal transport of Krebs cycle intermediates. Proc Natl Acad Sci USA. 1982;79:7514–7517. doi: 10.1073/pnas.79.23.7514. [DOI] [PMC free article] [PubMed] [Google Scholar]
- 19.Wright SH, Kippen I, Klinenberg JR, Wright EM. Specificity of the transport system for tricarboxylic acid cycle intermediates in renal brush borders. J Membr Biol. 1980;57:73–82. doi: 10.1007/BF01868987. [DOI] [PubMed] [Google Scholar]
- 20.Wright SH, Kippen I, Wright EM. Stoichiometry of Na+-succinate cotransport in renal brush-border membranes. J Biol Chem. 1982;257:1773–1778. [PubMed] [Google Scholar]
- 21.Chowdhury FU, Bradley KM, Gleeson FV. The role of 18F-FDG PET/CT in the evaluation of oesophageal carcinoma. Clin Radiol. 2008;63:1297–1309. doi: 10.1016/j.crad.2008.05.010. [DOI] [PubMed] [Google Scholar]
- 22.Margolis DJ, et al. Molecular imaging techniques in body imaging. Radiology. 2007;245:333–356. doi: 10.1148/radiol.2452061117. [DOI] [PubMed] [Google Scholar]
- 23.Schoder H, Moskowitz C. PET imaging for response assessment in lymphoma: Potential and limitations. Radiol Clin North Am. 2008;46:225–241. viii. doi: 10.1016/j.rcl.2008.04.002. [DOI] [PubMed] [Google Scholar]
- 24.Sullivan DC, Kelloff G. Seeing into cells: The promise of in vivo molecular imaging in oncology. EMBO Rep. 2005;6:292–296. doi: 10.1038/sj.embor.7400382. [DOI] [PMC free article] [PubMed] [Google Scholar]
- 25.Tardivon AA, Ollivier L, El Khoury C, Thibault F. Monitoring therapeutic efficacy in breast carcinomas. Eur Radiol. 2006;16:2549–2558. doi: 10.1007/s00330-006-0317-z. [DOI] [PubMed] [Google Scholar]
- 26.Salminen E, Hogg A, Binns D, Frydenberg M, Hicks R. Investigations with FDG-PET scanning in prostate cancer show limited value for clinical practice. Acta Oncol. 2002;41:425–429. doi: 10.1080/028418602320405005. [DOI] [PubMed] [Google Scholar]
- 27.Golman K, et al. Cardiac metabolism measured noninvasively by hyperpolarized 13C MRI. Magn Reson Med. 2008;59:1005–1013. doi: 10.1002/mrm.21460. [DOI] [PubMed] [Google Scholar]
- 28.Chen AP, et al. Serial hyperpolarized 13C 3D-MRSI following therapy in a mouse model of prostate cancer. Proc Intl Soc Mag Reson Med. 2008;16:888. [Google Scholar]
- 29.Witney TH, et al. Noninvasive detection of cell death in MCF-7 breast cancer cells by hyperpolarized 13C MRS. Proc Intl Soc Mag Reson Med. 2009;17:1276. [Google Scholar]
- 30.Akiba T, Hiraga K, Tuboi S. Intracellular distribution of fumarase in various animals. J Biochem. 1984;96:189–195. doi: 10.1093/oxfordjournals.jbchem.a134812. [DOI] [PubMed] [Google Scholar]
- 31.Donnelly DF, O'Hare MC, Doonan S. The subcellular distribution of fumarase isozymes in rat liver. Int J Biochem. 1985;17:279–282. doi: 10.1016/0020-711x(85)90128-4. [DOI] [PubMed] [Google Scholar]
- 32.Passarella S, Atlante A, Valenti D, de Bari L. The role of mitochondrial transport in energy metabolism. Mitochondrion. 2003;2:319–343. doi: 10.1016/S1567-7249(03)00008-4. [DOI] [PubMed] [Google Scholar]
- 33.Keruchenko JS, Keruchenko ID, Gladilin KL, Zaitsev VN, Chirgadze NY. Purification, characterization, and preliminary X-ray study of fumarase from Saccharomyces cerevisiae. Biochim Biophys Acta. 1992;1122:85–92. doi: 10.1016/0167-4838(92)90131-v. [DOI] [PubMed] [Google Scholar]
- 34.Schmitz JE, Kettunen MI, Hu DE, Brindle KM. 1H MRS-visible lipids accumulate during apoptosis of lymphoma cells in vitro and in vivo. Magn Reson Med. 2005;54:43–50. doi: 10.1002/mrm.20529. [DOI] [PubMed] [Google Scholar]
- 35.Kettunen MI, Hu DE, Brindle KM. Comparison of T1ρ and diffusion response following chemotherapy in mouse EL4 tumors at 9.4 T. Proc Intl Soc Mag Reson Med. 2006;14:3174. [Google Scholar]
- 36.Blankenberg FG, et al. In vivo detection and imaging of phosphatidylserine expression during programmed cell death. Proc Natl Acad Sci USA. 1998;95:6349–6354. doi: 10.1073/pnas.95.11.6349. [DOI] [PMC free article] [PubMed] [Google Scholar]
- 37.Zhao M, Beauregard DA, Loizou L, Davletov B, Brindle KM. Noninvasive detection of apoptosis using magnetic resonance imaging and a targeted contrast agent. Nat Med. 2001;7:1241–1244. doi: 10.1038/nm1101-1241. [DOI] [PubMed] [Google Scholar]
- 38.Leist M, Jaattela M. Four deaths and a funeral: From caspases to alternative mechanisms. Nat Rev Mol Cell Biol. 2001;2:589–598. doi: 10.1038/35085008. [DOI] [PubMed] [Google Scholar]
- 39.Olofsson MH, et al. Cytokeratin-18 is a useful serum biomarker for early determination of response of breast carcinomas to chemotherapy. Clin Cancer Res. 2007;13:3198–3206. doi: 10.1158/1078-0432.CCR-07-0009. [DOI] [PubMed] [Google Scholar]
- 40.Moharregh-Khiabani D, Linker RA, Gold R, Stangel M. Fumaric acid and its esters: An emerging treatment for multiple sclerosis. Curr Neuropharmacol. 2009;7:60–64. doi: 10.2174/157015909787602788. [DOI] [PMC free article] [PubMed] [Google Scholar]
- 41.Mrowietz U, Asadullah K. Dimethylfumarate for psoriasis: More than a dietary curiosity. Trends Mol Med. 2005;11:43–48. doi: 10.1016/j.molmed.2004.11.003. [DOI] [PubMed] [Google Scholar]
- 42.Nelson SJ. Implementation and applications of hyperpolarized C-13 MRI in medicine. Proc Intl Soc Mag Reson Med. 2008;16:828. [Google Scholar]
- 43.Stitt M. Methods of Enzymatic Analysis IV. Weinheim, Germany: Verlag Chemie; 1984. pp. 359–362. [Google Scholar]
- 44.Smith AF. Methods of Enzymatic Analysis III. Weinheim, Germany: Verlag Chemie; 1983. pp. 163–171. [Google Scholar]