

Abstract
The Plasmodium falciparum circumsporozoite protein (CSP) is critical for sporozoite function and invasion of hepatocytes. Given its critical nature, a phase III human CSP malaria vaccine trial is ongoing. The CSP is composed of three regions as follows: an N terminus that binds heparin sulfate proteoglycans, a four amino acid repeat region (NANP), and a C terminus that contains a thrombospondin-like type I repeat (TSR) domain. Despite the importance of CSP, little is known about its structure. Therefore, recombinant forms of CSP were produced by expression in both Escherichia coli (Ec) and then refolded (EcCSP) or in the methylotrophic yeast Pichia pastoris (PpCSP) for structural analyses. To analyze the TSR domain of recombinant CSP, conformation-dependent monoclonal antibodies that recognized unfixed P. falciparum sporozoites and inhibited sporozoite invasion of HepG2 cells in vitro were identified. These monoclonal antibodies recognized all recombinant CSPs, indicating the recombinant CSPs contain a properly folded TSR domain structure. Characterization of both EcCSP and PpCSP by dynamic light scattering and velocity sedimentation demonstrated that both forms of CSP appeared as highly extended proteins (Rh 4.2 and 4.58 nm, respectively). Furthermore, high resolution atomic force microscopy revealed flexible, rod-like structures with a ribbon-like appearance. Using this information, we modeled the NANP repeat and TSR domain of CSP. Consistent with the biochemical and biophysical results, the repeat region formed a rod-like structure about 21–25 nm in length and 1.5 nm in width. Thus native CSP appears as a glycosylphosphatidylinositol-anchored, flexible rod-like protein on the sporozoite surface.
Malaria caused by Plasmodium falciparum is a serious global health issue, resulting in an estimated 1.5 million deaths annually, primarily among infants and young children. Ongoing multifaceted global intervention strategies to control malaria include drug treatment, insecticide usage, bed-net use, and vaccine development. However, parasite and mosquito control measures have met with limited success resulting from an increased drug and insecticide resistance within the Plasmodia and mosquito populations, respectively. Vaccine development represents an encouraging approach given that previous animal and human studies using irradiated sporozoites demonstrated the feasibility of producing an efficacious vaccine (1–3). Although the exact immunologic correlates of protection remain elusive, an abundance of evidence indicates that protection against liver stage parasites is complex, involving multiple immune mechanisms (4–11).
To date, the majority of the pre-erythrocytic stage vaccine development has focused on the circumsporozoite protein (CSP),2 the predominant surface antigen on sporozoites. CSP can be segmented into three regions as follows: the N-terminal region containing region I; the central repeat region; and the C-terminal region containing the thrombospondin-like type I repeat (TSR). Initial CSP vaccine development focused on the central repeat region that contains the immunodominant B cell epitope (12). However, vaccine constructs quickly evolved to incorporate both the central repeat region containing the B cell epitopes and the C terminus containing the TSR domain, T cell epitopes, and B cell epitopes (13, 14). Currently, the most advanced and moderately effective malaria vaccine, RTS,S, is composed of a portion of the central repeat and the C-terminal regions linked to the hepatitis B surface antigen (15). However, recent studies have highlighted the physiological importance of the N-terminal region (16–19). Rathore et al. (19) not only demonstrated the role of the N-terminal region in liver cell attachment but also identified along with Ancsin and Kisilevsky (16) an epitope within the N-terminal region that interacted with liver cells through heparin sulfate (18). Moreover, this epitope was not only found to be immunogenic but the resulting antibodies were determined to be inhibitory in a sporozoite invasion assay (18). Peptides corresponding to the N-terminal region (PpCS-(22–110) and PpCS-(65–110)) were also recognized by sera obtained from individuals living in malaria-endemic regions (17).
To better understand the structure of CSP and to produce good quality recombinant protein for human vaccine-directed studies, we generated full-length and near full-length recombinant CSP. We examined two expression systems, Escherichia coli and Pichia pastoris, to determine their feasibility to generate CSP. To assist the characterization of the rCSPs, we generated a panel of monoclonal antibodies (mAbs) that were characterized biologically prior to being used to examine the rCSPs. Additionally, each of the rCSP molecules was extensively biochemically and biophysically characterized. The results collated together have enabled the molecular modeling of CSP as a long flexible, rod-like protein.
EXPERIMENTAL PROCEDURES
Antibody Production
To generate antibodies toward CSP, we utilized a Saccharomyces cerevisiae-expressing CSP (ScCSP) clone generated by David Kaslow.3 The 3D7 DNA sequence (GenBankTM accession number XM_001351086) corresponding to CSP amino acids Phe20 to Ser384 was cloned into the Saccharomyces expression vector YEpRPEU3 using the cloning sites NheI and ApaI. The resulting transcribed gene contained a His6 tag. The sequence of CSP was verified prior to fermentation. Fermentation material was produced as described previously (20) and purified using a two-step purification scheme: nickel affinity chromatography followed by size exclusion chromatography. Purified ScCSP was supplied to A&G Pharmaceutical, Inc. (Columbia, MD) to generate a panel of mAbs. Mice were boosted twice with a fragment ScCSP with an N-terminal sequence beginning at amino acid Ser301 (GenBankTM accession number XM_001351086). Hybridoma supernatants were screened by Western blot against sporozoite lysates and confocal microscopy of live sporozoites. Antibodies determined to be reduction-sensitive were isotyped and subclassed using the Thermo Scientific Pierce rapid isotyping kit per the manufacturer's instructions (Thermo Fisher Scientific).
Inhibition of Sporozoite Invasion (ISI) Assay
To ascertain whether or not the mAbs generated toward the ScCSP had biological significance, they were examined using an in vitro assay to determine their ability to inhibit sporozoite invasion of HepG2 cells. In brief, analysis of the invasion of HepG2 clone A16 cells (21) by P. falciparum sporozoites (strain NF54) in the presence or absence of test anti-CSP IgG was performed using qRT-PCR to determine the percent invasion of the HepG2 cells. The details for the ISI assay are provided below.
ISI Assay, Preparation of Host Hepatocytes and P. falciparum Sporozoites
Each well of a 48-well plate (Nalge Nunc International, Rochester, NY) was coated with ECL cell attachment matrix (catalog number 08-110, Millipore, Billerica, MA) in Hanks' balanced salt solution (Invitrogen) at 37 °C for 1 h. This ECL solution was aspirated immediately prior to adding the HepG2 cells.
HepG2 cells were maintained in Eagle's essential minimum complete media (ECM), Eagle's essential minimum media (Invitrogen) containing 10% fetal bovine serum (Sigma), 1% 100× l-glutamine, and 1% penicillin/streptomycin (10,000 units/ml) (Invitrogen). In preparation for seeding, HepG2 cells were trypsinized, washed, and resuspended in ECM to a final concentration of 300,000 cells/ml. After aspiration of ECL solution, 300 μl of the HepG2 cell suspension was added to each well and incubated overnight at 37 °C.
P. falciparum sporozoites (strain NF54) were grown in Anopheles stephensi adult female mosquitoes until harvest. Mosquitoes were collected in a cylindrical chamber, placed at −20 °C for 5–10 min, and soaked in 70% ethanol. They were then serially washed in Dulbecco's modified Eagle's medium (Invitrogen) containing penicillin/streptomycin plus antibiotic-antimycotic (Invitrogen) and ECM. Each mosquito was dissected by separating the head from the thorax and removing the salivary glands from the head and/or thorax. The salivary glands were stored in ECM at room temperature until use. After all mosquitoes were dissected, the salivary glands were pooled and disrupted by passing through a 28½-gauge needle. The sporozoites released from the salivary glands were counted and diluted in ECM to a final concentration of 500,000 sporozoites/ml.
ISI Assay, Sporozoite Invasion of HepG2 Cells, and Preparation of HepG2 Cells/Parasites for RNA Isolation
Each serum sample to be tested was diluted in ECM to 2× the desired final concentration. The anti-sporozoite (CSP) antibody, navy falciparum sporozoite antibody 1 (NFS1) (developed by immunizing mice with whole sporozoites), used as a positive control, was diluted to a concentration of 200 μg/ml. For each well, 55 μl of the test or control serum was mixed with 55 μl of the sporozoite suspension and incubated at room temperature for 20 min. Old medium was aspirated, and then 100 μl of each sporozoite/serum mixture was added to each well and incubated for 3 h at 37 °C. After the 3-h invasion incubation, each well was washed twice with fresh ECM and incubated overnight (15–21 h) at 37 °C.
To generate a standard curve for the qRT-PCR, sporozoites were serially diluted in ECM (4,860 to 20 sporozoites), added to HepG2 monolayers. Total host-cell/parasite material was collected and stored at −80 °C until RNA extraction. Following an overnight incubation at 37 °C, HepG2 cells were washed at room temperature, trypsinized at 37 °C, and transferred to an RNase-free microcentrifuge tube. Free sporozoites were removed by twice pelleting the host cells at 1500 rpm for 2 min. The pellet was stored at −80 °C or used directly for RNA extraction.
ISI Assay, RNA Extraction, and qRT-PCR
RNA was extracted and isolated from host cell/parasite material using the RNeasy mini kit (Qiagen, Valencia, CA), and RNA quality was assessed in a GeneQuant Pro DNA/RNA calculator (GE Healthcare) using quartz capillaries (GE Healthcare). Only RNA with an A260/280 ratio greater than 1.9 was used in further experiments. RNA was uniformly diluted to <100 ng/ml, added to PCR plates, and then transcribed to cDNA using the high capacity cDNA reverse transcription kit (Applied Biosystems, Foster City, CA). Reaction volumes of 20 μl were used in a Thermal Cycler (MJ Research Inc., Waltham, MA) set at the following amplification cycle: 25 °C for 10 min; 37 °C for 120 min; 85 °C for 5 s; hold at 4 °C. The resulting cDNA was used immediately or stored at −20 °C.
The following probe and primers were used to detect parasite 18 S rRNA: Taqman® MGB probe (Applied Biosystems, sequence 5′-6FAM-CAG GTC TGT GAT GTC C-MGBNFQ-3′); sequence detection primer 1 (Applied Biosystems, sequence 5′-TAA CAC AAG GAA GTT TAA GGC AAC A-3′); sequence detection primer 2 (Applied Biosystems, sequence 5′-CGC GTG CAG CCT AGT TTA TCT-3′). To prepare the qRT-PCR plate, cDNA (∼15–20 ng/ml), probe (250 nm), and primers (600 nm) were mixed with TaqMan® Fast Universal PCR Master Mix (Applied Biosystems) to a total volume of 20 μl per reaction in a MicroAmp Fast Optical 96-well reaction plate (Applied Biosystems). The reaction plate was then placed in a 7500 Fast Real Time PCR system (Applied Biosystems) to quantify parasite 18 S rRNA using the default thermal cycling conditions as follows: stage 1 enzyme activation, 95 °C for 20 s; stage 2 (repeated 40 times), melting at 95 °C for 3 s, annealing, and polymerizing at 60 °C for 30 s. Results were analyzed automatically once after each run was completed. Experimental samples were compared with the standard curve generated from host cell/sporozoite mixtures containing known numbers of sporozoites. The percent inhibition was determined by comparing the number of sporozoites invaded after mAb treatment with the number of sporozoites invaded without mAb treatment.
SDS-PAGE and Western Blot
Sporozoite extract, equivalent to ∼2 × 10⁶ sporozoites per lane, was loaded onto a 4–12% gradient BisTris gel under reducing and nonreducing conditions. Samples analyzed under reduced conditions were either mixed with dithiothreitol (DTT) (Sigma) at a final concentration of 50 mm (reduced) or mixed with DTT followed by treatment with iodoacetamide (Sigma) at a final concentration of 200 mm (reduced and alkylated). Following the electrophoretic separation, proteins were transferred onto a nitrocellulose membrane for immunoblotting using standard methods (22, 23). All washes were performed in 1× PBS with 0.5% Tween 20. Development of the membrane was performed by incubating the nitrocellulose membrane with 0.5 μg/ml purified IgG from the CSP-specific mAbs diluted in blocking buffer (1× PBS, 0.5% Tween 20, and 5% skim milk). Primary antibody was detected with goat anti-mouse alkaline phosphatase-conjugated secondary antibody. Detection was achieved using the 5-bromo-4-chloro-3-indolyl phosphate/nitro blue tetrazolium-component phosphatase substrate (Kirkegaard & Perry Laboratories Inc., Gaithersburg, MD), as per the manufacturer's instructions. SDS-PAGE analysis of recombinant protein was performed on 4–12% gradient BisTris polyacrylamide gels (Bio-Rad) under nonreducing and reduced/alkylated conditions. Immunoblotting was performed as described above using 4–12% gradient BisTris polyacrylamide gels (Bio-Rad) under nonreducing, reducing, and reduced/alkylated conditions.
Immunofluorescence Assay and Confocal Microscopy
Immunofluorescence assay analysis was performed as per standard protocol (24). Sporozoites collected by the Ozaki method were washed with RPMI medium and incubated with blocking media (1× PBS, 3% bovine serum albumin) at 4 °C (25). All primary and secondary antibody incubations were carried out at 4 °C and separated by extensive washing with PBS containing 0.05% Tween 20 (Bio-Rad). The samples were mounted under coverslips using Vectashield hard-set mounting medium and then stored at 4 °C until images were acquired by confocal microscopy as described previously (24). A Leica SP2 confocal microscope using Leica confocal software was used for image acquisition. All images were collected by using a PL APO ×100/1.4 oil immersion objective and a confocal zoom of ×6. Alexa 488 conjugate was excited by an argon laser (488 nm). All images were collected as three-dimensional data sets (z-stacks) with a step size of 0.1221 nm between the successive optical sections. De-convolution of all image stacks was performed using Huygens Essential (Scientific Volume Imaging) to improve the maximum resolution of the data, as well as to minimize background noise. Deconvolved images were saved and analyzed through Imaris image analysis software (version 5.7.2, Bitplane). Confocal images in this study are displayed as maximum projection of the three-dimensional image stacks.
Expression and Production of EcCSP
The amino acid sequence of CSP (Indian isolate, GenBankTM accession number AAN87606) was used to generate a codon-optimized synthetic gene for expression in E. coli (GeneArt, Regensburg, Germany). The construct, corresponding to amino acids Leu19 to Ser411 of the full-length CSP, was subcloned into the E. coli pET-24a+ expression vector downstream of the T7 promoter using the NdeI and XhoI restriction sites (EMD Chemicals Inc., Gibbstown, NJ). The resulting transcribed gene incorporates the additional amino acid sequence LEHHHHHH. Recombinant EcCSP was expressed using E. coli BL21(DE3) cells. Fermentation of BL21(DE3)-EcCSP was performed in a 5-liter bioreactor using defined medium at 37 °C, as described previously (26). When the absorbance at 550 nm reached 40–45, the temperature was reduced to 25 °C and induced by adding isopropyl 1-thio-β-galactopyranoside to a final concentration of 1 mm for 3 h. Cell culture was harvested by centrifugation and stored at −80 °C.
The frozen cell pellet was disrupted using either mechanical lysis or chemical lysis. For mechanical lysis, the cell pellet was resuspended in 10 volumes of lysis buffer (20 mm Tris, pH 8.0, 100 mm NaCl, 1 m urea, 5 mm DTT) and passed through a microfluidizer (M110Y, Microfluidics Corp., Newton, MA) three times at 19,000 pounds/square inch. The lysate was centrifuged for 30 min at 10,000 × g to pellet and remove the inclusion bodies and cellular debris. EcCSP was then captured from the soluble fraction using a nickel-Sepharose Fast Flow (GE Healthcare) column under reducing and denaturing conditions using a buffer containing 6 m guanidine-HCl and 5 mm DTT.
For chemical lysis, the cell pellet was resuspended in 10 volumes of lysis buffer (20 mm citrate, 1% SB3-12 (Sigma), 0.1% ABS-14 (Sigma), 75 mm NaCl, pH 7.7) and mixed for 2 h at room temperature. Following the addition of lysis buffer to the cell pellet, 25 units of benzonase (Novagen/EMD Chemicals, Inc., Gibbstown, NJ) per ml of lysis buffer was added. The lysate was centrifuged for 30 min at 10,000 × g to pellet inclusion bodies and cellular debris. Inclusion bodies were washed with water and then solubilized in solubilization buffer (11 mm Tris, 111 mm sodium phosphate, 6 m guanidine-HCl, pH 8.0) overnight at room temperature. Solubilized EcCSP was captured under reducing and denaturing conditions using a nickel-Sepharose 6 Fast Flow (GE Healthcare) column.
Nickel-captured EcCSP was refolded on a Sephacryl S-300 HR column. A sample load of ∼2–3% of a column volume was loaded on a pre-equilibrated column with refold buffer 1 (20 mm sodium phosphate, 50 mm guanidine-HCl, 1 m urea, 500 mm arginine, 150 mm NaCl, 1 mm EDTA, 1 mm DTT, pH 7.2) and eluted from the column using refold buffer 2 (20 mm sodium phosphate, 1 m urea, 500 mm arginine, 150 mm NaCl, 1 mm EDTA, pH 7.2). EcCSP was subsequently dialyzed and purified on a Q-Sepharose HP (GE Healthcare) column and polished using a size exclusion Superdex 75 (GE Healthcare) column.
Expression and Production of PpCSP
As with the E. coli expression of CSP, the amino acid sequence of CSP (GenBankTM accession number AAN87606) was used to produce a Pichia codon optimized synthetic gene for expression in the methylotrophic yeast P. pastoris (Invitrogen). A shortened CSP construct corresponding to amino acids Gly86 to Ser410 was cloned into the XhoI and XbaI sites of the Pichia expression vector pPICZαA as per the manufacturer's instructions. The resulting transcribed gene lacked a His6 tag. Prior to linearization with SacI and transformation into P. pastoris, the gene sequence of CSP was verified. Recombinant protein was produced in 5-liter bioreactors as described previously (22, 27). A scalable purification process will be detailed elsewhere. However, in brief, secreted PpCSP was subjected to depth filtration (Sartorius, Goettingen, Germany), followed by capture on a CM Hyper Z column (Pall, East Hills, NY), purification by Q-Sepharose HP column (GE Healthcare), and polished with a size exclusion Superdex 75 column (GE Healthcare). The final bulk antigen was diluted to 1.0 mg/ml in saline, pH 7.4, sterile-filtered, and stored at −80 °C.
BIAcore Chip Preparation and Interaction Studies
Surface plasmon resonance measurements were performed using a BIAcore 3000 biosensor, operating with the BIAcore Control software (BIAcore 3000, BIAcore AB, Sweden). All experiments were performed at 25 °C. Three kinetic binding assays were employed to ascertain the binding properties of the recombinant CS proteins. Three mAbs, 1G12, 4B3, and 4C2, were immobilized to the CM5 sensor chip using an amine coupling kit according to the manufacturer's instructions (GE Healthcare). The CM5 chip surface was activated with an equal molar mix of N-hydroxysuccinimide/N-ethyl-N-(dimethylaminopropyl)carbodiimide, followed by immobilization of mAbs 1G12 in 10 mm HEPES, pH 6.8, 4B3 in 10 mm acetate, pH 6.5, or 4C2 in 10 mm acetate, pH 6.0. Unreacted sites were blocked with ethanolamine (GE Healthcare). Each of the mAbs was immobilized in either flow cell 2 or 4 at 600 response units, whereas flow cells 1 and 3 were activated and then de-activated to serve as reference surfaces. For the interaction studies, recombinant CS proteins were serially diluted in Hanks' balanced solution buffer (GE Healthcare) at concentrations from 10 nm to 1 μm. Samples were injected at a flow rate of 30 μl/min for 2 min. The sensor chip was regenerated using two injections at 30 μl/min of 10 mm glycine, pH 3.0, for 30 and 10 s with a 2-min stabilization period. Data were analyzed using BIAevaluation (GE Healthcare) and fit a 1:1 model.
For the indirect kinetic analysis, mAb 4B3 was immobilized on a CM5 chip as stated previously. CS protein was diluted in Hanks' balanced solution buffer to a concentration of 100 nm. CS protein was injected as stated above. 4C2 and 1G12 were diluted in Hanks' balanced solution buffer at two concentrations, 50 and 500 nm, and injected similarly to the CS protein. The sensor chip was regenerated using two injections at 30 μl/min of 10 mm glycine, pH 3.0, for 30 s and 10 s with a 2-min stabilization period. As a negative control, 4C2 was diluted to 50 nm, 10 times the KD, and injected as stated above.
Circular Dichroism
To examine secondary structure, samples in 1× PBS were diluted 1:10 in deionized (MilliQ) water. CD spectra were recorded over the wavelength range 185–260 nm in a 1-mm path length quartz cuvette using a step size of 0.2 nm, a slit bandwidth of 1.0 nm, and a signal averaging time of 1.0 s. Analysis of temperature on secondary structure was performed in 5 °C temperature increments from 5 to 80 °C. Secondary structure content was calculated using the DICHROWEB web server (28, 29).
SEC-MALS-QELS-HPLC
To assess the identity, purity, and solution aggregation state of purified EcCSP and PpCSP, analytical size exclusion chromatography with in-line multiangle light scattering (MALS) and quasi-elastic light scatter detection (QELS) was performed. Chromatography was done on an Alliance HPLC system (Waters, Milford MA) connected to a multiangle DAWN EOS light scattering detector and a quasi-electric light scattering detector (Wyatt Technology, Santa Barbara, CA). Samples were prepared and analyzed as described by Tsai et al. (30).
Analytical Ultracentrifugation Characterization of EcCSP and PpCSP
Boundary sedimentation velocity measurements were made in Optima XLA analytical ultracentrifuge (Beckman-Coulter Instruments). Sedimentation velocity analysis was performed at 20 °C at a rotor speed of 58,000 rpm. The centrifuge cell was filled with 400 μl of protein solution at a concentration of 1.0 mg/ml PpCSP or EcCSP.
Absorbance scans were obtained at 235 nm. Sedimentation coefficient distribution analysis to deconvolute the boundary velocity data into sedimenting species was performed as described previously (31), using the public domain software Sedfit developed by Peter Schuck. The result of this computational analysis is a presentation of the distribution of sedimenting species in the form of a c(s) versus s plot. In this computational treatment, the sedimentation boundary velocity data were subjected to maximum entropy regularization statistical analysis for the most parsimonious distribution of sedimenting species (31) that best fits the data. A weight average shape factor (f/f0) is extracted from the boundary spreading, and this allows for the conversion of the c(s) versus s distribution to a c(M) versus M graphical presentation, thereby providing the molar mass of each sedimenting peak. The software program Sednterp developed by Hayes, Laue, and Philo was also used to determine the partial specific volume of the PpCSP and the viscosity (η) and density (ρ) for the PBS solution used in the sedimentation analyses and for the hydrodynamic analysis to be reported below.
Atomic Force Microscopy (AFM)
Samples for AFM were prepared and analyzed basically as described by Tsai et al. (30) with modifications as noted. Biological AFM imaging of the protein products was carried out under a range of conditions, both in fluid and air, using gentle tapping-mode AFM, mostly with a PicoForce Multimode AFM (Veeco, CA) consisting of a Nanoscope® V controller, a type E scanner head, and a sharpened TESP-SS (Veeco, CA) or similar AFM cantilever (30, 32). For rCSP visualization, suitable protein attachment was readily achieved by 1 min of incubation of 7 μl of ∼1 μg/ml solution of rCSP in PBS, pH 7.4, buffer on freshly peeled mica substrates, followed by rinsing with ∼1 ml of deionized water and complete drying under an inert gas flow. The sample was then sealed into the instrument compartment dehumidified by Drierite® particles (30). AFM images were evaluated within the Nanoscope software (version 7.2, Veeco, CA), and exported to Image J (version 1.41o, National Institutes of Health, Bethesda) and Mathcad (version 14, Mathsoft, MA) for further analyses and display.
Modeling
Tertiary structure modeling of the truncated N-terminal domain was not attempted. Secondary structure was predicted using PSIPRED (33) and JUFO (34, 35).
The repeat region was modeled by building up experimentally determined structures of the repeating unit (NPNA). The crystal structure of Ac-ANPNA-NH2 (36) was aligned to the average NMR structure of (NPNA)3 at each of the NPNA repeats (37) to verify the agreement between them (0.47, 0.46, and 0.39 Å Cα root mean square deviation). The NMR structure of (NPNA)3 was extended by aligning residues 1–8 of a second (NPNA)3 to residues 5–12 of the first. Repeating this procedure (NPNA)43 was built up, corresponding to residues 103–274 of the native CSP sequence. Mutations were introduced into the N terminus of the repeat region to correctly model the DPNA and NPNV repeats found there. Side chains rotamers were optimized using SCWRL3 (38).
The TSR domain was modeled using the automatic threading and homology modeling service LOMETS (39). High confidence models were selected and evaluated for the presence of the characteristic disulfide formation of the TSR. Alignments by SAM-T02 (40), FUGUE (41), and PPA-II (39) to TSR template 1lsl (42) generated acceptable models using MODELLER (43).
Secondary structure composition for the repeat region and the TSR domain was measured by DSSP (44), and structure analysis and visualization were accomplished using Chimera (45) and PyMOL (46).
RESULTS
Generation and Characterization of CSP-specific mAbs
To evaluate the folding of recombinant CSP expressed in E. coli (EcCSP) and P. pastoris (PpCSP) (Fig. 1), a panel of 18 mAbs was first screened by Western blot analysis against sporozoite lysates to identify reduction-sensitive mAbs. Representative Western blots for three of the mAbs are shown in Fig. 2A. Both 1G2 and 1B3 displayed the characteristic CSP doublet banding pattern at ∼60 kDa (47, 48) on both nonreduced and reduced plus alkylated sporozoite lysates, as represented by 1G2 (Fig. 2A). These mAbs also recognize the NANP repeats (data not shown). In contrast, three other mAbs, 1G12, 4B3, and 4C2, maintained reactivity with the nonreduced sporozoite lysate but displayed a markedly reduced interaction with the reduced and alkylated sporozoite lysate, depicted by 1G12 and 4C2 (Fig. 2A). To further characterize the mAbs for biological significance, the panel of mAbs was examined for reactivity to live sporozoites by confocal microscopy. All three mAbs reacted with viable sporozoites, demonstrating a characteristic surface staining. Shown in Fig. 2B are maximum projection images from confocal microscopy using mAbs 1G12, 4C2, and 1G2. Because the reduction-sensitive mAbs recognized CSP on the live parasites, we examined their ability to inhibit invasion of liver cells by live P. falciparum sporozoites (strain NF54), where the invasion rate ranges between 0.3 and 6%. 1G12, 4B3, and 4C2 exhibited inhibitory activity of sporozoite invasion of HepG2 cells (Table 1).
FIGURE 1.

Schematic of the E. coli and P. pastoris CSP constructs. The diagram represents the full-length CSP gene (top) and the shortened CSP amino acid sequences Leu19–Ser411 and Gly86–Ser410 corresponding to the EcCSP (middle) and PpCSP (bottom) constructs, respectively. The signal sequence, region 1, repeat region, TSR domain, and glycosylphosphatidylinositol (GPI) signal are shown. The start site for the ScCSP degradative product used to immunize mice, Ser301, as indicated under “Experimental Procedures,” is indicated by an asterisk on the diagram of the full-length CSP gene.
FIGURE 2.

Characterization of CSP-specific mAbs. A, representative immunoblot of a sporozoite lysate reacted with three mAbs, 1G12, 4C2, and 1G2, under nonreducing (NR) and reducing + alkylated (R/A) conditions. B, confocal microscopy analysis of live sporozoites. Sporozoites were stained with the indicated monoclonal antibody at 4 °C and detected using species-specific secondary antibodies coupled with Alexa 488.
TABLE 1.
ISI assay using P. falciparum (strain NF54) sporozoites and HepG2 liver cells
HepG2 liver cells were invaded by P. falciparum sporozoites in the presence of anti-CSP mAbs at the indicated concentrations. Quantification of percent inhibition was performed as described under “Experimental Procedures.”
| Antibody | Isotype | Region recognized | Concentration | Percent inhibition ± S.D. |
|---|---|---|---|---|
| μg/ml | ||||
| 1G2 | IgG1 | Repeat | 190.0 | 72.6 ± 16.2 |
| 1G12 | IgG1 | TSR | 196.0 | 54.7 ± 29.6 |
| 4B3 | IgG1 | TSR | 155.0 | 62.9 ± 24.8 |
| 4C2 | IgG1 | TSR | 178.5 | 32.4 ± 20.2 |
Expression, Purification, and Biological Characterization of EcCSP and PpCSP
Two different synthetic CSP genes were used to express CSP in E. coli and P. pastoris (Fig. 1). Following expression and purification as described under “Experimental Procedures,” two forms of refolded and purified EcCSP were generated and identified based on the lysis method, EcCSP-ML (mechanical microfluidization lysis) and EcCSP-CL (chemical detergent lysis). The integrity and purity of EcCSP-ML and EcCSP-CL, as well as the PpCSP, are shown by Coomassie Blue-stained SDS-polyacrylamide gel (Fig. 3A) and immunoblot (Fig. 3B). A reduction-sensitive high molecular mass band migrating at 120 kDa is only observed in EcCSP-CL (Fig. 3A) likely because of the presence of an N-terminal free cysteine (see below). As shown in Fig. 3B, EcCSP-ML/CL and PpCSP react with the mAb, 1G12, in a reduction-sensitive manner by Western blot. Similar reactivity by Western blot using mAbs 4C2 and 4B3 was observed with all three recombinant CS proteins, EcCSP-ML/CL and PpCSP (data not shown). mAbs 1G12, 4C2, and 4B3 were also shown to react by Western blot with a protein product corresponding to the TSR domain in a reduction-sensitive manner (data not shown). These three reduction-sensitive mAbs were isotyped and subclassed and determined to be IgG1.
FIGURE 3.
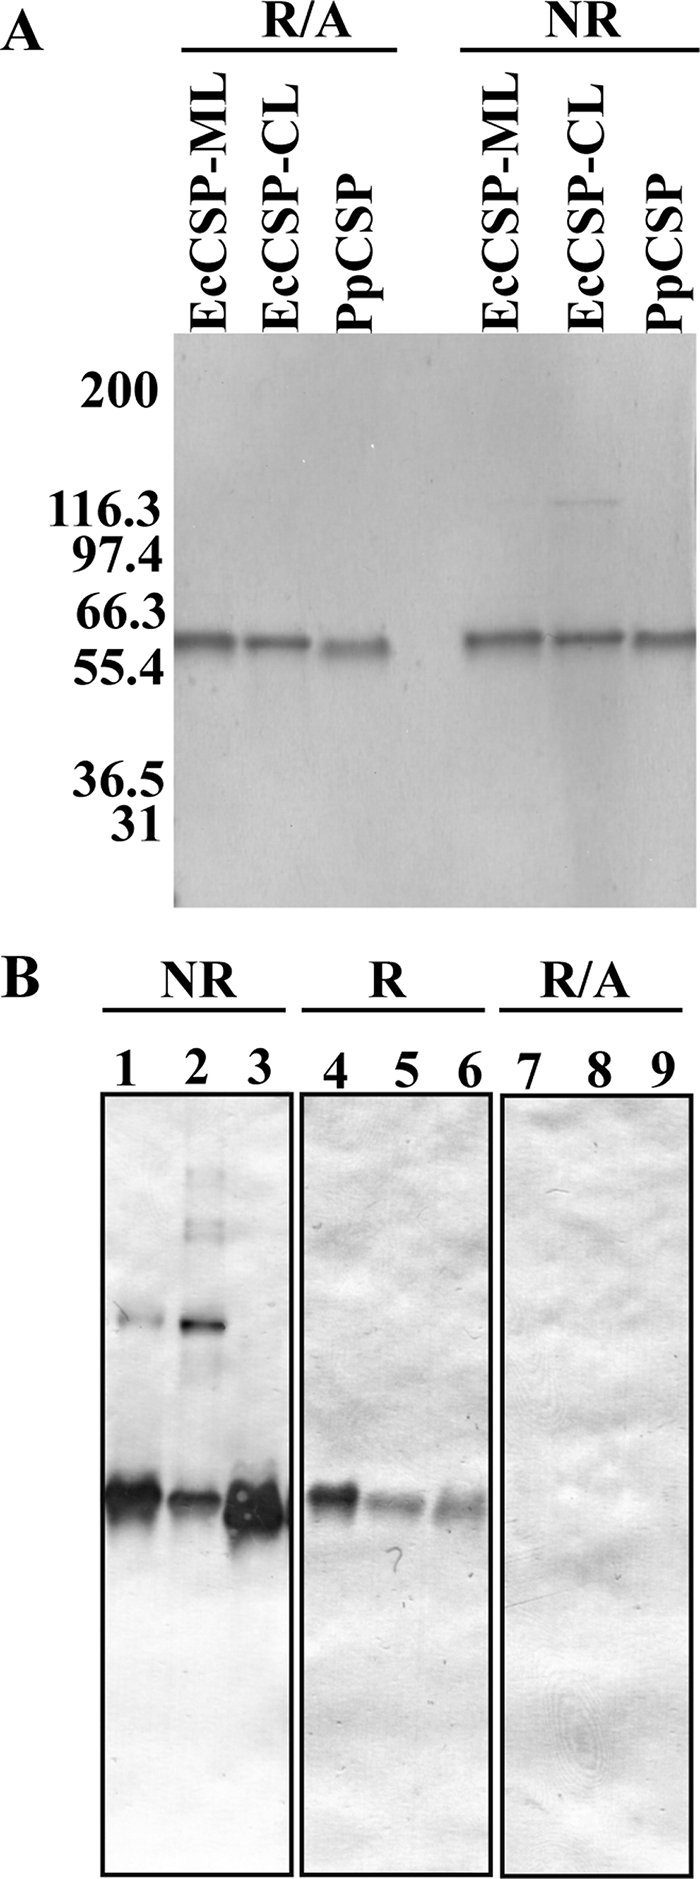
Biophysical and biochemical characterization of EcCSP and PpCSP by SDS-PAGE and immunoblot. A, Coomassie Blue-stained SDS-PAGE of 1 μg of purified recombinant EcCSP and PpCSP under nonreduced (NR) and reducing + alkylated (R/A) conditions. B, representative immunoblot of 0.5 μg of purified recombinant EcCSP-ML (lanes 1, 4, and 7), EcCSP-CL (lanes 2, 5, and 8), and PpCSP (lanes 3, 6, and 9) under nonreducing (lanes 1–3), reducing (lanes 4–6), and reducing + alkylated (lanes 7–9) conditions, and shown are results obtained using mAb 1G12.
The interaction of EcCSP-ML and PpCSP with the three reduction-sensitive mAbs, 1G12, 4B3, and 4C2, was further characterized by surface plasmon resonance. To examine the affinity or KD value of the three mAbs, 1G12, 4B3, and 4C2, to EcCSP-ML and PpCSP, each of the mAbs was amine-coupled to the surface of a CM5 chip (see supplemental Fig. 1A for example 4C2). The KD value of the mAbs toward the two recombinant CS proteins was comparable. The affinity of the reduction-sensitive mAbs 4B3, 4C2, and 1G12 for EcCSP-ML was 8, 40, and 100 nm, respectively. Similarly for PpCSP, the affinity of the three mAbs 4B3, 4C2, and 1G12 was 4, 40, and 60 nm. Analysis by surface plasmon resonance demonstrated the mAb combinations 4B3/4C2 and 4B3/1G12 shared an overlapping epitope (see supplemental Fig. 1B).
Additional biological and biophysical characterization of the three recombinant CS proteins using electrospray ionization-mass spectrometry (ESI-MS), N-terminal sequencing, and endotoxin concentration was performed to ascertain the identity and purity of the purified proteins. Using reversed phase-HPLC, the primary elution peak from each of the samples was analyzed by ESI-MS (Table 2). The observed mass for the nonreduced form of PpCSP was 33,078.9 Da (Table 2), which is within 1 Da of the nonreduced theoretical mass 33,079.9 Da, indicating the biochemical integrity of the protein is good. Results obtained with EcCSP-CL showed that the observed mass is similar to the theoretical mass (Table 2). Identity of both proteins was confirmed by N-terminal sequence analysis, which yielded the expected N-terminal sequence for EcCSP-CL and PpCSP (Table 2). Contrary to EcCSP-CL and PpCSP, the major observed mass for EcCSP-ML did not correspond to the expected theoretical mass for the designed product. Further examination based on mass spectrometry and N-terminal sequencing analyses identified a mixture of several different CSP species with N-terminal truncations (Table 2). Analysis for endotoxin concentration of our purified proteins showed endotoxin levels ranged between 5 and 68 endotoxin units/mg (Table 2).
TABLE 2.
Biochemical and biophysical characterization of EcCSP-ML, EcCSP-CL, and PpCSP
| EcCSP-ML | EcCSP-CL | PpCSP | |
|---|---|---|---|
| N-terminal sequencea | Mixture | MLFQEYQX | GREGKDED |
| MLFQ | |||
| 26YGS | |||
| 65LKK | |||
| Theoretical MS | 42,126.5 Da | 42,125.5 Da | 33,079.9 Da |
| Observed ESI-MS | Mass ranging from 36,403 to 41,158 Da | 42,154.0 Da | 33,078.9 Da |
| SEC-HPLC monomer peak retention time | 16.83 min | 16.08 min | 16.60 min |
| SEC-MALS-HPLC (weight average molar mass) | 40,900 Da | 52,000 Da | 30,700 Da |
| Sedimentation velocity (weight average molar mass) | 39,139 Da | 42,409.5 Da | 30,980 Da |
| Endotoxin | 5.3 EUb/mg | 67.7 EU/mg | 5.0 EU/mg |
a The N-terminal sequence for EcCSP-CL and PpCSP matches the expected sequence, corresponding to amino acids Leu19 and Gly86, respectively. EcCSP-ML contains a mixture of N-terminal sequences. The indicated amino acid start sites correspond to the amino acid positions within the Indian isolate (amino acid GenBankTM accession number XP_001351122.1).
b EU indicates endotoxin units.
Biophysical and Biochemical Characterization of EcCSP and PpCSP, CD Spectroscopy, and Thermal Stability
CD spectra of purified PpCSP and EcCSP were generated to examine their secondary structures. Analysis of the far-UV spectra for secondary structure outputs for PpCSP using the Dichroweb server (28, 29) indicated PpCSP was composed of 10 ± 4% α-helix, 23 ± 7% β-sheet, 17 ± 5% β-turn, and 49 ± 13% random structure. Similar spectral results were obtained for both of the EcCSPs. All three recombinant proteins were evaluated for changes in secondary structure because of heating by a step procedure that generated a temperature ramp in 5 °C increments, beginning at 5 °C and ending at 80 °C. As shown in Fig. 4, a change in the secondary structure of PpCSP was observed with increased temperature as indicated by increased intensity in negative ellipticity between 215 and 235 nm and a decrease from 190 to 215 nm (Fig. 4). The reversibility of the temperature-induced secondary structure transitions was shown by the cooling back to either 5 or 20 °C from 80 °C, where secondary structure was reformed, as indicated by a shift in the ellipticity spectra of the heated samples back toward the original 5 °C spectra. Similar results were also obtained for EcCSP-ML and EcCSP-CL (data not shown). The spectra for PpCSP in the near-UV, 250–320 nm, showed very little signal, which is indicative of a low amount of tertiary structure (data not shown). These results were consistent with results obtained from EcCSP-ML and EcCPS-CL (data not shown).
FIGURE 4.

CD analysis of PpCSP in aqueous solution. The ellipticity (degrees cm2/dmol) was plotted as a function of wavelength (nm). Raw data measured in millidegrees was converted into ellipticity (degrees cm2/dmol). Spectra were obtained at 5, 20, and 80 °C and at 5 and 20 °C following heating at 80 °C. Inset, ellipticity (degrees cm2/dmol) was plotted as a function of wavelength (nm) during heating. Spectra were obtained in 5 °C increments beginning at 5 °C; however, data are presented in 10 °C increments beginning at 5 °C.
Biophysical and Biochemical Characterization of EcCSP and PpCSP, SEC-MALS-QELS-HPLC
Each of the three recombinant CS proteins was examined by analytical SEC-MALS-QELS-HPLC to determine solution state, molar mass, and hydrodynamic radius. Analysis of PpCSP by SEC-HPLC indicated 93.6% of the protein was monomeric in solution with 6.4% product-related impurities. Examination of the EcCSPs by SEC-HPLC indicated EcCSP-ML was composed of two populations, a monomer population at 79.6% and a dimer population at 20.4%, whereas EcCSP-CL was composed of two additional species, yielding a composition of 24% aggregates, 33% dimer, 17% monomer, and 26% product-related degradants. Examination of the monomer peaks from SEC-HPLC reveals PpCSP, EcCSP-ML, and EcCSP-CL have similar retention times (Table 2), similar to the retention time of immunoglobulin G (158 kDa) at ∼17 min (data not shown). Further analysis of the three CS proteins by in-line MALS indicated the weight average molar mass of the monomeric peaks corresponded to the theoretical mass of each protein (Table 2 and Fig. 5A). To further characterize the recombinant CS proteins, the hydrodynamic radii (Rh) of the monomeric recombinant CS proteins were examined by QELS. The Rh of PpCSP was 4.2 nm (Fig. 5B), indicating the monomeric form of PpCSP is highly extended compared with a typical globular protein like bovine serum albumin (66.4 kDa) for which Rh ≈3.4 (30). Similarly, the Rh of EcCSP-ML was 4.7 nm. For EcCSP-CL, there was insufficient signal for the monomer to obtain a valid Rh value.
FIGURE 5.

Biochemical characterization of PpCSP by SEC-MALS-QELS HPLC and analytical ultracentrifugation. A, analysis of PpCSP by SEC-MALS-HPLC provided the molar mass distribution of the main peak (molar mass line indicated by arrow) compared with the absorbance at 280 nm. B, QELS goodness of fit of the autocorrelation function plot at the apex of the peak. C, sedimentation coefficient distributions and molar mass obtained from the boundary sedimentation velocity data (data not shown) of the PpCSP sample by the computational analysis described under “Experimental Procedures.” The molar mass distribution c(M) versus M shown in the inset is calculated from the c(s) versus s distribution using the fitted weight average f/f0. The differential c(s) scale is in units of absorbance per Svedberg unit, and differential c(M) scale is in units of absorbance per molar mass multiplied by 100,000.
Biophysical and Biochemical Characterization of EcCSP and PpCSP, Boundary Sedimentation Velocity Characterization of PpCSP
To better characterize the recombinant CS proteins, an orthogonal approach was used to determine the mass and hydrodynamic radius. Boundary sedimentation velocity was used to obtain the sedimentation coefficient distribution of the PpCSP sample. The absorbance scans of the sedimenting boundaries versus time (data not shown) were analyzed by the computational program Sedfit to give the sedimentation distribution of protein components shown in Fig. 5C. The weight average frictional ratio (f/f0) of 2.10 was extracted in the fitting process to account for boundary diffusion. Integration of the entire c(s) peak gives a weight average uncorrected s value of 1.90 S. Correcting for the effects of the density and viscosity of PBS, we obtained an s20,w value of 1.96 S. The weight average sedimentation coefficient coupled with the weight average f/f0 provides for the conversion of the c(s) distribution into a c(M) versus M distribution as shown in the inset of Fig. 5C. The weight average molar mass of the major peak is 30,980 (Table 2). This is in excellent agreement with the sequence molar mass of 33,076. Using the latter and the s20,w value of 1.96 S, we obtain the following hydrodynamic results: a calculated f/f0 of 2.19 and a Stokes radius of 4.58 nm. Based on the large f/f0 for CSP, it is reasonable to model the shape of this protein as a cylinder. Using this hydrodynamic model with an estimated hydration of 0.3g of water per g of protein, the CSP cylinder or rod would have length and diameter dimensions of 20.9 and 1.52 nm, respectively.
A sedimentation analysis of EcCSP-ML was also performed under identical conditions used for PpCSP (results not shown). It is of interest to compare the sedimentation and hydrodynamic properties of EcCSP-ML with PpCSP. For the former we obtained an uncorrected s value of 2.16 S, which corrects to an s20,w value of 2.26 S. The increase in s would be anticipated given the molar mass of 41,743 for EcCSP. The weight average f/f0 from the c(s) versus s analysis was 2.16. The weight average molar mass from the c(M) versus M analysis was 39,139 in good agreement with the sequence molar mass (Table 2). An f/f0 of 2.26 was obtained from the sequence molar mass and s20,w value. The Stokes radius for EcCSP is 5.09 nm. Again modeling this CSP construct as a cylinder or rod, we obtain length and diameter dimensions of 34 and 1.6 nm, respectively. It is evident that the sedimentation and hydrodynamic behavior of PpCSP and EcCSP-ML are quite comparable. A similar analysis was performed with EcCSP-CL in which comparable results were obtained with EcCSP-ML and PpCSP. The weight average molar mass determined from the sedimentation analysis of EcCSP-CL is presented in Table 2. The AFM results that will be presented below support the rod/ribbon shape modeling for CSP.
Biophysical and Biochemical Characterization of EcCSP and PpCSP, AFM
AFM images directly reveal that PpCSP protein is an extended linear and flexible molecule with a variable twisted ribbon-like appearance (Fig. 6A). In agreement with the solution studies, AFM images suggest about 92% PpCSP protein mass is in a monomeric state with the measured protein volume around the value of 33 nm3 (Fig. 6B). The balance of the protein mass suggests a small amount of dimers and very sporadic occurrence of small oligomers. The protein particles are varied in shape, but all are consistent with the extended twisted ribbon forms, when quantified by the histogram of the circularity, defined as 4π·area/(perimeter)2 (Fig. 6C). Assuming a straight ribbon shape for a fully extended molecule, these measured circularity values suggest the typical length to width ratio to be between two and six. Restricting to the more typical PpCSP monomers, having a measured protein volume between about 25 to 41 nm3, the histogram of the molecular area is tightly distributed and falls within the range of ∼120 to 220 nm2 (Fig. 6D). Taken together, the AFM images suggest an “average” ribbon shape of the dimensions around 25 × 7 × 0.2 nm for PpCSP monomers as appeared on mica surfaces. AFM imaging for EcCSP also reveals twisted ribbon-like appearance with rod-like dimensions, but with more complex monomer-dimer oligomerization hierarchies (data not shown). Therefore, our high resolution AFM images fully support the interpretations of the structures deduced from the solution measurements.
FIGURE 6.

AFM characterization of PpCSP deposited from PBS, pH 7.4, on Mica. A, panel of representative images, in three-dimensional plots (70 nm square viewed from the scan direction vertically, colored scale bar for height up to 0.4 nm bottom left, and 30 nm bars in the x-y representing scale), showing PpCSP protein monomer shapes as seen in AFM topographies of uniformly dispersed PpCSP particles on a mica surface. B, mass distribution histogram from ∼2600 computed particles reveals that about 92% PpCSP is seen in a monomeric state (under the blue curve centered at the monomer volume of 33 nm3). C, histogram of the circularity, defined as 4π·area/(perimeter)2, of these particles suggests flexible rod-like molecules, showing twisted ribbon-like morphologies with a typical length to width ratio between 2 and 6. D, histogram of the molecular area for 711 PpCSP monomers, having a more typical measured protein volume between 0.75 and 1.25 of the monomer value in (B) reveals a distribution range of ∼120 to 200 nm2.
Modeling of CSP
Molecular modeling as detailed under “Experimental Procedures” was successful for the repeat region and for part of the TSR domain. The overall secondary structure composition for the combination of the repeat region, the TSR domain, and the truncated N-terminal domain corresponding to the EcCSP construct was about 5% α-helix, 27% β-sheet, 28% β-turn, and 36% random structure, in good agreement with the circular dichroism measurements. Stretches of about 45 residues before and after the repeat region were predicted to have little secondary structure. The TSR domain itself contains characteristic disulfide bonds between Cys334 and Cys369 and between Cys338 and Cys374 and forms an extended structure about 4.9 nm in length and 1.3 nm in width. It may be followed by a membrane-associated helix from about Val377 to the C terminus (Fig. 7A). The repeat region forms a stem-like superhelix about 18 nm in length and 1.5 nm in width composed of regular β-turns with a pitch of about 28 residues or 7 repeat units (NPNA). Substitution of DPNA in the first turn of the superhelix adds a −5 formal charge to the otherwise electrically neutral structure and imparts a significant negative electrostatic potential to the N terminus of the repeat region (Fig. 7, B–D).
FIGURE 7.

Molecular models. A, TSR domain of CSP (Tyr319 to Ser375) was modeled by homology. Protein Data Bank entry 1lsl is shown in gray, and the model for the CSP TSR domain in green. The important disulfide bonding pattern is retained in the model (arrows). Red indicates portions of the TSR region with poorly predicted structure. B, NMR (green) and crystal (pink) structures for the NPNA repeat agree to less than 0.5 Å root mean square deviation. C, NMR structure was extended by sequential superposition of the NPNA repeats. This view is down the long axis. D, repeat region forms a long stem-like superhelix composed of regular β-turns. The electrostatic potential mapped to the solvent-accessible surface of the repeat region indicates an area of significant negative charge in the first turn of the superhelix. E, scaled graphic depiction of CSP extending from the lipid membrane relative to PfAMA1. The graphical image of PfAMA1 was generated from a composite of the structural data for PfAMAI and PvAMAI (Protein Data Bank codes 2Q8A and 2J4W, respectively). The TSR domain is represented in blue, repeat region in red, and the N terminus in purple. The N-terminal depiction has been added solely to symbolize the N-terminal space. The shape of the N terminus is a graphical illustration and is not based on structural data.
DISCUSSION
Recently, multiple vaccine trials examining the effectiveness of RTS,S, a CSP vaccine, have reported efficacy rates against infection ranging from 30 to 66% and against clinical malaria in children 1–4 years at 30% (49–51). However, the RTS,S construct lacks the N-terminal region of CSP, which has been shown to be a critical functional domain (16–19). Our objective was to generate and subsequently characterize recombinant CSP incorporating the N terminus, repeat region, and C terminus, with the intention of gaining a better understanding of the structure of CSP. Here we describe the bench scale production and the extensive biological, biochemical, and biophysical characterization of CSP derived from two expression systems, E. coli and P. pastoris. The recombinant products from each expression system were similar in all of the biochemical and biophysical characteristics reported here providing strong support to the conclusion that CSP is a highly extended, rod-like protein on the surface of sporozoites.
To biologically characterize the rCSP and to demonstrate that both EcCSP and PpCSP have structural compatibility to native CSP, we generated a panel of mAbs to purified ScCSP. The S. cerevisiae expression system was not selected for production of recombinant CSP because of low levels of expression (data not shown). To facilitate production of mAbs specific to the TSR domain of CSP, mice were boosted with a purified degraded product corresponding to the TSR domain as determined by N-terminal sequencing (data not shown). The subsequent CSP-specific mAbs were screened by Western blot against sporozoite lysates, confocal microscopy of live sporozoites, and a sporozoite invasion inhibition assay to determine their biological activity as well as to determine their applicability for examination of recombinant CSP conformation. The results obtained by Western blot of the sporozoite lysate demonstrated mAbs 1G12, 4B3, and 4C2 were reduction-sensitive, indicating they recognize a conformation-dependent epitope (Fig. 2A), whereas confocal microscopy results showed the characteristic surface reactivity to live sporozoites for the whole mAb panel (Fig. 2B). Finally, mAbs 1G2, 1G12, 4B3, and 4C2 were examined for their ability to inhibit sporozoite invasion of liver cells (Table 1). All three conformation-dependent mAbs, 1G12, 4B3, and 4C2, were able to demonstrate inhibition of liver cell invasion. These data are consistent with results published by Roggero et al. (52) demonstrating antibodies generated to a 102-mer peptide corresponding to the C-terminal region of CSP are able to inhibit sporozoite invasion of hepatoma cells.
To assess folding of the TSR domain in the purified recombinant proteins, Western blot analysis of EcCSP-ML, -CL, and PpCSP was performed using 1G12, 4B3, and 4C2 (Fig. 3). Reactivity was diminished following treatment with DTT and further reduced following subsequent treatment with iodoacetamide, which prevented reformation of the disulfide bonds in the TSR domain (Fig. 3). Given that 1G12, 4B3, and 4C2 reacted similarly with native CSP (Fig. 2A), the results indicate EcCSP and PpCSP share a common conformational epitope in the TSR domain with native CSP. Further examination of the interaction between the recombinant proteins and mAbs 1G12, 4B3, and 4C2 via BIAcore indicated only slight affinity differences between EcCSP-ML and PpCSP with the respective mAbs, indicating both EcCSP-ML and PpCSP likely share a common structural epitope. Interaction between EcCSP-CL and the conformationally sensitive mAbs was not examined using BIAcore because of the propensity of EcCSP-CL to form aggregates in solution.
Biochemical characterization of purified EcCSP-ML showed that neither the N-terminal sequence nor the mass spectrum directly corresponded to the expected results. The N-terminal sequence contained a mixture of sequences (Table 2), which is consistent with the disparity observed between the theoretical ESI-MS and the observed ESI-MS. Given that EcCSP-ML was captured from the soluble fraction following mechanical disruption of the E. coli cellular membrane, it is feasible that CSP was exposed to active E. coli proteases, which consequently led to a mixed N-terminal population of EcCSP. Subsequent modification of the lytic process from mechanical to detergent lysis leads to the production of purified EcCSP-CL for which the N-terminal sequence and ESI-MS results were comparable with the expected results. The instability of the designed N terminus of EcCSP-ML may be due to the presence of the PEXEL domain that accounts for an additional proteolytic site (53–55). This is further supported by the absence of any detectable native CSP dimers that would be expected if a free thiol was present as detected by Western blot (Fig. 2). Similar to EcCSP-CL, N-terminal and ESI-MS results for PpCSP corresponded to the designed product. Evaluation of each of the three recombinant proteins for impurities indicated the endotoxin levels were within acceptable levels for human studies (Table 2).
Both EcCSP and PpCSP were examined by CD to first examine secondary and tertiary structure. Analysis of the results from the far-UV examination of both proteins using the Dichroweb server indicates that both EcCSP and PpCSP contain very little α-helical structure, whereas ∼40% of the protein is composed of β-sheets and β-turns and 49% random structure. Inspection of both proteins in the near-UV indicated very little tertiary structure. This would fit, because the only structural domain based on sequence parsimony is the TSR domain, which has an elongated anti-parallel two β-sheet fold (42, 56). However, more important for vaccine development is knowledge of the thermal stability or temperature effects on the structure. Examination of both proteins via a temperature ramp indicated the recombinant proteins underwent an alteration of secondary structure upon heating. Furthermore, we sought to understand the following: should a temperature excursion from 4 °C or room temperature occur during storage or formulation if the secondary structure would reform upon cooling? The results for both EcCSP and PpCSP indicated secondary structure is regained following cooling from 80 °C back to either 4 or 20 °C. Consequently, if there is a short temperature deviation, the resulting change in temperature is unlikely to have a detrimental effect on secondary structure for either recombinant protein.
Further biophysical studies of the EcCSP and PpCSP by SEC-MALS and QELS indicated a predominant monomeric solution state for both EcCSP-ML and PpCSP, whereas EcCSP-CL aggregated in solution as mentioned previously. The weight average molar mass of 52 kDa for EcCSP-CL is 10 kDa larger than the theoretical mass of our designed product, which is likely because of an incomplete separation between the monomer and dimer peak. Furthermore, QELS data indicate EcCSP and PpCSP are extended molecules based on the observed hydrodynamic radii, which was corroborated by sedimentation velocity. Both QELS and sedimentation velocity data support the concept that CSP acquires a nonglobular highly extended structure. To further investigate and begin to resolve the structural features of CSP, we examined all three recombinant proteins by high resolution AFM that permitted visualization of individual rCSP molecules. Such studies allowed the examination of monomeric rCSP using an orthogonal technique to both SEC-QELS and sedimentation velocity in the solution state of CSP. The AFM images and the subsequent measurements via direct visualizations on a substrate indicate that CSP is an extended linear, twisted ribbon-like, and flexible molecule with measurements centered around 25 × 7 × 0.2 nm.
These data are the first direct evidence demonstrating CSP has an elongated structure and are consistent with previous studies that examined the structure of the NANP repeat region of CSP. Several studies examined conformationally constrained NANP mimetics by NMR and CD (37), cyclic ANPNAA peptides by NMR (57), and Ac-ANPNA-NH2 peptides by crystallography (36), all of which demonstrated the NPNA motif adopts a β-turn (58). Speculation by Nanzer et al. (59) suggests that by affixing multiple NPNA repeats together, a stable “stem-like” structure may be formed. Our SEC-MALS-QELS, sedimentation velocity, and AFM data support the concept that the NANP repeat region of CSP does form a stem-like structure, creating an elongated and flexible molecule. Molecular modeling also supports the stem-like nature of the repeat region (Fig. 7, A–E). In addition to the repeat region, the TSR domain is also an elongated structure. A long linker exists between the N-terminal domain and the repeat region. Another linker exists between the repeat region and the TSR domain. These elements combine to support the experimental observations of nonglobularity and multiple morphology with a three-dimensional shape of ∼21–25 × 1.5 × 1.5 nm. The difference between the AFM measurements versus the solution and computational measurements is partly due to compression by the AFM tip. Although gentle AFM can quantitatively characterize delicate biological samples (30, 32), it is logical for the CSP protein with its particular elongation, flexibility, and high content of random coiled structure to be visualized in the twisted ribbon-like forms between the substrate and the AFM tip. Overall, there is very good agreement for the relative shape in both the length and the cross-sectional area of CSP between the different analytical methods.
Sporozoite entry of mammalian cells has been well studied in vitro (60, 61) and characterized to include both traversal of cells in which no parasitophorous vacuole is formed and infection of cells accompanied by formation of a parasitophorous vacuole (62–65). However, the definitive role for the CS protein within this traversal and infection process is unclear. An abundance of evidence suggests both the N-terminal domain and C-terminal domain are involved in the invasion process of host organisms, ranging from motility to liver cell attachment via heparin sulfate proteoglycans displayed on the surface of receptors (16–19, 66, 67). How the unique structure of the CS protein as an extended, flexible rod-like structure impacts on the process of gliding, traversal, or infection is worthy of further evaluation.
Here we have generated extensively characterized rCSP expressed from two expression systems. PpCSP corresponded to our designed construct and was purified to greater than >99% purity, as determined by SEC-HPLC, without the use of an affinity tag and remained monomeric in solution following purification. These data not only present evidence of a highly purified rCSP, but they provide the first analytical evidence describing CSP as an elongated, flexible rod-like protein on the surface of sporozoites.
Supplementary Material
Acknowledgments
We are thankful to Dominique Jones for collecting the CD data; Drs. Owen Schwartz and Juraj Kabat (Biological Imaging, Research Technologies Branch, National Institutes of Health) for advice and help on confocal microscopy; Dr. Michael B. Murphy (GE Healthcare, BIAcore) for assistance with the BIAcore; Olga Muratova for providing sporozoites for Western blot analysis; Drs. Carl Hammer and Mark Garfield for mass spectrometry and protein sequencing, respectively.
This work was supported, in whole or in part, by National Institutes of Health (Intramural Research Program, including NIAID and National Institute of Biomedical Imaging and Bioengineering).

The on-line version of this article (available at http://www.jbc.org) contains supplemental Fig. 1.
D. Kaslow, unpublished data.
- CSP
- circumsporozoite protein
- TSR
- thrombospondin-like type I repeat
- mAb
- monoclonal antibody
- ISI
- inhibition of sporozoite invasion
- ECM
- Eagle's essential minimum complete media
- DTT
- dithiothreitol
- BisTris
- 2-[bis(2-hydroxyethyl)amino]-2-(hydroxymethyl)propane-1,3-diol
- PBS
- phosphate-buffered saline
- SEC-MALS-QELS-HPLC
- size exclusion chromatography-multiangle light scattering-quasi-elastic light scatter detection; high pressure liquid chromatography
- qRT
- quantitative real time
- r
- recombinant
- AFM
- atomic force microscopy
- EcCSP
- E. coli CSP
- PpCSP
- P. pastoris CSP
- ESI-MS
- electrospray ionization-mass spectrometry
- -ML
- mechanical microfluidization lysis
- -CL
- chemical detergent lysis.
REFERENCES
- 1.Clyde D. F., Most H., McCarthy V. C., Vanderberg J. P. (1973) Am. J. Med. Sci. 266, 169–177 [DOI] [PubMed] [Google Scholar]
- 2.Nussenzweig R. S., Vanderberg J., Most H., Orton C. (1967) Nature 216, 160–162 [DOI] [PubMed] [Google Scholar]
- 3.Nussenzweig R. S., Vanderberg J. P., Most H., Orton C. (1969) Nature 222, 488–489 [DOI] [PubMed] [Google Scholar]
- 4.Franke E. D., Sette A., Sacci J., Jr., Southwood S., Corradin G., Hoffman S. L. (2000) Infect. Immun. 68, 3403–3411 [DOI] [PMC free article] [PubMed] [Google Scholar]
- 5.Hollingdale M. R., Zavala F., Nussenzweig R. S., Nussenzweig V. (1982) J. Immunol. 128, 1929–1930 [PubMed] [Google Scholar]
- 6.Rodrigues E. G., Claassen J., Lee S., Wilson J. M., Nussenzweig R. S., Tsuji M. (2000) Parasite Immunol. 22, 157–160 [DOI] [PubMed] [Google Scholar]
- 7.Weiss W. R., Mellouk S., Houghten R. A., Sedegah M., Kumar S., Good M. F., Berzofsky J. A., Miller L. H., Hoffman S. L. (1990) J. Exp. Med. 171, 763–773 [DOI] [PMC free article] [PubMed] [Google Scholar]
- 8.Weiss W. R., Sedegah M., Beaudoin R. L., Miller L. H., Good M. F. (1988) Proc. Natl. Acad. Sci. U.S.A. 85, 573–576 [DOI] [PMC free article] [PubMed] [Google Scholar]
- 9.Weiss W. R., Sedegah M., Berzofsky J. A., Hoffman S. L. (1993) J. Immunol. 151, 2690–2698 [PubMed] [Google Scholar]
- 10.Kumar S., Miller L. H., Quakyi I. A., Keister D. B., Houghten R. A., Maloy W. L., Moss B., Berzofsky J. A., Good M. F. (1988) Nature 334, 258–260 [DOI] [PubMed] [Google Scholar]
- 11.Schofield L., Villaquiran J., Ferreira A., Schellekens H., Nussenzweig R., Nussenzweig V. (1987) Nature 330, 664–666 [DOI] [PubMed] [Google Scholar]
- 12.Herrington D. A., Clyde D. F., Losonsky G., Cortesia M., Murphy J. R., Davis J., Baqar S., Felix A. M., Heimer E. P., Gillessen D., et al. (1987) Nature 328, 257–259 [DOI] [PubMed] [Google Scholar]
- 13.Nardin E. H., Oliveira G. A., Calvo-Calle J. M., Castro Z. R., Nussenzweig R. S., Schmeckpeper B., Hall B. F., Diggs C., Bodison S., Edelman R. (2000) J. Infect. Dis. 182, 1486–1496 [DOI] [PubMed] [Google Scholar]
- 14.Stoute J. A., Slaoui M., Heppner D. G., Momin P., Kester K. E., Desmons P., Wellde B. T., Garçon N., Krzych U., Marchand M. (1997) N. Engl. J. Med. 336, 86–91 [DOI] [PubMed] [Google Scholar]
- 15.Bejon P., Lusingu J., Olotu A., Leach A., Lievens M., Vekemans J., Mshamu S., Lang T., Gould J., Dubois M. C., Demoitié M. A., Stallaert J. F., Vansadia P., Carter T., Njuguna P., Awuondo K. O., Malabeja A., Abdul O., Gesase S., Mturi N., Drakeley C. J., Savarese B., Villafana T., Ballou W. R., Cohen J., Riley E. M., Lemnge M. M., Marsh K., von Seidlein L. (2008) N. Engl. J. Med. 359, 2521–2532 [DOI] [PMC free article] [PubMed] [Google Scholar]
- 16.Ancsin J. B., Kisilevsky R. (2004) J. Biol. Chem. 279, 21824–21832 [DOI] [PubMed] [Google Scholar]
- 17.Bongfen S. E., Ntsama P. M., Offner S., Smith T., Felger I., Tanner M., Alonso P., Nebie I., Romero J. F., Silvie O., Torgler R., Corradin G. (2009) Vaccine 27, 328–335 [DOI] [PubMed] [Google Scholar]
- 18.Rathore D., Nagarkatti R., Jani D., Chattopadhyay R., de la Vega P., Kumar S., McCutchan T. F. (2005) J. Biol. Chem. 280, 20524–20529 [DOI] [PubMed] [Google Scholar]
- 19.Rathore D., Sacci J. B., de la Vega P., McCutchan T. F. (2002) J. Biol. Chem. 277, 7092–7098 [DOI] [PubMed] [Google Scholar]
- 20.Stowers A. W., Zhang Y., Shimp R. L., Kaslow D. C. (2001) Yeast 18, 137–150 [DOI] [PubMed] [Google Scholar]
- 21.Hollingdale M. R., Leland P., Schwartz A. L. (1983) Am. J. Trop. Med. Hyg. 32, 682–684 [DOI] [PubMed] [Google Scholar]
- 22.Narum D. L., Nguyen V., Zhang Y., Glen J., Shimp R. L., Lambert L., Ling I. T., Reiter K., Ogun S. A., Long C., Holder A. A., Herrera R. (2008) Infect. Immun. 76, 4876–4882 [DOI] [PMC free article] [PubMed] [Google Scholar]
- 23.Narum D. L., Ogun S. A., Thomas A. W., Holder A. A. (2000) Infect. Immun. 68, 2899–2906 [DOI] [PMC free article] [PubMed] [Google Scholar]
- 24.Singh S., Plassmeyer M., Gaur D., Miller L. H. (2007) Proc. Natl. Acad. Sci. U.S.A. 104, 20043–20048 [DOI] [PMC free article] [PubMed] [Google Scholar]
- 25.Ozaki L. S., Gwadz R. W., Godson G. N. (1984) J. Parasitol. 70, 831–833 [PubMed] [Google Scholar]
- 26.Singh S., Kennedy M. C., Long C. A., Saul A. J., Miller L. H., Stowers A. W. (2003) Infect. Immun. 71, 6766–6774 [DOI] [PMC free article] [PubMed] [Google Scholar]
- 27.Tsai C. W., Duggan P. F., Shimp R. L., Jr., Miller L. H., Narum D. L. (2006) J. Biotechnol. 121, 458–470 [DOI] [PubMed] [Google Scholar]
- 28.Whitmore L., Wallace B. A. (2004) Nucleic Acids Res. 32, W668–W673 [DOI] [PMC free article] [PubMed] [Google Scholar]
- 29.Whitmore L., Wallace B. A. (2008) Biopolymers 89, 392–400 [DOI] [PubMed] [Google Scholar]
- 30.Tsai C. W., Duggan P. F., Jin A. J., Macdonald N. J., Kotova S., Lebowitz J., Hurt D. E., Shimp R. L., Jr., Lambert L., Miller L. H., Long C. A., Saul A., Narum D. L. (2009) Mol. Biochem. Parasitol. 164, 45–56 [DOI] [PMC free article] [PubMed] [Google Scholar]
- 31.Schuck P. (2000) Biophys. J. 78, 1606–1619 [DOI] [PMC free article] [PubMed] [Google Scholar]
- 32.Jin A. J., Prasad K., Smith P. D., Lafer E. M., Nossal R. (2006) Biophys. J. 90, 3333–3344 [DOI] [PMC free article] [PubMed] [Google Scholar]
- 33.Bryson K., McGuffin L. J., Marsden R. L., Ward J. J., Sodhi J. S., Jones D. T. (2005) Nucleic Acids Res. 33, W36–W38 [DOI] [PMC free article] [PubMed] [Google Scholar]
- 34.Meiler J., Baker D. (2003) Proc. Natl. Acad. Sci. U.S.A. 100, 12105–12110 [DOI] [PMC free article] [PubMed] [Google Scholar]
- 35.Meiler J., Müller M., Zeidler A., Schmäschke F. (2001) J. Mol. Model. 7, 360–369 [Google Scholar]
- 36.Ghasparian A., Moehle K., Linden A., Robinson J. A. (2006) Chem. Commun. 2, 174–176 [DOI] [PubMed] [Google Scholar]
- 37.Bisang C., Weber C., Inglis J., Schiffer C. A., van Gunsteren W. F., Jelesarov I., Bosshard H. R., Robinson J. A. (1995) J. Am. Chem. Soc. 117, 7904–7915 [Google Scholar]
- 38.Canutescu A. A., Shelenkov A. A., Dunbrack R. L., Jr. (2003) Protein Sci. 12, 2001–2014 [DOI] [PMC free article] [PubMed] [Google Scholar]
- 39.Wu S., Zhang Y. (2007) Nucleic Acids Res. 35, 3375–3382 [DOI] [PMC free article] [PubMed] [Google Scholar]
- 40.Karplus K., Karchin R., Draper J., Casper J., Mandel-Gutfreund Y., Diekhans M., Hughey R. (2003) Proteins Struct. Funct. Genet. 53, 491–496 [DOI] [PubMed] [Google Scholar]
- 41.Shi J., Blundell T. L., Mizuguchi K. (2001) J. Mol. Biol. 310, 243–257 [DOI] [PubMed] [Google Scholar]
- 42.Tan K., Duquette M., Liu J. H., Dong Y., Zhang R., Joachimiak A., Lawler J., Wang J. H. (2002) J. Cell Biol. 159, 373–382 [DOI] [PMC free article] [PubMed] [Google Scholar]
- 43.Eswar N., Webb B., Marti-Renom M. A., Madhusudhan M. S., Eramian D., Shen M.-y., Pieper U., Sali A. (2007) in Current Protocols in Protein Science ( Coligan J. E., Dunn B. M., Speicher D. W., Wingfield P. T. eds) pp. 5.6.1–5.6.30, John Wiley & Sons, Inc., New York: [DOI] [PubMed] [Google Scholar]
- 44.Kabsch W., Sander C. (1983) Biopolymers 22, 2577–2637 [DOI] [PubMed] [Google Scholar]
- 45.Pettersen E. F., Goddard T. D., Huang C. C., Couch G. S., Greenblatt D. M., Meng E. C., Ferrin T. E. (2004) J. Comput. Chem. 25, 1605–1612 [DOI] [PubMed] [Google Scholar]
- 46.DeLano W. L. (2002) The PyMOL Molecular Graphics System, DeLano Scientific, San Carlos, CA [Google Scholar]
- 47.Cochrane A. H., Collins W. E., Nussenzweig R. S. (1984) Infect. Immun. 45, 592–595 [DOI] [PMC free article] [PubMed] [Google Scholar]
- 48.Yoshida N., Potocnjak P., Nussenzweig V., Nussenzweig R. S. (1981) J. Exp. Med. 154, 1225–1236 [DOI] [PMC free article] [PubMed] [Google Scholar]
- 49.Alonso P. L., Sacarlal J., Aponte J. J., Leach A., Macete E., Milman J., Mandomando I., Spiessens B., Guinovart C., Espasa M., Bassat Q., Aide P., Ofori-Anyinam O., Navia M. M., Corachan S., Ceuppens M., Dubois M. C., Demoitié M. A., Dubovsky F., Menéndez C., Tornieporth N., Ballou W. R., Thompson R., Cohen J. (2004) Lancet 364, 1411–1420 [DOI] [PubMed] [Google Scholar]
- 50.Aponte J. J., Aide P., Renom M., Mandomando I., Bassat Q., Sacarlal J., Manaca M. N., Lafuente S., Barbosa A., Leach A., Lievens M., Vekemans J., Sigauque B., Dubois M. C., Demoitié M. A., Sillman M., Savarese B., McNeil J. G., Macete E., Ballou W. R., Cohen J., Alonso P. L. (2007) Lancet 370, 1543–1551 [DOI] [PubMed] [Google Scholar]
- 51.Bojang K. A., Milligan P. J., Pinder M., Vigneron L., Alloueche A., Kester K. E., Ballou W. R., Conway D. J., Reece W. H., Gothard P., Yamuah L., Delchambre M., Voss G., Greenwood B. M., Hill A., McAdam K. P., Tornieporth N., Cohen J. D., Doherty T. (2001) Lancet 358, 1927–1934 [DOI] [PubMed] [Google Scholar]
- 52.Roggero M. A., Filippi B., Church P., Hoffman S. L., Blum-Tirouvanziam U., Lopez J. A., Esposito F., Matile H., Reymond C. D., Fasel N., et al. (1995) Mol. Immunol. 32, 1301–1309 [DOI] [PubMed] [Google Scholar]
- 53.Chang H. H., Falick A. M., Carlton P. M., Sedat J. W., DeRisi J. L., Marletta M. A. (2008) Mol. Biochem. Parasitol. 160, 107–115 [DOI] [PMC free article] [PubMed] [Google Scholar]
- 54.Boddey J. A., Moritz R. L., Simpson R. J., Cowman A. F. (2009) Traffic 10, 285–299 [DOI] [PMC free article] [PubMed] [Google Scholar]
- 55.Singh A. P., Buscaglia C. A., Wang Q., Levay A., Nussenzweig D. R., Walker J. R., Winzeler E. A., Fujii H., Fontoura B. M., Nussenzweig V. (2007) Cell 131, 492–504 [DOI] [PubMed] [Google Scholar]
- 56.Tossavainen H., Pihlajamaa T., Huttunen T. K., Raulo E., Rauvala H., Permi P., Kilpeläinen I. (2006) Protein Sci. 15, 1760–1768 [DOI] [PMC free article] [PubMed] [Google Scholar]
- 57.Bisang C., Jiang L., Freund E., Emery F., Bauch C., Matile H., Pluschke G., Robinson J. A. (1998) J. Am. Chem. Soc. 120, 7439–7449 [Google Scholar]
- 58.Matsushima N., Yoshida H., Kumaki Y., Kamiya M., Tanaka T., Izumi Y., Kretsinger R. H. (2008) Curr. Protein Pept. Sci. 9, 591–610 [DOI] [PubMed] [Google Scholar]
- 59.Nanzer A. P., Torda A. E., Bisang C., Weber C., Robinson J. A., van Gunsteren W. F. (1997) J. Mol. Biol. 267, 1012–1025 [DOI] [PubMed] [Google Scholar]
- 60.Frevert U. (2004) Trends Parasitol. 20, 417–424 [DOI] [PubMed] [Google Scholar]
- 61.Frevert U., Usynin I., Baer K., Klotz C. (2008) Subcell. Biochem. 47, 182–197 [DOI] [PubMed] [Google Scholar]
- 62.Mota M. M., Hafalla J. C., Rodriguez A. (2002) Nat. Med. 8, 1318–1322 [DOI] [PubMed] [Google Scholar]
- 63.Mota M. M., Pradel G., Vanderberg J. P., Hafalla J. C., Frevert U., Nussenzweig R. S., Nussenzweig V., Rodríguez A. (2001) Science 291, 141–144 [DOI] [PubMed] [Google Scholar]
- 64.Prudêncio M., Mota M. M. (2007) Cell Host Microbe 2, 286–288 [DOI] [PubMed] [Google Scholar]
- 65.Amino R., Giovannini D., Thiberge S., Gueirard P., Boisson B., Dubremetz J. F., Prévost M. C., Ishino T., Yuda M., Ménard R. (2008) Cell Host Microbe 3, 88–96 [DOI] [PubMed] [Google Scholar]
- 66.Coppi A., Tewari R., Bishop J. R., Bennett B. L., Lawrence R., Esko J. D., Billker O., Sinnis P. (2007) Cell Host Microbe 2, 316–327 [DOI] [PMC free article] [PubMed] [Google Scholar]
- 67.Cerami C., Frevert U., Sinnis P., Takacs B., Clavijo P., Santos M. J., Nussenzweig V. (1992) Cell 70, 1021–1033 [DOI] [PubMed] [Google Scholar]
Associated Data
This section collects any data citations, data availability statements, or supplementary materials included in this article.