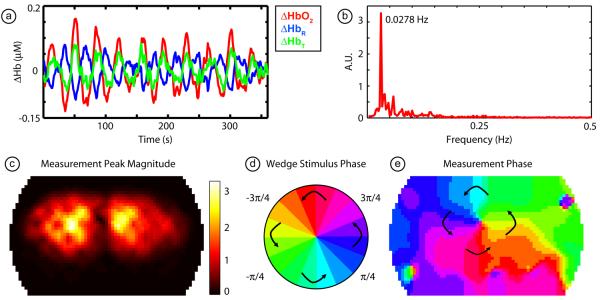
Figure 6. Fourier processing of phase-encoded data.
(a) Time traces in all three contrasts (ΔHbO2, ΔHbR, and ΔHbT) from a single pixel (subject 1, session 1). Note the high signal-to-noise as we see ten activations due to the ten cycles of the stimulus. As each contrast trace has individually been mean-subtracted, the returns to baseline between the cycles appear as “deactivations”. (b) Magnitude of the Fourier transform of the ΔHbO2 signal in (a). Note the strong peak at the rotation frequency, with little background noise in the signal. (c) An image of the magnitude of the peak in the Fourier transform across the field-of-view of the pad. Bright areas correspond to pixels that respond most strongly to the stimulus. Two visual hemispheres are clearly visible. (d) A legend defining phases of visual angle within the visual field. (e) The phase of the Fourier transform of each pixel in the field-of-view. This phase corresponds to the delay between the start of the stimulus cycle and the activation of that region in the cortex and thus relates each location in the visual field to its cortical projections.

