Abstract
Purebred dogs are a valuable resource for genetic analysis of quantitative traits. Quantitative traits are complex, controlled by many genes that are contained within regions of the genome known as quantitative trait loci (QTL). The genetic architecture of quantitative traits is defined by the characteristics of these genes: their number, the magnitude of their effects, their positions in the genome and their interactions with each other. QTL analysis is a valuable tool for exploring genetic architecture, and highlighting regions of the genome that contribute to the variation of a trait within a population.
Introduction
Here we review the QTL analysis of skeletal variation in the Portuguese water dog. This analysis gives insight into the genetic architecture that informs the skeleton. The skeleton is a complex system composed of many individual bones that must work in concert. Skeletal size and shape involve combinations of bones that covary. These combinations also can be treated as quantitative traits.
Analysis of Portuguese water dogs has provided insight into three interesting phenotypes: sexual size dimorphism, bilateral asymmetry and functional morphology. The nucleotide sequence of the canine genome, in conjunction with the skeletal morphology of other purebred dog populations, now enables the further reduction of individual QTLs to the relevant genes that govern each trait.
Analysis of genetic architecture
Genetic analysis of complex, polygenic phenotypes (quantitative traits) focuses on the interaction of genes with their environment and with each other. The first step in such an analysis is the identification of quantitative trait loci (QTLs, Box 1), regions of the genome containing one or more genes that inform the phenotype. Whereas QTL identification is the first step in the process of identifying specific genes it also can provide information about the relationship of genetic architecture to the expression and evolution of complex traits [1].
Box 1. QTL identification
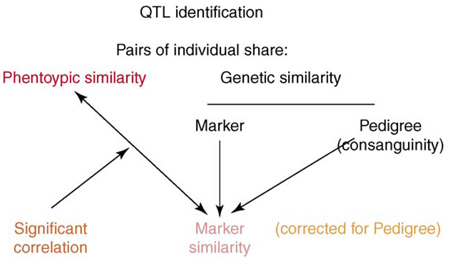
Associating QTLs with a marker involves pairwise correlations between the genotypic similarity at a marker and the phenotypic similarity that characterizes a particular trait, using all of the dogs in the population.
A marker is tested for association with a phenotype using pairs of dogs in an inbred population [15]. For each pair of dogs we have three pieces of information: (i) the consanguinity (relatedness over the entire genome); (ii) the marker sharing (relatedness at the locus); and (iii) the phenotypic similarity (Figure I). Correlation between consanguinity and phenotypic similarity is evidence for genetic control of the phenotype (heritability). Correlation between marker similarity and phenotypic similarity is evidence for association between the marker and the phenotype (QTL). Each marker sharing score will be similar to the consanguinity but more accurate for the specific region of the genome. To avoid false positives, only the information specific to the marker and independent of all the other markers segregating in the pedigree (consanguinity) is used to test for QTLs.
Characterizing QTLs
The process described above gives a measure of association between the marker and the phenotype but it does not define the effect of the individual marker alleles or genotypes. Mixed model analysis [52,53] enables the estimation of genotype means against the background of additive genetic variance. This requires the simultaneous estimation of additive genetic variance and marker genotype using an iterative process.
Figure I. Identifying QTL markers.
Analysis of genetic architecture involves a compromise between phenotypic variation encountered and the statistical power available. Structured populations such as backcross or intercross populations have great statistical power but phenotypes are limited to the genetic variation of the parents. By contrast, unstructured populations with accurate pedigrees, such as human isolates or canine breeds, often display great breadth of phenotypic variation and present situations where phenotypes of particular interest can be studied. Combined with molecular markers, a genetic map and detailed sequence information, they become powerful tools in the study of polygenic phenotypes [2–4]. Purebred dog breeds (isolates) have become a unique resource for such analyses [5], illustrated here by examples of genetic architecture that inform the canid skeleton of the Portuguese water dog.
Choice of breed is important in such a study. The following characteristics recommended the Portuguese water dog [6]: (i) the breed comprises a modest number of individuals (~10 000) derived from a small (33 dogs) founder population; (ii) owners were eager to cooperate and provide phenotypic material (X-rays) and blood for genotyping; (iii) complete and accurate pedigree records were available tracing individual dogs back to the founders (deep pedigrees); (iv) a preliminary survey (tape measurements provided by more than 300 out of 500 owners contacted) demonstrated that morphological phenotypes were segregating. Using this information, simulations demonstrated that a detailed investigation would identify QTLs. In hindsight, that simulation was conservative given the recent findings that linkage disequilibrium within breeds is extensive – for example, 50 to 100 times greater than in humans [5,7,8]
Sexual size dimorphism
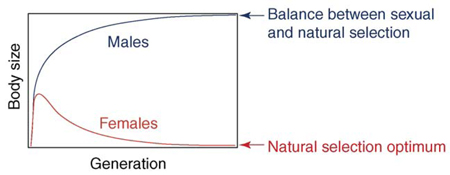
Most animals exhibit sexual size dimorphism and Portuguese water dogs are no exception (Box 2). Since Darwin, theories have been advanced to explain the evolution of this phenomenon [9–13]. In particular, Lande [10] proposed that sexual size dimorphism occurs as a two-step process: initially, male competition results in selection for larger males. This sexual selection acting on body size makes the species larger. Presumably, both males and females get larger as a result of sexual selection on males. Sexual size dimorphism evolves later as a result of natural selection for optimal body size that favors genes that secondarily reduce the size of females (Box 2).
Box 2. Hypothetical two-stage evolution of sexual size dimorphism in Portuguese water dogs
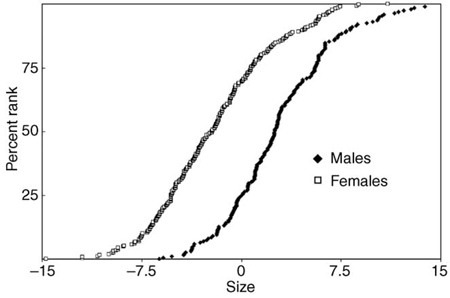
Sexual size dimorphism in Portuguese water dogs is an example of differences in a quantitative trait resulting from genotype. Figure I depicts the genotypic populations represented as cumulative distributions of males and females. Note that some female dogs are as large as the larger males and some males are as small as smaller females.
Such dimorphism was explained by Lande [10] as a two-stage evolutionary process (Figure II): firstly, under sexual selection for larger males, body size of both males and females starts to increase; secondly, female body size decreases as a result of natural selection to improve fitness. Data from the Portuguese water dog led to the genetic model in Figure 1, which is consistent with this evolutionary hypothesis.
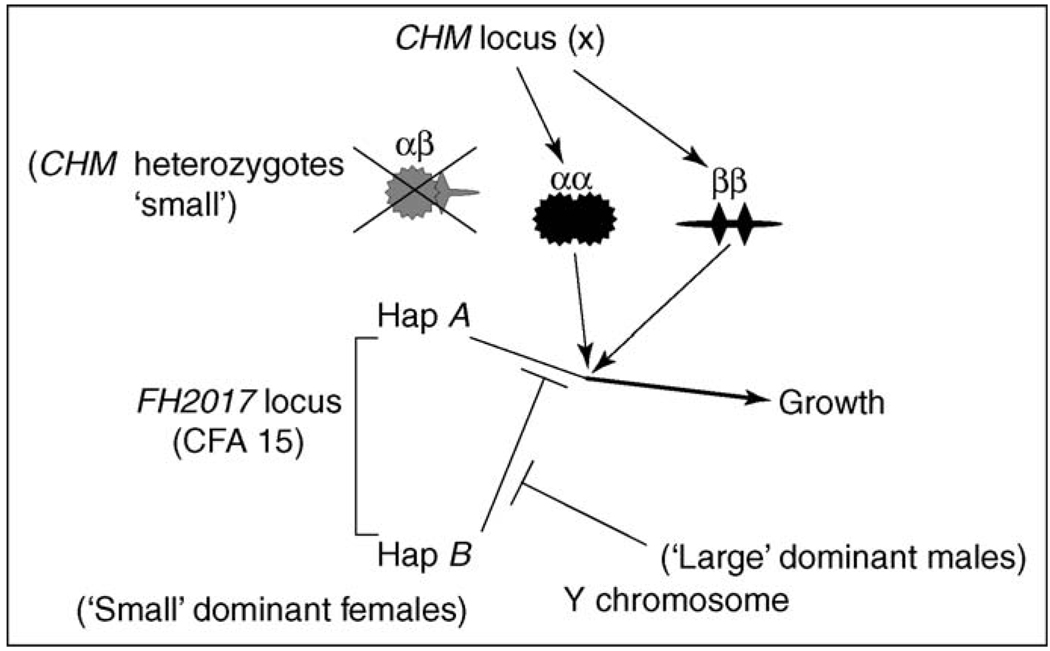
Two observations contribute to the model in Figure 1: (i) QTL haplotypes for large size on autosome 15 (CFA 15) were dominant in males, but recessive to small in females; (ii) interaction between haplotypes on the X (CHM) and CFA 15 (FH2017) chromosomes also affected the size of female Portuguese water dogs contributing to sexual size dimorphism. Table I shows that males that are AA at the FH2017 autosomal haplotype are large whether the genotype at the CHM marker on the X chromosome is α or β. FH2017 AA females are also large if the genotype of the CHM marker is either αα or ββ. By contrast, FH2017 AA females are small if the genotype of the CHM marker is αβ. Because males are never heterozygous for markers on X, this contributes to sexual size dimorphism.
Figure I. The genotypic populations represented as cumulative distributions; each point is the value of a female (XX = □) or male (XY = ♦) dog ranked according to increasing size represented by the value of principal component 1, an averaging over all of the 70+ skeletal metrics [15]. Values (of both sexes combined) were normalized to a mean of zero. Reproduced, with permission from Cold Spring Harbor Laboratory Press, from Chase et al. [14].
Figure II. Representation of the two-stage process proposed by Lande to explain sexual size dimorphism. Reproduced, with permission from the Annual Review of Systematics, from Ref. [11].
Table I.
Mean sizes of FH2017 AA dogs. Sizes (measured as PC1, see text) were normalized to a population mean of zero
| Population | Mean | SE |
|---|---|---|
| Males: CHM, α or β | 3.54 | 0.89 |
| Females: CHM, αα or ββ | 2.43 | 0.77 |
| Females: CHM, αβ | −0.63 | 0.57 |
QTL data from Portuguese water dogs [14] have supplied a genetic mechanism that supports the model of Lande: two QTLs associated with size variation are located on the X chromosome and on autosome 15 (CFA 15), respectively. The autosomal QTL is linked to a simple sequence repeat marker (SSR FH2017) in a region that also contains IGF1 (insulin growth factor 1) [15,16], a gene that regulates postnatal skeletal growth. Interaction between these QTLs leads to sexual size dimorphism.
On average, females are significantly smaller than males. Large is dominant in males, whereas small is dominant in females: on CFA 15, a haplotype containing the A allele of the FH2017 SSR marker is associated with large dogs, whereas small dogs are associated with a haplotype containing allele B of the same marker. In males, FH2017 diplotypes AA and AB are large. In females diplotypes AB and BB are small
Additionally, all females heterozygous for a QTL genotype on the X chromosome are small. This QTL is associated with the CHM gene, which does not regulate size but contains an SSR that serves as a marker for the size haplotypes on the X. Like the marker on autosome 15, this marker also has two main alleles, α and β, that define two haplotypes. When X chromosome diplotypes are homozygous, CHM αα or ββ, CFA 15 AA females (at marker FH2017) are as large as AA males. However, females heterozygous for the CHM haplotype (αβ) are all small, and in these size does not segregate with autosome CFA 15 genotypes (i.e. FH2017 AA, AB or BB genotypes are all small, see Table I in Box 2). This is evidence for an interaction between the CHM and FH2017 haplotypes that affects size (Box 2). In all, the interactions between the X chromosome and autosome 15 account for ~50% of the sexual size dimorphism observed in Portuguese water dogs.
The data are consistent with the model in Figure 1 [14]: CFA 15 autosomal haplotype A promotes growth to large size, enabled by interaction with the CHM diplotype on the X chromosome. CHM genotypes produce homomultimers that interact, whereas heteromultimers are inactive (spoiling). CFA 15 haplotype B inhibits this process. Some factor regulated by the Y chromosome (probably testosterone) blocks the inhibition regulated by CFA 15 haplotype B.
Figure 1.
Diagrammatic representation of the model proposed by Chase et al. [14] for the interaction between loci associated with markers CHM and FH2017 to provide a genetic basis of sexual size dimorphism in Portuguese water dogs. Haplotype A promotes growth in conjunction with multimeric factors αα or ββ regulated by the X chromosome. Heteromultimers are inactive. Haplotype B inhibits this promotion of growth. This action of haplotype B is itself inhibited by some factor regulated by the Y chromosome. Reproduced, with permission from Cold Spring Harbor Laboratory Press, from Chase et al. [14].
Dominance makes the selective process rapid. The model also explains Rensch’s rule that sexual size dimorphism tends to be greater in larger species [11,17,18] and why, despite sexual size dimorphism, large females can persist in many species [11].
Genetic architecture related to bilateral asymmetry
All tetrapods have an intrinsic bilateral asymmetry as evidenced by the spatial distribution of their internal organs [19]. Additionally, their center of gravity changes as they move, resulting in differential stress on the skeleton. A point of stress is the coxofemoral (hip) joint. Are there loci that recognize and compensate for this asymmetry?
Most dog breeds show variation in the degree of laxity of the hip joint, often measured quantitively by the Norberg angle [20]. This measure has been used to identify QTLs that regulate hip-joint laxity in Portuguese water dogs [21] and in a cross between greyhounds and Labrador retrievers [22]. Asymmetric genetic effects were noted in both studies. In Portuguese water dogs, there is a strongly significant difference in the laxity of the left and right joints [21]. Two QTLs were identified in this breed, one affecting the right, the other the left coxofemoral (hip) joints, focusing attention on the genetic control of bilateral asymmetry. Alternative interpretations of the data were as follows.
The expression of genotypic variation is dependent on preexisting phenotypic asymmetry in laxity. One QTL only expresses its phenotypic variation under conditions of greater laxity whereas the other can only be expressed under conditions of lesser laxity.
Different loci might be regulating independent development of the right vs the left side of the animal, resulting in bilateral asymmetry of joint laxity.
These results direct attention to the selective effects of the asymmetric distribution of organs on vertebrate genotypes in addition to possible selective effects of ‘handedness’, if it exists in tetrapods.
Functional morphology: QTLs affecting shape
If anatomical or physiological factors limit simultaneous optimization of two relevant performance criteria, a compromised phenotype results that meets both criteria to some extent, but achieves excellence in neither [23,24]. Such trade-offs are inevitable in evolution. The concept of functional trade-offs is often used to explain why species or populations differ in niche, reproductive strategy, performance criteria and behavior [25]. Genetic analysis of Portuguese water dogs raised the possibility that the organization of genes controlling the morphology of the canine skeleton enables rapid phenotypic change in response to selection for function along a trade-off continuum between speed and power of a dog [15,26] (Box 3).
Box 3. Different dog breeds can be used for reducing haplotype length
Humans have managed the dog population for longer than any other domesticated animal, providing ample time and opportunity to select for novel phenotypic variations regulated by new alleles that were increased in frequency by drift and selection. Geographic isolation and selection for diverse tasks such as herding, guarding, hunting, retrieving, drafting and companionship created specialized subtypes within the species (Figure I). During the past two centuries these geographic isolates and morphological ‘types’ have become what we recognize today as the modern breeds: reproductively closed populations often derived from a small number of founder animals.
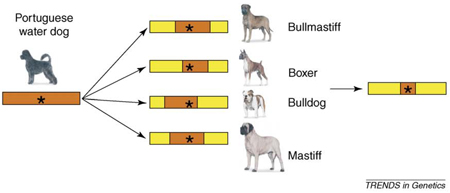
Not surprisingly, each breed although genetically differentiated has limited genetic diversity and common haplotypes are shared among breeds. Thus, Parker et al. [49] found that breed membership accounted for 27% of total genetic variation and dogs could be assigned to their correct breed solely on the basis of genetic data. Significant differences in genetic composition separated four breed clusters: (i) Asian breeds including the Akita and chow-chow that grouped with the wolf; (ii) large, heavy, working breeds such as the boxer, mastiff and Newfoundland; (iii) a mixture of herding breeds such as Shetland sheepdog and Belgian Tervuren and non-herders like the greyhound and whippet; and (iv) a heterogeneous mix comprising mostly more recent European breeds. Such breeds can be used to reduce haplotype length around a QTL (Figure II).
Figure I. Dog breeds resulting from selection for energy-efficient speed (left) or power (right). Prototypic breeds exemplifying extremes from these groups are greyhounds or pit bulls (left and right center).
Figure II. Haplotype reduction based on common sequence shared by haplotypes regulating body size in different extreme breeds. Segregation of size in Portuguese water dogs (see Box 2) enables the identification of a QTL containing the size haplotype shown at left. Regions of common haplotype nucleotide sequence can be identified in four other breeds (large, bullmastiff and mastiff; or small, boxer or bulldog) (right) reducing the haplotype to a much smaller region of common sequence.
Metrics of the canine skeleton, obtained either by direct measurement or from radiographs, present a complex array of data (e.g. Figure 2 in Chase et al. [15] identifies 72 metrics). Chase and others [15,26] have used principal component (PC) analysis [27] to reduce the complexity of this array while retaining most of the information in the dataset obtained from radiographs of Portuguese water dogs. This technique transforms a set of correlated variables into independent sets of variables, vectors known as the principal components (PCs). The first PC explains the largest amount of skeletal variation (around 50% in canids), the second the next largest (no more than 15%) and so on. An unexpected result was that the PCs lent themselves to a biological interpretation: the first PC represents size as an overall average of the more than 70 different radiographic bone metrics taken from each animal (see size data on Portuguese water dogs in Box 2). It explains ~50% of the total skeletal variation, and is highly correlated with body weight. (This is true of different dog breeds as well. Thus, all the bones of a Pekingese are small, those of an Irish wolfhound are large).
Figure 2.
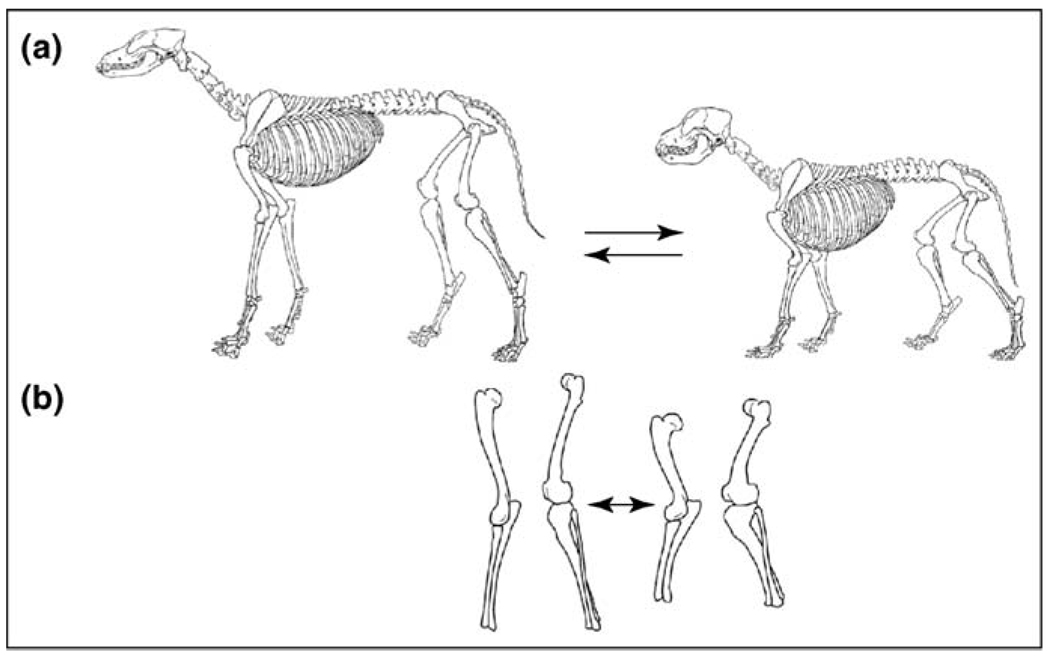
Skeletal shapes that represent functional trade-offs between speed and power. Dog shapes can vary along different independent trade-off axes, defined by principal components [15]. (a) A trade-off between the size of the skull and the postcranial body. Dogs can have small skulls and relatively large bodies (left) or larger skulls coupled with smaller bodies (right) [15]. (b) Independently, metrics of limb bones can vary along a length–width axis to produce longer, thinner (left) or shorter, thicker limbs (right) [26]. These trade-off axes, representing compromise between speed and power, have been observed in both dogs and foxes [28], which are separated by 10 million years of evolution [29].
The remaining PCs represented aspects of shape and were more complex, with variation due to some traits (loadings) inversely correlated with variation contributed to the PC by other traits. These PCs represent a trade-off between power and speed as illustrated in Box 3. Thus, in Figure 2a, smaller head and larger postcranial body (left) is associated with speed (e.g. greyhound), whereas a large head and smaller postcranial body (right) represents more power (e.g. pit bull). This shape variation is characterized by one principal component [15]. Another PC describes an independent component of shape variation that affects metrics of length versus width [26]. This is illustrated in Figure 2b in which the dimensions of a limb bone associated with speed (long and thin – on left) are part of a trade-off axis in which shorter, thicker bones support a more powerful morphology (Figure 2b, right). Similar PCs have been obtained for the fox [28], separated by 10 million years of evolution from the dog [29,30]. Recent radiographic data have identified several more such trade-offs common to both species. These are also components of shape consistent with the power versus speed trade-off [26] (L. Trut et al., unpublished).
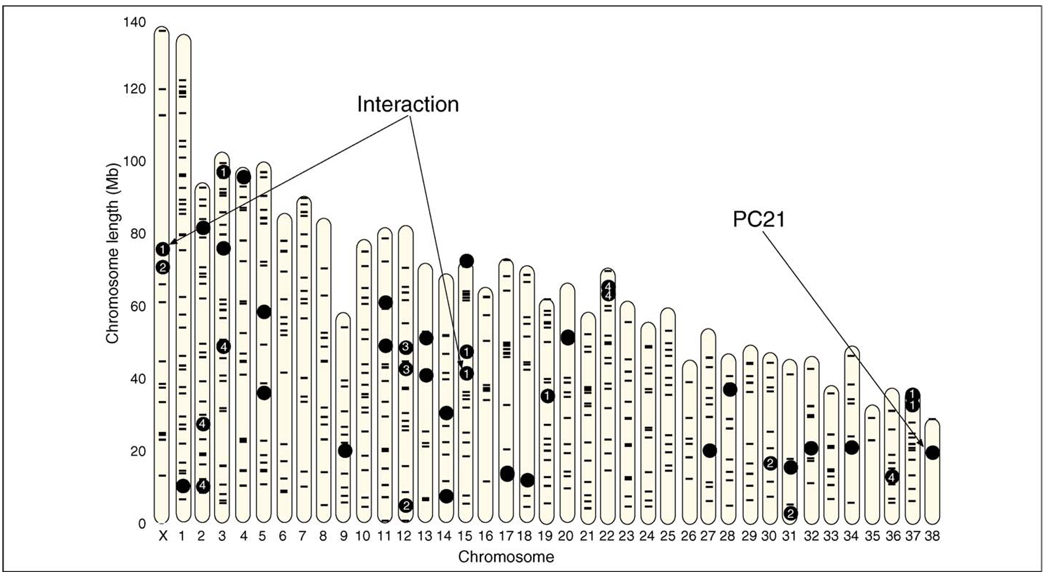
PCs are phenotypes subject to genetic analysis [15]. Every animal has a value for every PC that characterizes the variation in the population (this is illustrated by Figure I in Box 2, graphing the values for PC1 of male and female Portuguese water dogs). Several nonlinked QTLs have been identified that regulate variation in size (PC1) and shape (PC2, PC3, etc.). PCs derived from the radiographic metrics of the skeleton have been associated with a large number of QTLs distributed throughout the genome of the Portuguese water dog (Figure 3).
Figure 3.
Map of the canine genome showing the position of QTLs regulating PCs derived from metrics of the Portuguese water dog pelvis and limb bones. The X chromosome and 38 autosomes are noted on the abscissa, chromosome length on the ordinate is in megabases. QTLs (●) and the SSR markers used to locate them (−) are represented on the physical map of the genome. The interaction between chromosomes X and CFA 15 that leads to sexual size dimorphism is noted. PCs 1–4 and PC 21 are noted. Other loci represent additional PCs not discussed. Reproduced, with permission from Cold Spring Harbor Laboratory Press, from Carrier et al. [26].
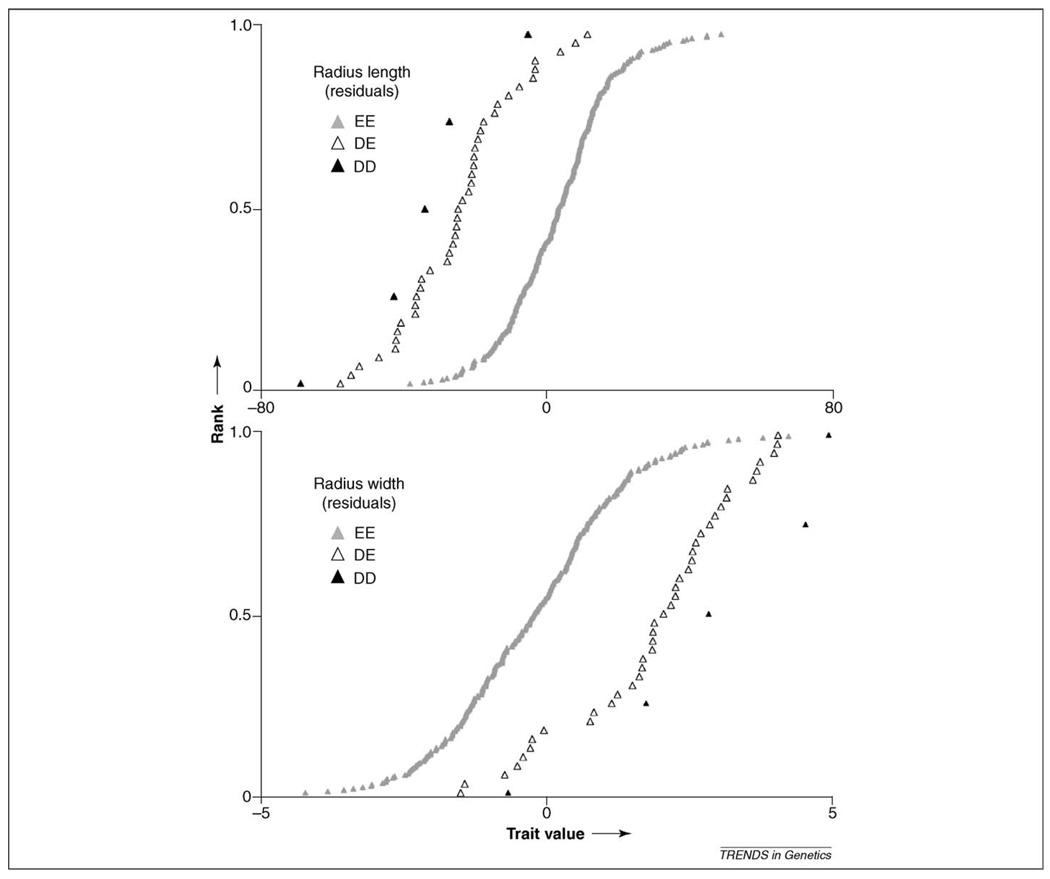
A more detailed analysis of these QTLs has examined the effects of a QTL on specific traits involved in the trade-off it regulates [15,26]. Thus, the PC involving a trade-off between length and width of limb bones [26] is regulated by a QTL associated with marker FH3585 on CFA 12. Specific haplotypes at this locus regulate both the length and width of limb bones. For example, in Figure 4 (K. Chase and K. Lark, unpublished), it can be seen that the D haplotype results in a wider but shorter radius. Similarly, haplotypes specifically regulate both the length of the snout (skull) and the width of the humerus [15]; or the size of the pelvis and the dimensions of limb bones [26]. In each case, a particular haplotype is regulating multiple aspects of the skeletal anatomy. Either a single gene informs several skeletal phenotypes (e.g. a signal interacting with different receptors) or several linked genes within the haplotype perform that function. Interestingly, the phenotypic characters involved are aspects of functional morphology involved in the trade-off between power and speed.
Figure 4.
A QTL on CFA 12 in the Portuguese water dog regulates both the length (upper panel) and the width (lower panel) of limb bones (K. Chase and K.G. Lark, unpublished). The values shown are residuals of radius length after correction for overall size. Individual dogs are ranked in order of increasing bone length. Three genotypes are shown composed of the haplotypes D and E.
The observed patterns of variation in skeletal metrics might reflect the ontogenetic transition from the juvenile to the adult state [31–33]. In mammals, newborns require anatomical specializations that result in relative uniformity of newborn body shape [34,35]. Adult behaviors associated with feeding, locomotion, reproduction and sociality require changes in shape and proportion of the skeletal system during postnatal growth in most or all species of mammals [36]. Genetic components that regulate the sets of inversely correlated characters of the shape PCs could account for much of this transformation. For example, appropriate temporal activation of different genes could produce the short, broad face and limbs of newborn dogs on the one hand, followed by the development of the relatively longer and narrower face and more gracile limbs of adults on the other. This suggestion is consistent with analyses of skeletal dimensions in canids [33,37], which indicate that allometry (relative scaling of shape metrics) among adults of different species is often nearly identical to the shapes encountered during the course of postnatal growth.
The expression of multiple forms of phenotypic variation associated with single QTLs can explain in large part how it has been possible to select so rapidly for breeds with different functional morphologies [38–40]. Such an explanation requires that the genes involved are ancient and probably central to a network that regulates many different aspects of postnatal growth. The fact that the same PCs are found in the fox provides an opportunity to determine if this is true. The fox is an outgroup for modern canids and its phylogenetic lineage has been separated from that of the dog for about 10 million years [29]. Fox populations exhibit similar PCs to the dog [28], and at least one population has all of the prerequisite pedigree information to identify QTLs by establishing associations between genetic markers and PC phenotypes [28,41]. This process is currently underway (L. Trut et al., unpublished) and preliminary information has demonstrated that in the fox at least one trade-off axis of variation (shape PC) is regulated by a particular QTL haplotype.
An intriguing aspect of the dog vs fox comparison currently underway is that PC 21, derived from a matrix using 21 limb-bone traits, is common to both species. This PC involves a trade-off between the humerus and tibia on the one hand and the radius on the other and accounts for a small amount of skeletal variation (~0.2% of the variation in the fore and hind limbs). It is heritable (~40%) in both species and associated significantly with a dog QTL on autosome CFA 21 (see Figure 3). Why has the relationship between these skeletal elements not become fixed? How has an axis of variation, involving such a small change, survived?
Opposing selections might have maintained the variation during the intervening 10 million years despite bottlenecks that occurred during domestication and breed selection [42]. Alternatively, the variation might involve a hypermutable gene that has maintained multiple alleles in the population. Fondon and Garner [43] have proposed that repeat sequences within genes could produce the hypervariability required for the rapid evolution of morphology observed in dogs. They argue that simple sequence repeat (SSR) expansion and contraction occurring in coding sequences of developmental genes [44] can better explain the diverse morphological types that are observed than can mutations such as single nucleotide polymorphisms (SNPs). Such SSR mutations could occur at rates up to 100 000 times greater than those characterizing SNP creation [44]. This model is supported by their findings that many developmental genes in dogs carry a wide array of distinct alleles for simple sequence repeats within coding sequences [43], some of which correlate with changes in morphology.
Such ‘slippery’ genes, where mutations can increase or decrease the length rapidly, could maintain allele variation over the millennia that separate the fox and the dog. Isolation of the genes responsible for the effects of QTLs should distinguish between these hypotheses and between hypotheses that explain the multiple action of shape QTLs: does one gene regulate multiple processes or are sets of closely linked, coselected genes responsible for the trade-offs associated with shape QTLs? Such questions can be resolved with the identification of the relevant gene(s), within a QTL, that inform the phenotype.
From QTL to gene – the use of linkage disequilibrium
Limited gene flow, population bottlenecks and extensive breeding from a few ‘popular’ sires have resulted in breeds with extensive linkage disequilibrium (LD) [7,8,45]. LD refers to the size of a contiguous segment of the genome in which all alleles are inherited as one, unaltered, block (not altered by recombination). Within each of ten different breeds analyzed, linkage disequilibrium extends for megabases and haplotype diversity is limited [7,8] – typically, 80% of chromosomes within a breed carry five or fewer haplotypes at a given locus [8]. Whereas linkage disequilibrium that extends for several megabases is advantageous for identifying QTLs (because fewer markers are needed to cover the genome), the genetic complexity of the large haplotype created by this extensive LD presents an obstacle to identifying specific causal mutations. The existence of multiple breeds with similar morphologies (see Box 3) presents a potential solution to this difficulty. Recent data have shown that SNP haplotypes, roughly10–20 kb in size, are commonly shared among different breeds [8]. These were interpreted to correspond to haplotype blocks retained from dog populations ancestral to modern breeds. In some cases haplotypes as long as 100 kb are shared among modern breeds.
Ancestral populations that were isolated by geographic factors and/or by some level of selective breeding (including selection for functional morphology) predate the founding of modern breeds by millennia [46,47]. Thus, ancient alleles are probably responsible for the morphological phenotypes of modern dogs. These facts suggest that under favorable circumstances a haplotype carrying a causal mutation could potentially be whittled down to a modest size, provided that several breeds can be obtained that share the mutation on an identical-by-descent basis.
If ancient alleles are responsible for contributing to phenotypes it becomes possible to use a two-stage process to fine-map within a QTL [48]. First, the interval of the QTL containing the relevant haplotype is reduced as far as possible using the population in which the phenotype is segregating (e.g., the heritable morphology of the Portuguese water dog). In this region, haplotypes can be identified that are associated with the variation in the phenotype. In the second stage, particular dog breeds are identified that exhibit an extreme version of the phenotype over much or perhaps all of their population (i.e. the phenotype is fixed). Ideally, multiple breeds for each extreme of the phenotype will be found. This will be most successful in populations specifically selected for the phenotype of interest. Comparing the regions of sequence that are in common between these breeds should then reduce the length of the haplotype to a much shorter common region containing the gene(s) of interest (Box 3).
Fortunately, skeletal morphology is a prototypic example of stringent phenotypic selection. Each pure breed of dog that is recognized by the American Kennel Club must have a written breed standard that describes the ideal conformation of members of the breed [39,40]. Many breed standards disallow dogs outside a specified range of size and shape. Thus, breeds exhibiting the most extreme phenotypes are likely to carry a common fixed allele at many of the genes that contribute to the phenotype and this allele is expected to differ from the allele(s) carried by breeds with the opposite phenotypic extreme. In the time that has elapsed since these breeds diverged from common founders, recombination will have eroded the LD interval down to a smaller common interval surrounding the ancestral haplotype block containing the causative mutation.
This approach would be compromised if the genes involved are hypermutable as, for example, suggested by Fondon and Garner [43]. In this case, one might expect that the genotype–phenotype relationship could remain variable, if not within the breed then between closely related breeds. The recent demonstration that breed phylogenetics can be analyzed and breed relatedness defined by genome-wide comparison of SNP and SSR polymorphisms [49] makes such a determination feasible. Another approach is to examine recent breeds in which the phenotype is varying, as in the Portuguese water dog. Comparing phenotypic extremes within the breed should rapidly determine whether the same locus is varying, after which the procedure of haplotype comparison outlined above should lead to reduction in haplotype length. The essential resource that makes various approaches possible is the existence of hundreds of breeds (isolates) in which phenotypes are either fixed or still varying.
The dog as a model system for the genetics of quantitative traits
Although the transition from QTL to gene has yet to be worked out, the dog has already proved to be an excellent system for analyzing genetic architecture. The approach outlined here can be applied to complex systems other than skeletal morphology. Examples of such systems are the endocrine, immune or higher cognitive systems. Consider the following hypothetical scenario: imaging of the brain has progressed to a stage of great resolution [50]. If the brains of genotyped Portuguese water dogs were to be imaged at high resolution it rapidly should become evident whether or not the metrics obtained are heritable. If so, the great LD should enable identification of QTLs. If, as seems likely, the plasticity of the brain obscures the heritability of individual metrics, principal component analysis could reveal heritability of networks arising from common sources, the loci for which could then be identified. Such an analysis could reveal the genetic architecture that underlies the structure of the brain.
The Portuguese water dog is one breed of many, and the opportunities seem endless. In the future, breed maps could become as valuable as hapmaps [51] in the generalization of the genetic basis of morphology, behavior and complex pathological phenotypes such as autoimmune disease.
Acknowledgements
Nathan Sutter is a Waltham Foundation Fellow in the Ostrander Canine Genetics Laboratory of the National Human Genome Research Institute. Research described in this review was supported by NIH grants GM-063056 FIRCA TW 07056 to Karl Lark and by support to Elaine Ostrander from NIH and the Burroughs Wellcome Foundation. We thank David Carrier, Franz Goller, Kent Golic and Elaine Ostrander for their thoughtful comments on the manuscript; and the AKC and Chet Jezierski for use of the copyrighted canine artwork used in Box 3.
References
- 1.Darvasi A. Dissecting complex traits: The geneticists “Around the world in 80 days”. Trends Genet. 2005;21:373–376. doi: 10.1016/j.tig.2005.05.003. [DOI] [PubMed] [Google Scholar]
- 2.Doerge RW. Mapping and analysis of quantitative trait loci in experimental populations. Nat. Rev. Genet. 2002;3:43–52. doi: 10.1038/nrg703. [DOI] [PubMed] [Google Scholar]
- 3.Barton NH, Keightley PD. Understanding quantitative genetic variation. Nat. Rev. Genet. 2002;3:11–21. doi: 10.1038/nrg700. [DOI] [PubMed] [Google Scholar]
- 4.Glazier AM, et al. Finding genes that underlie complex traits. Science. 2002;298:2345–2349. doi: 10.1126/science.1076641. [DOI] [PubMed] [Google Scholar]
- 5.Ostrander EA, Wayne RK. The canine genome. Genome Res. 2005;15:1706–1716. doi: 10.1101/gr.3736605. [DOI] [PubMed] [Google Scholar]
- 6.Chase K, et al. Teaching a new dog old tricks: Identifying quantitative trait loci [in dogs] using lessons from plants. J. Hered. 1999;90:43–51. doi: 10.1093/jhered/90.1.43. [DOI] [PubMed] [Google Scholar]
- 7.Sutter NB, et al. Extensive and breed-specific linkage disequilibrium in Canis familiaris. Genome Res. 2004;14:2388–2396. doi: 10.1101/gr.3147604. [DOI] [PMC free article] [PubMed] [Google Scholar]
- 8.Lindblad-Toh K, et al. Genome sequence, comparative analysis and haplotype structure of the domestic dog. Nature. 2005;438:803–819. doi: 10.1038/nature04338. [DOI] [PubMed] [Google Scholar]
- 9.Kirkpatrick M. Sexual selection and the evolution of female choice. Evolution. 1982;36:1–12. doi: 10.1111/j.1558-5646.1982.tb05003.x. [DOI] [PubMed] [Google Scholar]
- 10.Lande R. Sexual dimorphism, sexual selection, and adaptation in polygenic characters. Evolution. 1980;34:292–305. doi: 10.1111/j.1558-5646.1980.tb04817.x. [DOI] [PubMed] [Google Scholar]
- 11.Fairbairn DJ. Allometry for sexual size dimorphism: Pattern and process in the coevolution of body size in males and females. Annu. Rev. Ecol. Syst. 1997;28:659–687. [Google Scholar]
- 12.Kraaijeveld-Smit FJL, et al. Paternity success and the direction of sexual selection in a field population of a semelparous marsupial, Antechinus agilis. Mol. Ecol. 2003;12:475–484. doi: 10.1046/j.1365-294x.2003.01745.x. [DOI] [PubMed] [Google Scholar]
- 13.Bouteiller-Reuter C, Perrin N. Sex-specific selective pressures on body mass in the greater white-toothed shrew, Crocidura russula. J. Evol. Biol. 2005;18:290–300. doi: 10.1111/j.1420-9101.2004.00836.x. [DOI] [PubMed] [Google Scholar]
- 14.Chase K, et al. Interaction between the X chromosome and an autosome regulates size sexual dimorphism in Portuguese Water Dogs. Genome Res. 2005;15:1820–1824. doi: 10.1101/gr.3712705. [DOI] [PMC free article] [PubMed] [Google Scholar]
- 15.Chase K, et al. Genetic basis for systems of skeletal quantitative traits: Principal component analysis of the canid skeleton. Proc. Natl. Acad. Sci. U. S. A. 2002;99:9930–9935. doi: 10.1073/pnas.152333099. [DOI] [PMC free article] [PubMed] [Google Scholar]
- 16.Guyon R, et al. A 1 Mb resolution radiation hybrid map of the canine genome. Proc. Natl. Acad. Sci. U. S. A. 2003;100:5296–5301. doi: 10.1073/pnas.0831002100. [DOI] [PMC free article] [PubMed] [Google Scholar]
- 17.Abouheif E, Fairbairn DJ. A comparative analysis of allometry for sexual size dimorphism: Assessing Rensch’s rule. Am. Natur. 1997;149:540–562. [Google Scholar]
- 18.Székely T, et al. Sexual selection explains Rensch’s rule of size dimorphism in shorebirds. Proc. Natl. Acad. Sci. U. S. A. 2004;101:12224–12227. doi: 10.1073/pnas.0404503101. [DOI] [PMC free article] [PubMed] [Google Scholar]
- 19.Cooke J. Developmental mechanism and evolutionary origin of vertebrate left/right asymmetries. Biol. Rev. Camb. Philos. Soc. 2004;79:377–407. doi: 10.1017/s1464793103006298. [DOI] [PubMed] [Google Scholar]
- 20.Adams WM, et al. Early detection of canine hip dysplasia: Comparison of two palpation and five radiographic methods. J. Am. Anim. Hosp. Assoc. 1998;34:339–347. doi: 10.5326/15473317-34-4-339. [DOI] [PubMed] [Google Scholar]
- 21.Chase K, et al. Bilaterally asymmetric effects of quantitative trait loci (QTLs): QTLs that affect laxity in the right versus left coxofemoral (hip) joints of the dog (Canis familiaris) Am. J. Med. Genet. A. 2004;124:239–247. doi: 10.1002/ajmg.a.20363. [DOI] [PMC free article] [PubMed] [Google Scholar]
- 22.Todhunter RJ, et al. Quantitative trait loci for hip dysplasia in a cross-breed canine pedigree. Mamm. Genome. 2005;16:720–730. doi: 10.1007/s00335-005-0004-4. [DOI] [PubMed] [Google Scholar]
- 23.Maynard Smith J, et al. Developmental constraints and evolution. Quar. Rev. Biol. 1985;60:265–287. [Google Scholar]
- 24.Niklas KJ. Morphological evolution through complex domains of fitness. Proc. Natl. Acad. Sci. U. S. A. 1994;91:6772–6779. doi: 10.1073/pnas.91.15.6772. [DOI] [PMC free article] [PubMed] [Google Scholar]
- 25.Stearns SC. The Evolution Of Life Histories. Oxford University Press; 1992. [Google Scholar]
- 26.Carrier DR, et al. Genetics of canid skeletal variation: Size and shape of the pelvis. Genome Res. 2005;15:1825–1830. doi: 10.1101/gr.3800005. [DOI] [PMC free article] [PubMed] [Google Scholar]
- 27.Venables WN, Ripley BD. Modern Applied Statistics with S. Springer-Verlag; 2002. [Google Scholar]
- 28.Trut LN, et al. Morphology and behavior: Are they coupled at the genome level? In: Ostrander EA, et al., editors. The Dog and its Genome. Cold Spring Harbor Laboratory Press; 2005. pp. 81–93. (Cold Spring Harbor Monograph Series 44) [Google Scholar]
- 29.Wayne RK. Molecular evolution of the dog family. Trends Genet. 1993;9:218–224. doi: 10.1016/0168-9525(93)90122-x. [DOI] [PubMed] [Google Scholar]
- 30.Bardeleben C, et al. A molecular phylogeny of the Canidae based on six nuclear loci. Mol. Phylogenet. Evol. 2005;37:815–831. doi: 10.1016/j.ympev.2005.07.019. [DOI] [PubMed] [Google Scholar]
- 31.Smith KK. Time’s arrow: Heterochrony and the evolution of development. Int. J. Dev. Biol. 2003;47:613–621. [PubMed] [Google Scholar]
- 32.Hall BK. Evo-Devo: Evolutionary developmental mechanisms. Int. J. Dev. Biol. 2003;47:491–495. [PubMed] [Google Scholar]
- 33.Wayne R. Consequences of domestication: morphological diversity of the dog. In: Ruvinsky A, Sampson J, editors. The Genetics of the Dog. CABI; 2001. pp. 15–43. [Google Scholar]
- 34.Frank LG, et al. Fatal sibling aggression, precocial development, and androgens in neonatal spotted hyenas. Science. 1991;252:702–704. doi: 10.1126/science.2024122. [DOI] [PubMed] [Google Scholar]
- 35.Emerson SB, Bramble DM. Scaling, allometry, and skull design. In: Hanken J, Hall BK, editors. The Skull. Vol. 3. University of Chicago Press; 1993. pp. 384–421. The Skullpp. [Google Scholar]
- 36.Carrier DR. Invited perspective: Ontogenetic limits on locomoter performance. Physiol. Zool. 1996;69:467–488. [Google Scholar]
- 37.Wayne RK. Developmental constraints on limb growth in domestic and some wild canids. J. Zool. 1986;210:381–399. [Google Scholar]
- 38.Stockard CR. The Genetic and Endocrinic Basis for Differences in Form and Behavior. Wistar Institute of Anatomy and Biology; 1941. [Google Scholar]
- 39.American Kennel Club. The Complete Dog Book. 19th edn. Howell Book House; 1998. [Google Scholar]
- 40.Moody JA, et al. Canine history and breed clubs. In: Ostrander EA, et al., editors. The Dog and its Genome. Cold Spring Harbor Laboratory Press; 2006. pp. 1–18. (Cold Spring Harbor Monograph Series 44) [Google Scholar]
- 41.Trut LN. Experimental studies of early canid domestication. In: Ruvinsky A, Sampson J, editors. The Genetics of the Dog. CABI; 2001. pp. 15–43. [Google Scholar]
- 42.Ostrander EA, Kruglyak L. Unleashing the canine genome. Genome Res. 2000;10:1271–1274. doi: 10.1101/gr.155900. [DOI] [PubMed] [Google Scholar]
- 43.Fondon JW, Garner HR. Molecular origins of rapid and continuous morphological evolution. Proc. Natl. Acad. Sci. U. S. A. 2004;101:18058–18063. doi: 10.1073/pnas.0408118101. [DOI] [PMC free article] [PubMed] [Google Scholar]
- 44.Li Y, et al. Microsatellites within genes: Structure, function, and evolution. Mol. Biol. Evol. 2004;21:991–1007. doi: 10.1093/molbev/msh073. [DOI] [PubMed] [Google Scholar]
- 45.Sutter NB, Ostrander EA. Dog star rising: The canine genetic system. Nat. Rev. Genet. 2004;5:900–910. doi: 10.1038/nrg1492. [DOI] [PubMed] [Google Scholar]
- 46.Ellegren H. Microsatellite mutations in the germline: Implications for evolutionary inference. Trends Genet. 2000;16:551–558. doi: 10.1016/s0168-9525(00)02139-9. [DOI] [PubMed] [Google Scholar]
- 47.Leonard JA, et al. From wild wolf to domestic dog. In: Ostrander EA, et al., editors. The Dog and its Genome. Cold Spring Harbor Laboratory Press; 2006. pp. 95–117. (Cold Spring Harbor Monograph Series 44) [Google Scholar]
- 48.Wade CM, et al. The dog genome: Sequence, evolution and haplotype structure. In: Ostrander EA, et al., editors. The Dog and its Genome. Cold Spring Harbor Laboratory Press; 2006. pp. 201–202. (Cold Spring Harbor Monograph Series 44) [Google Scholar]
- 49.Parker HG, et al. Genetic structure of the purebred domestic dog. Science. 2004;304:1160–1164. doi: 10.1126/science.1097406. [DOI] [PubMed] [Google Scholar]
- 50.Kim D. The cutting edge of fMRI and high-field fMRI. Int. Rev. Neurobiol. 2005;66:147–166. doi: 10.1016/S0074-7742(05)66005-9. [DOI] [PubMed] [Google Scholar]
- 51.International Hapmap Consortium. A haplotype map of the human genome. Nature. 2005;437:1299–1320. doi: 10.1038/nature04226. [DOI] [PMC free article] [PubMed] [Google Scholar]
- 52.Almasy L, Blangero J. Multipoint quantitative-trait linkage analysis in general pedigrees. Am. J. Hum. Genet. 1998;62:1198–1211. doi: 10.1086/301844. [DOI] [PMC free article] [PubMed] [Google Scholar]
- 53.Pratt SC, et al. Exact multipoint quantitative-trait linkage analysis in pedigrees by variance components. Am. J. Hum. Genet. 2000;66:1153–1157. doi: 10.1086/302830. [DOI] [PMC free article] [PubMed] [Google Scholar]


