Abstract
Objectives
The purpose of this study was to investigate the measurement of collagen and smooth muscle cell (SMC) content in atherosclerotic plaques using polarization-sensitive optical coherence tomography (PSOCT).
Background
A method capable of evaluating plaque collagen content and SMC density can provide a measure of the mechanical fidelity of the fibrous cap and can enable the identification of high-risk lesions. Optical coherence tomography has been demonstrated to provide cross-sectional images of tissue microstructure with a resolution of 10 µm. A recently developed technique, PSOCT measures birefringence, a material property that is elevated in tissues such as collagen and SMCs.
Methods
We acquired PSOCT images of 87 aortic plaques obtained from 20 human cadavers. Spatially averaged PSOCT birefringence, Φ, was measured and compared with plaque collagen and SMC content, quantified morphometrically by picrosirius red and smooth muscle actin staining at the corresponding locations.
Results
There was a high positive correlation between PSOCT measurements of Φ and total collagen content in all plaques (r = 0.67, p < 0.001) and in fibrous caps of necrotic core fibroatheromas (r = 0.68, p < 0.001). Polarization-sensitive optical coherence tomography measurements of Φ demonstrated a strong positive correlation with thick collagen fiber content (r = 0.76, p < 0.001) and SMC density (r = 0.74, p < 0.01).
Conclusions
Our results demonstrate that PSOCT enables the measurement of birefringence in plaques and in fibrous caps of necrotic core fibroatheromas. Given its potential to evaluate collagen content, collagen fiber thickness, and SMC density, we anticipate that PSOCT will significantly improve our ability to evaluate plaque stability in patients.
Atherosclerotic plaque rupture at the site of a necrotic core fibroatheroma (NCFA) is a frequent precursor of thrombus-mediated acute coronary events (1,2). An NCFA is composed of a fibrous cap overlying a necrotic core (3), shielding the thrombogenic core from contact with luminal blood (2). A stable fibrous cap is predominantly composed of collagen, synthesized by intimal smooth muscle cells (SMCs), which together impart mechanical integrity. The mechanisms leading to plaque instability include the proteolysis of collagen by metalloproteinases released by activated macrophages and apoptosis of intimal SMCs, which impedes collagen synthesis (4–6). Mediated by endothelial production of nitric oxide, transforming growth factor-beta, and plasmin, this dynamic imbalance between collagen synthesis and degradation causes a net reduction in collagen content and weakens the fibrous cap, which may predispose NCFAs to rupture (7). A recent study (8) suggests that increased collagenase expression yields thinner collagen fibers with disorganized fiber orientation, which may be associated with decreased mechanical stability. Because of the significance of collagen content and architecture, as well as the role of SMCs in the pathophysiology of plaque rupture, methods capable of evaluating these features could facilitate the detection of unstable lesions.
A new imaging technique, termed polarization-sensitive optical coherence tomography (PSOCT), has been developed that may enable the quantification of collagen and SMC content in atherosclerotic plaques. Optical coherence tomography (OCT) is a high-resolution (~10 µm) imaging method that has demonstrated high accuracy for the characterization of plaque microstructure, identification of thin-cap fibroatheromas, and quantification of macrophage content in vivo (9,10). Polarization-sensitive OCT enhances conventional OCT by measuring tissue birefringence (11–13), a material property that is elevated in tissues containing proteins with an ordered structure, such as organized collagen and SMC actin-myosin. A stable plaque is associated with high collagen content, thicker collagen fibers, and large numbers of SMCs. In contrast, unstable plaques likely have lower collagen content, thinner collagen fibers, and fewer SMCs (5,6,8). In this study, we investigated the relationship between PSOCT measurements of birefringence and collagen content, fiber thickness, and SMC density in atherosclerotic plaques ex vivo. Results from this work will aid in determining the suitability of this technology for providing information on these critical plaque constituents in patients.
Materials and Methods
PSOCT imaging
The fiber-optic PSOCT system used in this study provides measurements of tissue birefringence that are reproducible and independent of the polarization state of light incident on tissue, a fundamental requirement for intracoronary imaging. The technical design of our PSOCT system and the mathematical methods to generate PSOCT images have previously been described in detail (14–16). Briefly, a light from an optical light source with a center wavelength of 1,310 nm and bandwidth of 70 nm is directed via a polarization modulator to the tissue with 6 mW of incident power. The system provided an axial resolution of 10 µm and lateral resolution of 20 µm in tissue.
A total of 87 aortic plaques were randomly obtained from 20 human cadavers and imaged using PSOCT. The time between death and imaging ranged from 12 to 24 h. The specimens were cut open and placed in a phosphate-buffered saline bath maintained at 37°C during imaging. To ensure accurate registration with histopathology, the imaging site was marked with 2 India ink spots at the edges of the OCT scan. Polarization-sensitive OCT and conventional OCT images were simultaneously obtained within 1 s, and all images were 5 × 1.2 mm (2,000 tranverse pixels × 256 depth pixels).
Birefringence measurement using PSOCT
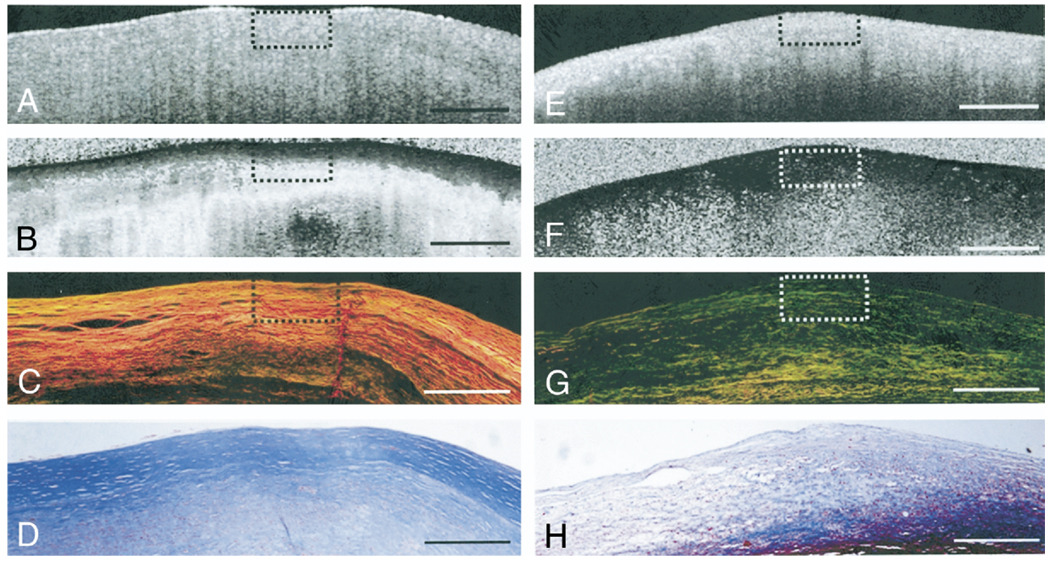
The imaging system in the current study provides both conventional OCT and PSOCT images with a single lateral scan. When light traverses birefringent tissue, light polarized along directions parallel and perpendicular to the fiber orientation of the tissue travels at different velocities, incurring a relative phase retardation, δ, which results in a change in its polarization state. The phase retardation, δ, accumulates as light travels deeper through tissue at a rate proportional to the magnitude of birefringence. To obtain a PSOCT image, mathematical techniques described in previous work (15) are used to measure Stokes parameters at each depth and depth-resolved δ values are determined. The accumulated phase retardation, δ(L), at each depth, L, is then displayed with respect to the tissue surface as a grayscale image with black corresponding to 0° (at the tissue surface) and white to 180° (or 360°) (Figs. 1B and 1F).
Figure 1. Collagen Birefringence in Atherosclerotic Plaques.
(A and E) Optical coherence tomography images of fibrous plaques. (B) Polarization-sensitive optical coherence tomography (PSOCT) image of fibrous plaque showing high birefringence as seen by the rapid transition of the image from black to white corresponding to 0° to 180° phase retardation. (C) Picrosirius red (PSR)-stained histology section showing orange-red fibers (thicker fibers) under polarized light microscopy. (D and H) Trichrome stained histology images. (F) PSOCT image of fibrous plaque showing black region corresponding to low birefringence below the luminal surface. (G) Corresponding PSR-stained histology section showing yellow-green (thinner fibers) under polarized light microscopy. Scale bars = 500 µm.
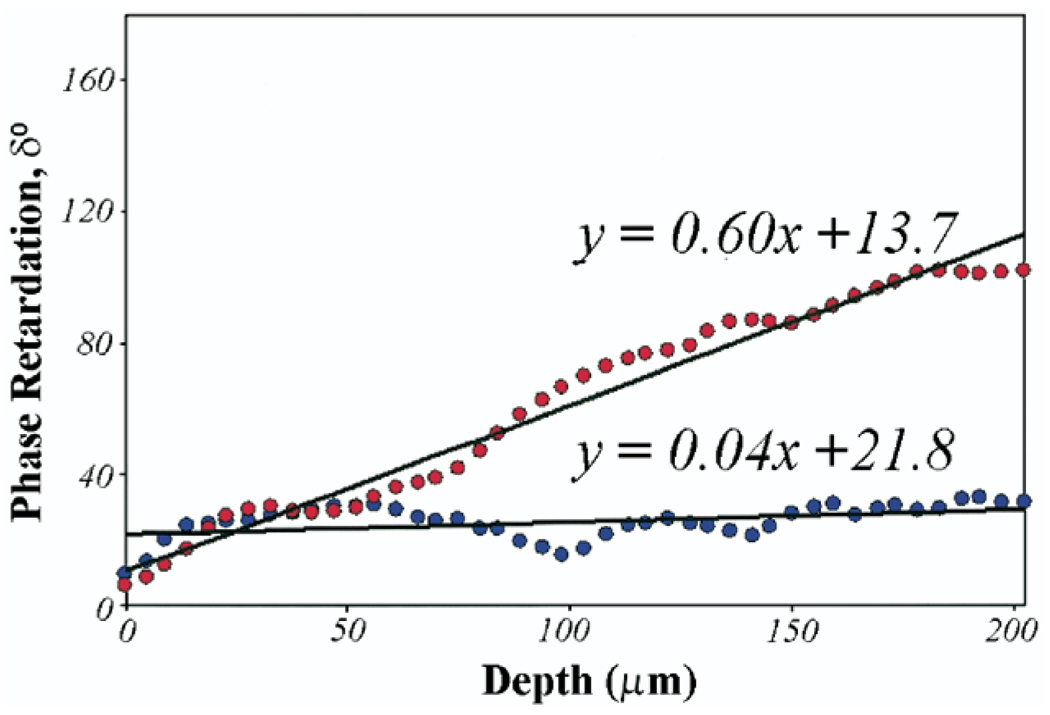
Tissue birefringence was measured within a software-selected 500 × 200 µm (tranverse × depth) region of interest (ROI) centered between the fiducial ink marks within each PSOCT image. In NCFAs, because the signal from the necrotic cores was too weak for reliable measurements (17), the depth of the ROI was matched to the average fibrous cap thickness in this plaque type. For each PSOCT image, the mean phase retardation angle, δ(L), was calculated by averaging across the width of the ROI at each depth, L. Tissue birefringence was then measured over each ROI by calculating the slope, φ= Δδ(L)/ΔL, of the linear least-squares fit through the phase retardation data over the depth (ΔL) of the ROI (Fig. 2).
Figure 2. Phase Retardation Plot.
Phase retardation, δ, angles averaged over the width of the central region of interest (500 × 200 µm) in the 2 PSOCT images shown in Figures 1B and 1F are plotted as a function of depth. Least-squares fits over a depth of 200 µm for each plot show that PSOCT birefringence measured as the slope as the phase retardation plot is higher (Φ = 0.60°/µm) for the plaque constituting 88% collagen (displayed in Figs. 1A to 1D) compared with a lower birefringence (θ = 0.04°/µm) for the plaque with depleted collagen (displayed in Figs. 1E to 1H). Abbreviations as in Figure 1.
Histopathologic analysis of atherosclerotic plaque
Following imaging, the specimens were fixed in 10% formalin and processed using standard techniques. Sections were cut across the India ink marks; stained with hematoxylin-eosin, trichrome, picrosirius red (PSR) for collagen, and alpha-smooth muscle actin for SMCs; and interpreted by a pathologist (G.J.T.). The histologic sections were characterized into the following groups (3): NCFA, non-necrotic FA, intimal hyperplasia, fibrous plaque, and fibrocalcific (FC) plaque. Fibrous plaques were classified as collagen and/or SMC-rich lesions without lipid accumulation. Non-necrotic FAs were distinguished as lesions having dispersed extracellular lipid without evidence of necrosis within the fibrous matrix.
Collagen content was measured morphometrically using digitized circularly polarized light microscopy images of PSR-stained sections within a software-selected 500 × 200 µm ROI centered between the ink marks (8,18). Because mechanical stability of the plaque may also depend on collagen fiber thickness, morphometric differentiation between thicker (orange-red) and thinner (yellow-green) collagen fibers was conducted (19,20). A hue saturation value color coordinate transformation was performed, and color separation of thick and thin collagen fibers was achieved by dividing the number of hue values within a range corresponding to orange-red (thick fibers) and yellow-green (thin fibers) by the total pixel area of the ROI (20,21). Total collagen content was computed by summing the percentage of orange-red and yellow-green fibers within the ROI. Smooth muscle cell content was measured using digitized immunohistochemistry sections stained for alpha-smooth muscle actin, and the percent staining within the ROI was calculated using automated bimodal histogram thresholding and image segmentation (22).
Statistical analysis
Multiple regression analysis was performed to test the relationship between PSOCT birefringence, Φ, with histologic measurements of thick collagen fiber, thin collagen fiber, and SMC content using stepwise regression. The correlation of PSOCT birefringence, Φ, with each independent variable was also computed using linear regression analysis. For all analyses, a p value <0.05 was considered statistically significant. All statistical analyses were performed using MicroCal Origin (MicroCal Software Inc., Northampton, Massachusetts).
Results
Histopathology
The aortic specimens were histologically classified as NCFA (n = 22), fibrous (n = 25), FA (n = 23), FC (n = 5), and intimal hyperplasia (n = 12). Two of 5 FC plaques showed histologic evidence of calcific nodules close to the luminal surface, resulting in tearing during histologic processing, and were eliminated from analysis. Because the intimal hyperplasia group did not represent discrete atherosclerotic lesions (3), this group was not included in the analysis. Following exclusion of these plaques, the dataset consisted of 73 atherosclerotic plaques.
Collagen birefringence
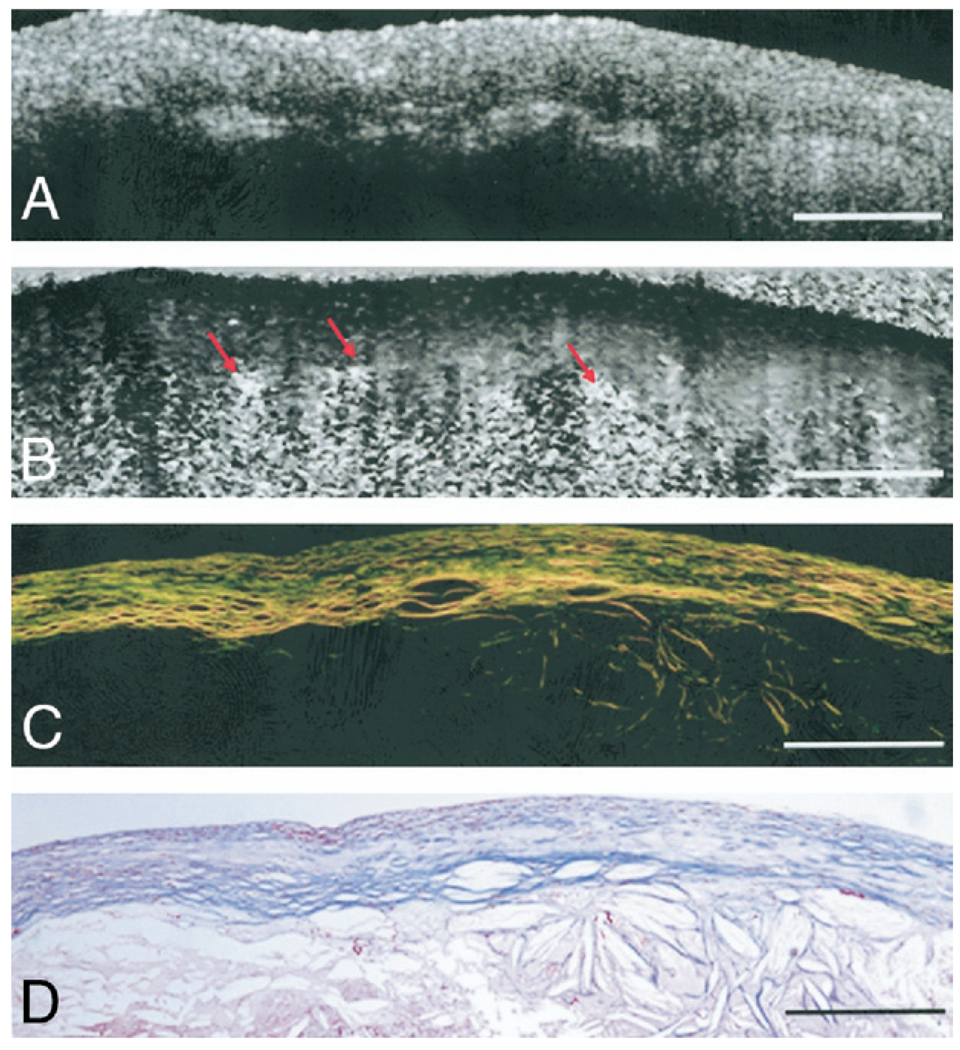
Figure 1 shows illustrative PSOCT images with the corresponding histopathology of 2 atherosclerotic plaques. The fibrous plaque in Figures 1A to 1D shows abundant thicker (orange-red in Fig. 1C) collagen fibers, constituting 88% of the ROI. In the corresponding PSOCT image (Fig. 1B), the presence of these highly birefringent collagen fibers causes a sharp transition from black (δ = 0°) at the tissue surface to white (δ = 180°). The fibroatheroma in Figures 1E to 1H shows evidence of depleted collagen constituting 20% of the ROI, with small amounts of thin collagen fibers (yellow-green in Fig. 1G). Low birefringence in PSOCT presents as a black region corresponding to low δ (Fig. 1F). In Figure 2, δ values averaged over the width of the central ROI in the two PSOCT images shown in Figures 1B and 1F are plotted as a function of depth. The δ value remains low at the surface and increases at different rates with depth. Least-squares fits over a depth of 200 µm for each plot indicate that for the highly birefringent fibrous plaque constituting 88% collagen (Figs. 1A to 1D), δ(L) increases at a rate of Φ = 0.60°/µm, compared with a significantly lower rate of Φ = 0.04°/µm in the plaque constituting 20% collagen (Figs. 1E to 1H). Figure 3 shows illustrative PSOCT images of a NCFA with the corresponding histology sections. The OCT image in Figure 3A shows a signal-poor lipid pool with poorly delineated borders beneath a signal-rich band corresponding to the fibrous cap. Birefringence of the fibrous cap is seen in the PSOCT image (Fig. 3B) as a transition from black at the surface to gray. Beneath the fibrous cap, the necrotic core appears noisy because low signal from the lipid pool causes PSOCT measurements of δ to be unreliable in this region.
Figure 3. Birefringence in an NCFA.
(A) Optical coherence tomography image of a necrotic core fibroatheroma (NCFA). (B) Corresponding PSOCT image showing birefringence within the fibrous cap overlying a region of the lipid pool. Cholesterol crystals shown by arrows appear birefringent below the fibrous cap. (C) Corresponding PSR-stained image of the NCFA showing collagen birefringence within the fibrous cap. (D) Trichrome-stained histology. Scale bars = 500 µm. Abbreviations as in Figure 1.
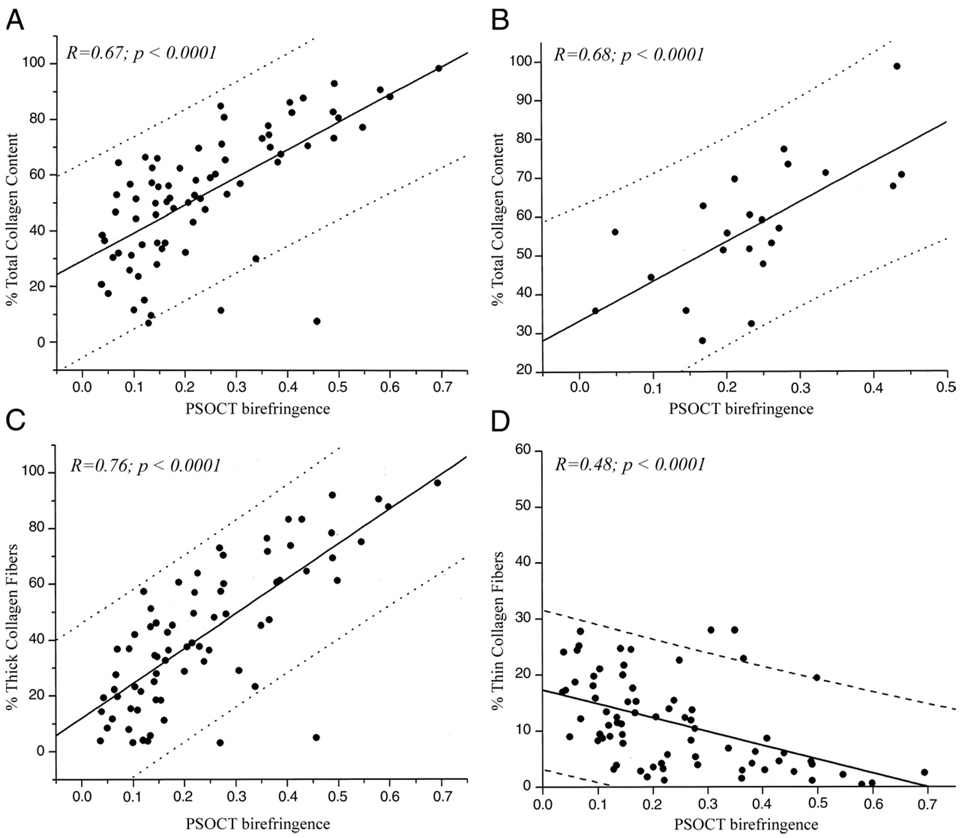
Total collagen content morphometrically measured from polarized light microscopy of PSR-stained sections ranged from 2% to 99% for all plaques. In Figure 4A, total collagen content (thick fibers + thin fibers) is plotted against Φ for the 73 atherosclerotic plaques. Linear regression analysis showed good correlation between total collagen content and PSOCT measurements (r = 0.67, p < 0.0001). Twenty-two atherosclerotic plaques that were histologically classified as NCFAs had average cap thicknesses ranging from 75 to 490 µm, and the minimum cap thickness ranged from 26 to 215 µm. Linear regression analysis showed good correlation between total collagen content and Φ in fibrous caps of NCFAs (r = 0.68, p < 0.001) (Fig. 4B).
Figure 4. Relation Between Collagen Content and PSOCT Birefringence, Φ.
(A) High positive correlation is demonstrated between Φ and total collagen content in all plaques (r = 0.67, p < 0.0001). (B) High positive correlation is demonstrated between Φ and total collagen content in fibrous caps of NCFAs (r = 0.68, p < 0.001). (C) Strong positive correlation is demonstrated between Φ and thick collagen fiber content (r = 0.76, p < 0.0001). (D) An inverse relationship is demonstrated between Φ and thin collagen fiber content (r = −0.48, p < 0.0001). The dotted lines show 95% prediction intervals. Abbreviations as in Figure 1 and Figure 3.
Multiple regression analysis performed to evaluate the cumulative relationships between collagen and SMC content with PSOCT birefringence showed that when the variables thick collagen fiber and thin collagen fiber content were considered jointly in the multiple regression model, both variables demonstrated a statistically significant relationship with Φ (thick collagen fibers, p < 0.0001, and thin collagen fibers, p < 0.05). In Figures 4C and 4D, Φ is plotted versus thick and thin collagen fiber content, respectively. Linear regression analysis demonstrated a high positive correlation between thick collagen fiber content and Φ (r = 0.76, p < 0.0004) and an inverse relationship between thin collagen fiber content and Φ (r = −0.48, p < 0.0001).
SMC birefringence
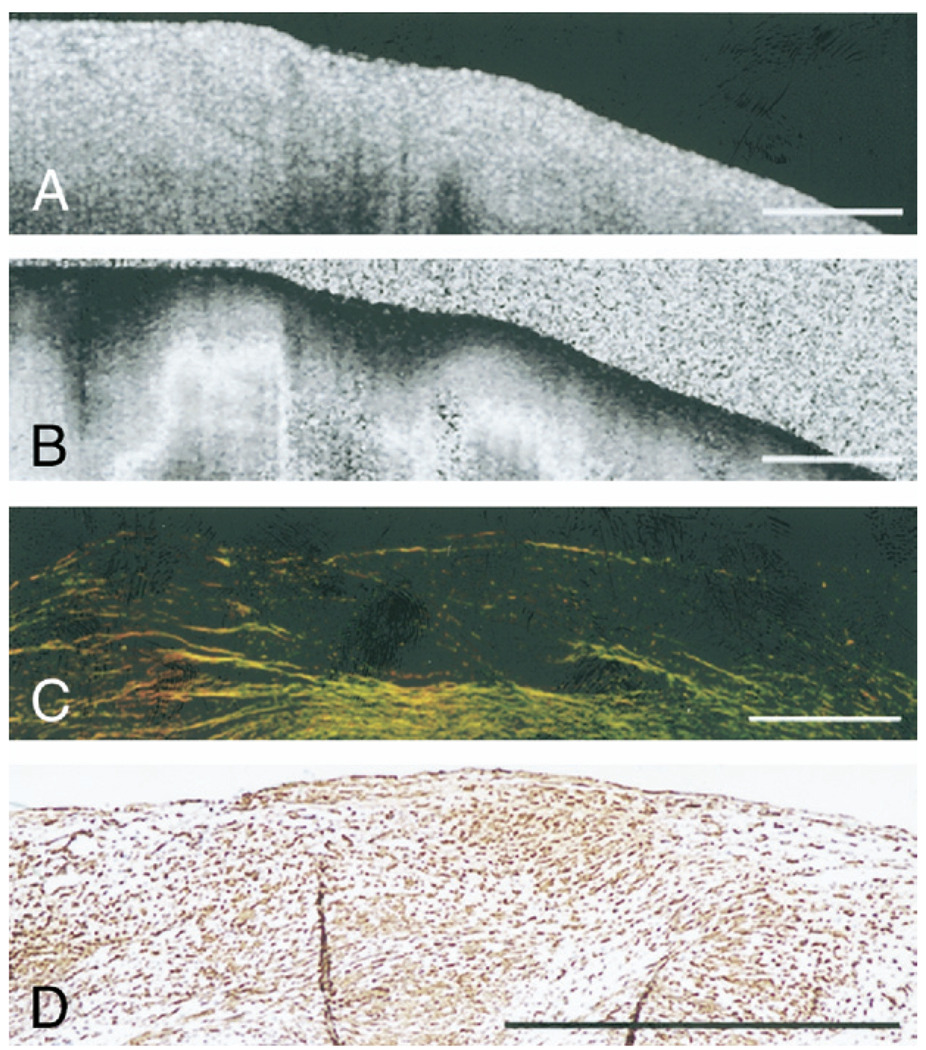
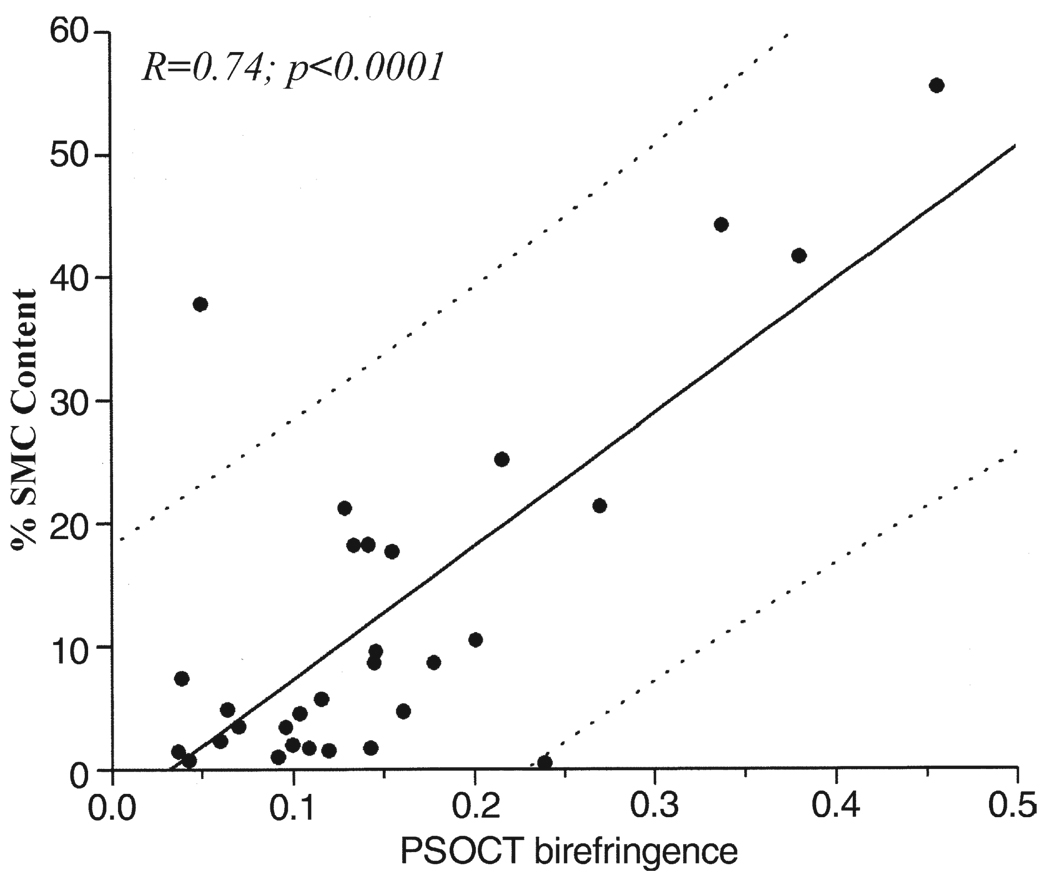
Figure 5 illustrates a fibrous plaque with low collagen content (~7%) (Fig. 5C); however, the corresponding PSOCT image (Fig. 5B) shows a rapid transition from black to white, indicating high birefringence. The accompanying immunohistology section shows extensive alpha-smooth muscle actin staining, confirming the presence of SMCs constituting 55% of the ROI (Fig. 5D), with Φ = 0.46°/µm. The results of the multiple regression analysis showed that SMC content, when incorporated in the model jointly with collagen content, did not demonstrate a statistically significant relationship with Φ (p < 0.25). When SMC content was considered individually using linear regression analysis, we found a statistically significant correlation between SMC content and Φ (r = 0.34, p < 0.01). To evaluate the relationship between SMC content and Φ, independent of collagen content, we analyzed plaques with low collagen content (<50% of the ROI: n = 30 plaques). For these plaques, SMC content showed high correlation with Φ (r = 0.74, p < 0.01) (Fig. 6).
Figure 5. SMC Birefringence in Atherosclerotic Plaques.
(A) Optical coherence tomography image of a fibrous plaque. (B) Corresponding PSOCT image showing high birefringence. (C) Corresponding PSR-stained section shows low collagen content in the plaque under polarized light microscopy. (D) Corresponding histology section stained for alpha-smooth muscle actin shows numerous smooth muscle cells (SMCs) within the fibrous plaque. Scale bars = 500 µm. Abbreviations as in Figure 1.
Figure 6. Relation Between SMC Content and PSOCT Birefringence.
High positive correlation between Φ and intimal smooth muscle cell (SMC) content is demonstrated in plaques with low (<50%) collagen content (r = 0.74, p < 0.001). The dotted lines show 95% prediction intervals. Abbreviations as in Figure 1.
Discussion
Collagen and SMCs play a key role in determining plaque stability. Pathologic studies demonstrate that the site of a thrombosed plaque often shows a fibrous cap with diminished collagen content (23–26). The overexpression of collagenases alters the mechanical properties further by yielding thinner, disorganized collagen fibers (8). Smooth muscle cells in plaques synthesize collagen, and their migration and proliferation from the media to the site of an intimal lesion is associated with a net increase in collagen, consequently stabilizing the plaque (5). The depletion of intimal SMCs may predispose a plaque to rupture, and plaques associated with unstable angina show increased SMC apoptosis (4,5).
In this study, we measured tissue birefringence from PSOCT images of human atherosclerotic plaques. The PSOCT birefringence, Φ, was highly related to total collagen content in all atherosclerotic plaques, as well as in fibrous caps of NCFAs. Φ also demonstrated a strong positive correlation with thick collagen fiber content and a negative correlation with thin collagen fiber content. The inverse relationship between Φ and thin collagen fibers may be explained by the replacement of highly birefringent, thick organized fibers by thin, more randomly oriented fibers. In support of this hypothesis, we found an inverse relationship between thick and thin collagen fibers. Studies have shown that PSOCT measurements of birefringence are influenced by collagen fiber organization; Φ is low when collagen fibers are less organized and high when fibers are well organized (27). Recent work in animals suggests that thicker collagen fibers in intimal lesions are more aligned and circumferentially oriented than thinner collagen fibers, which show increased structural disorganization (8). This difference in fiber organization of thick and thin collagen fibers is, therefore, a plausible explanation for our findings that PSOCT birefringence was related positively with thick collagen content and inversely with thin collagen fiber content. We also found that fibrous cap thickness in NCFAs did not bear a statistically significant relationship with PSOCT birefringence (p = 0.81), suggesting that the birefringence measured from PSOCT images may be independent of fibrous cap thickness.
Birefringence exhibited by intimal SMCs may be attributed to their structural construct, comprising a myosin containing thick filament co-assembled with an actin-containing thin filament (28). The results of our multiple regression analysis showed that when considered jointly with collagen content, SMC content did not demonstrate a significant relationship with Φ. Because plaques in our dataset contained both collagen and SMCs, and because of the strong positive correlation of thick collagen fibers with Φ, it is possible that the variable SMC content dropped out of the multiple regression model. However, when plaques with low collagen content were analyzed separately, Φ showed high positive correlation with SMC content, demonstrating that PSOCT measures birefringence exhibited by SMCs. Previous work has shown that the normalized standard deviation calculated within OCT images is highly correlated with macrophage content (29). In a separate analysis, we found a statistically significant inverse correlation (r = −0.6, p < 0.005) between the normalized standard deviation computed from OCT images within fibrous caps of NCFAs and Φ in this study. This inverse relationship may be explained by the possible depletion of collagen by metalloproteinases associated with increased numbers of macrophages. In support of this hypothesis, we found a similar inverse relationship between cap collagen content and OCT-normalized standard deviation (r = 0.56, p < 0.01). Taken together, our results indicate that PSOCT birefringence may provide a powerful new index related to plaque stability. Because increased birefringence was correlated to abundant thick collagen fibers and/or SMCs, the detection of high birefringence in PSOCT images may imply increased plaque stability. Conversely, low PSOCT birefringence may indicate compromised plaque stability owing to low collagen content, fewer thick collagen fibers, and/or reduced numbers of SMCs. In all images, phase retardation angles were averaged over the ROI to reduce measurement uncertainty at each depth and facilitate more accurate linear fits for measuring Φ. We observed a significant reduction in statistical uncertainty of depth-resolved phase retardation angles by averaging over 500 µm.
Previous studies have shown that OCT measures multiple factors contributing to plaque instability, including detecting NCFAs, measuring microstructural details such as thin fibrous caps, and identifying cholesterol crystals and quantifying macrophage content (10,17,29). Polarization-sensitive OCT images are always obtained simultaneously with conventional OCT images, providing additional measurements of birefringence related to collagen and SMC content. Thus, OCT enhanced with the capability for PSOCT imaging can identify multiple factors associated with plaque rupture to provide a more comprehensive understanding of plaque stability.
Study limitations
The effects of arterial pulsation on PSOCT measurements have not been analyzed here and warrant further investigation. However, on the basis of prior clinical studies in patients, we have observed that plaque birefringence is preserved during coronary pulsation. New technology has been developed to enable high-speed PSOCT imaging for clinical applications in the near future (30). Intimal plaque composition of aortas is quite similar to that of coronaries; however, there are significant differences in the media for the 2 arterial types. For this reason, we selected our ROIs to ensure that they were contained only within the intima, and we anticipate that our results can be generalized to coronary lesions. To minimize the influence of tissue shrinkage attributable to formaldehyde fixation and histologic processing (31) on the data, collagen and SMC content in histologic sections were measured as a percentage of the total area of the ROI. Registration of PSOCT images with corresponding histology sections was performed using fiducial ink marks at the lesion site applied on the plaque using a 26-gauge needle (450 µm); hence, we anticipate that the registration precision between PSOCT and histology was ~500 µm.
Cholesterol crystals, which appear as linear signal-rich regions, may offer another source of birefringence in PSOCT images (Fig. 3). In OCT images, cholesterol crystals can be easily distinguished from other plaque components by their linear and highly reflecting appearance. Three FC plaques in our analysis contained calcific nodules beneath the 200 µm deep ROI, and these regions of calcification were not included in the analysis. Calcific nodules did not contain enough signal for PSOCT measurements, and, therefore, the birefringence of calcifications could not be established. However, calcific nodules can be easily detected with high sensitivity in OCT images as sharply delineated regions within the plaque having signal-poor interiors (17). Likewise, birefringence in the necrotic cores of NCFAs could not be measured using PSOCT. When light enters the core, because of large variance in scattering structures in the necrotic debris the polarization state of light becomes randomized after multiple scattering events, resulting in unreliable phase retardation measurements (32) (Fig. 3). Deep within the lipid pool, the signal is greatly attenuated, and PSOCT measurements of birefringence cannot be obtained.
A recent study (13) has demonstrated a qualitative assessment of plaque collagen using OCT by displaying resulting changes in backreflected light achieved by manually altering the incident polarization state. The PSOCT system used in our current study provides a quantitative evaluation of plaque birefringence, Φ, by measuring the accumulated phase retardation as light travels through birefringent tissue. Our current system measures Φ independent of the incident polarization state of light and sample orientation, thus facilitating intracoronary imaging in patients using catheters similar to those used in conventional intracoronary OCT (9,10). A previous feasibility study has demonstrated intracoronary PSOCT in ex vivo coronary arteries using rotary scanning fiber-optic catheters identical to those used in previous clinical trials (33). The strength of this technique may be further emphasized by noting that PSOCT birefringence is measured in a cross-sectional image, allowing evaluation of discrete microanatomic structures such as fibrous caps. Natural history studies are underway to address questions regarding the role of systemic and local predictors of plaque rupture risk. If the results of these studies show that focal plaque stabilization provides clinical benefits, therapeutic intervention could be guided by information such as that provided by PSOCT, potentially improving patient outcome.
Polarization-sensitive OCT is unique in that it provides images of birefringence, which are co-registered with high-resolution cross-sectional images of plaque morphology obtained by conventional OCT. Beyond the measurement of cap thickness, PSOCT provides additional information about the composition of plaques and NCFA fibrous caps, where low birefringence likely indicates increased instability. Given the potential significance of the additional information provided by PSOCT, and its promise for intracoronary application, we anticipate that this technology will be useful for improving our understanding of the mechanisms of plaque progression and rupture and for the detection of high-risk plaques before the occurrence of an acute coronary event.
Acknowledgments
This study was funded by the Center for Integration of Medicine and Innovative Technology (CIMIT), NIH contract R01-HL076398.
Abbreviations and Acronyms
- FA
fibroatheroma
- FC
fibrocalcific
- NCFA
necrotic core fibroatheroma
- OCT
optical coherence tomography
- PSOCT
polarization-sensitive optical coherence tomography
- ROI
region of interest
- PSR
picrosirius red
- SMC
smooth muscle cell
Footnotes
Reprints Information about ordering reprints can be found online: http://content.onlinejacc.org/misc/reprints.dtl
REFERENCES
- 1.Arroyo LH, Lee RT. Mechanisms of plaque rupture: mechanical and biologic interactions. Cardiovasc Res. 1999;41:369–375. doi: 10.1016/s0008-6363(98)00308-3. [DOI] [PubMed] [Google Scholar]
- 2.Falk E, Shah PK, Fuster V. Coronary plaque disruption. Circulation. 1995;92:657–671. doi: 10.1161/01.cir.92.3.657. [DOI] [PubMed] [Google Scholar]
- 3.Virmani R, Kolodgie FD, Burke AP, Farb A, Schwartz SM. Lessons from sudden coronary death: a comprehensive morphological classification scheme for atherosclerotic lesions. Arterioscler Thromb Vasc Biol. 2000;20:1262–1275. doi: 10.1161/01.atv.20.5.1262. [DOI] [PubMed] [Google Scholar]
- 4.Bauriedel G, Hutter R, Welsch U, Bach R, Sievert H, Luderitz B. Role of smooth muscle cell death in advanced coronary primary lesions: implications for plaque instability. Cardiovasc Res. 1999;41:480–488. doi: 10.1016/s0008-6363(98)00318-6. [DOI] [PubMed] [Google Scholar]
- 5.Newby AC, Zaltsman AB. Fibrous cap formation or destruction—the critical importance of vascular smooth muscle cell proliferation, migration and matrix formation. Cardiovasc Res. 1999;41:345–360. [PubMed] [Google Scholar]
- 6.Rekhter MD, Hicks GW, Brammer DW, et al. Hypercholesterolemia causes mechanical weakening of rabbit atheroma: local collagen loss as a prerequisite of plaque rupture. Circ Res. 2000;86:101–108. doi: 10.1161/01.res.86.1.101. [DOI] [PubMed] [Google Scholar]
- 7.Slager CJ, Wentzel JJ, Gijsen FJ, et al. The role of shear stress in the destabilization of vulnerable plaques and related therapeutic implications. Nat Clin Pract Cardiovasc Med. 2005;2:456–464. doi: 10.1038/ncpcardio0298. [DOI] [PubMed] [Google Scholar]
- 8.Deguchi JO, Aikawa E, Libby P, et al. Matrix metalloproteinase-13/collagenase-3 deletion promotes collagen accumulation and organization in mouse atherosclerotic plaques. Circulation. 2005;112:2708–2715. doi: 10.1161/CIRCULATIONAHA.105.562041. [DOI] [PubMed] [Google Scholar]
- 9.Jang IK, Tearney GJ, MacNeill B, et al. In vivo characterization of coronary atherosclerotic plaque by use of optical coherence tomography. Circulation. 2005;111:1551–1555. doi: 10.1161/01.CIR.0000159354.43778.69. [DOI] [PMC free article] [PubMed] [Google Scholar]
- 10.MacNeill BD, Jang IK, Bouma BE, et al. Focal and multi-focal plaque macrophage distributions in patients with acute and stable presentations of coronary artery disease. J Am Coll Cardiol. 2004;44:972–979. doi: 10.1016/j.jacc.2004.05.066. [DOI] [PubMed] [Google Scholar]
- 11.de Boer JF, Milner TE, van Gemert MJC, Nelson JS. Two-dimensional birefringence imaging in biological tissue by polarization-sensitive optical coherence tomography. Opt Lett. 1997;22:934–936. doi: 10.1364/ol.22.000934. [DOI] [PubMed] [Google Scholar]
- 12.de Boer JF, Milner TE, Nelson JS. Determination of the depth-resolved Stokes parameters of light backscattered from turbid media by use of polarization-sensitive optical coherence tomography. Opt Lett. 1999;24:300–302. doi: 10.1364/ol.24.000300. [DOI] [PubMed] [Google Scholar]
- 13.Giattina SD, Courtney BK, Herz PR, et al. Assessment of coronary plaque collagen with polarization sensitive optical coherence tomography (PS-OCT) Int J Cardiol. 2006;107:400–409. doi: 10.1016/j.ijcard.2005.11.036. [DOI] [PubMed] [Google Scholar]
- 14.Saxer CE, de Boer JF, Park BH, Zhao Y, Zhongping C, Nelson JS. High-speed fiber-based polarization-sensitive optical coherence tomography of in vivo human skin. Opt Lett. 2000;25:1355–1357. doi: 10.1364/ol.25.001355. [DOI] [PubMed] [Google Scholar]
- 15.Park BH, Saxer C, Srinivas SM, Nelson JS, de Boer JF. In vivo burn depth determination by high-speed fiber-based polarization sensitive optical coherence tomography. J Biomed Opt. 2001;6:474–479. doi: 10.1117/1.1413208. [DOI] [PubMed] [Google Scholar]
- 16.Pierce MC, Park HB, Cense B, de Boer JF. Simultaneous intensity, birefringence, and flow measurements with high-speed fiber-based optical coherence tomography. Opt Lett. 2002;27:1534–1536. doi: 10.1364/ol.27.001534. [DOI] [PubMed] [Google Scholar]
- 17.Yabushita H, Bouma BE, Houser SL, et al. Characterization of human atherosclerosis by optical coherence tomography. Circulation. 2002;106:1640–1645. doi: 10.1161/01.cir.0000029927.92825.f6. [DOI] [PubMed] [Google Scholar]
- 18.Nadkarni SK, Bouma BE, Helg T, et al. Characterization of atherosclerotic plaques by laser speckle imaging. Circulation. 2005;112:885–892. doi: 10.1161/CIRCULATIONAHA.104.520098. [DOI] [PMC free article] [PubMed] [Google Scholar]
- 19.Cuttle L, Nataatmadja M, Fraser JF, Kempf M, Kimble RM, Hayes MT. Collagen in the scarless fetal skin wound: detection with picrosirius-polarization. Wound Repair Regen. 2005;13:198–204. doi: 10.1111/j.1067-1927.2005.130211.x. [DOI] [PubMed] [Google Scholar]
- 20.Rich L, Whittaker P. Collagen and Picrosirius Red staining: a polarized light assessment of fibrillar hue and spatial distribution. Braz J Morphol Sci. 2005;22:97–104. [Google Scholar]
- 21.Whittaker P. Polarized light microscopy in biomedical research. Microsc Analysis. 1995:15–17. [Google Scholar]
- 22.Pratt W. Digital Image Processing. 2nd ed. New York, NY: John Wiley and Sons, Inc.; 1991. [Google Scholar]
- 23.Davies MJ. Anatomic features in victims of sudden coronary death. Coronary artery pathology. Circulation. 1992;85:I19–I24. [PubMed] [Google Scholar]
- 24.van der Wal AC, Becker AE. Atherosclerotic plaque rupture—pathologic basis of plaque stability and instability. Cardiovasc Res. 1999;41:334–344. doi: 10.1016/s0008-6363(98)00276-4. [DOI] [PubMed] [Google Scholar]
- 25.Sukhova GK, Schonbeck U, Rabkin E, et al. Evidence for increased collagenolysis by interstitial collagenases-1 and -3 in vulnerable human atheromatous plaques. Circulation. 1999;99:2503–2509. doi: 10.1161/01.cir.99.19.2503. [DOI] [PubMed] [Google Scholar]
- 26.Shah PK, Falk E, Badimon JJ, et al. Human monocyte-derived macrophages induce collagen breakdown in fibrous caps of atherosclerotic plaques. Potential role of matrix-degrading metalloproteinases and implications for plaque rupture. Circulation. 1995;92:1565–1569. [PubMed] [Google Scholar]
- 27.Drexler W, Stamper D, Jesser C, et al. Correlation of collagen organization with polarization sensitive imaging of in vitro cartilage: implications for osteoarthritis. J Rheumatol. 2001;28:1311–1318. [PubMed] [Google Scholar]
- 28.Godfraind-De Becker A, Gillis JM. Polarized light microscopy of the smooth muscle anococcygeus of the rat. Adv Exp Med Biol. 1988;226:149–154. [PubMed] [Google Scholar]
- 29.Tearney GJ, Yabushita H, Houser SL, et al. Quantification of macrophage content in atherosclerotic plaques by optical coherence tomography. Circulation. 2003;107:113–119. doi: 10.1161/01.cir.0000044384.41037.43. [DOI] [PubMed] [Google Scholar]
- 30.Park BH, Pierce MC, Cense B, et al. Real-time fiber-based multi-functional spectral domain optical coherence tomography at 1.3um. Opt Express. 2005;13:3931–3944. doi: 10.1364/opex.13.003931. [DOI] [PubMed] [Google Scholar]
- 31.Dobrin PB. Effect of histologic preparation on the cross-sectional area of arterial rings. J Surg Res. 1996;61:413–415. doi: 10.1006/jsre.1996.0138. [DOI] [PubMed] [Google Scholar]
- 32.de Boer JF, Milner TE. Review of polarization sensitive optical coherence tomography and Stokes vector determination. J Biomed Opt. 2002;7:359–371. doi: 10.1117/1.1483879. [DOI] [PubMed] [Google Scholar]
- 33.Pierce MC, Shishkov M, Park BH, et al. Effects of sample arm motion in endoscopic polarization-sensitive optical coherence tomography. Opt Express. 2005;13:5739–5749. doi: 10.1364/opex.13.005739. [DOI] [PubMed] [Google Scholar]


