Abstract
Full-field optical coherence microscopy (FFOCM) utilizes coherence gating to obtain high-resolution optical sections in thick tissues. FFOCM is an attractive technology for endoscopic microscopy at the cellular level since it does not require a high NA objective lens or beam scanning and is therefore particularly amenable to miniaturization. In this manuscript, we present a novel scheme for conducting FFOCM that utilizes spectrally modulated, spatially incoherent illumination and a static Linnik interferometer. This approach is advantageous for endoscopic microscopy since it allows FFOCM to be conducted through a single multimode fiber optic imaging bundle and does not require moving parts in the endoscope probe. Images acquired from biological samples in free space demonstrate that this new method provides the same detailed microscopic structure as that of conventional FFOCM. High-resolution images were also obtained through a multimode fiber bundle, further supporting the potential of this method for endoscopic microscopy.
1. Introduction
Endoscopic imaging at the subcellular level has a wide variety of potential clinical applications, including the early detection of dysplasia/cancer within internal organ systems. Imaging modalities that make use of endogenous contrast, such as reflectance confocal microscopy (CM) [1,2] and optical coherence tomography (OCT) [3,4] show great promise for endoscopic microscopy. However, both techniques have technical requirements that make endoscopic subcellular imaging difficult. Optical coherence tomography can provide high axial resolution, but the transverse resolution must be kept low (~30 µm) in order to maintain the large depth of focus that is required for cross-sectional imaging. Confocal microscopy can provide images in human tissue with 1 µm transverse resolution [1], but achieving high axial resolution requires the use of high-NA objectives (typically NA ≥ 0.7) that are difficult to miniaturize. Additionally, confocal microscopy requires rapid beam scanning mechanisms that can be challenging to integrate within small diameter endoscopic probes.
Bocarra et al. [5], demonstrated that implementing OCT with a light source having both low temporal coherence and low spatial coherence can provide high resolution in three-dimensions with relatively low-NA lenses and without requiring rapid beam scanning[6,7]. This approach, known as full-field optical coherence microscopy (FFOCM), has generated striking images of subcellular structure in biological tissues [8–10]. The implementation of FFOCM through an endoscope, however, imposes additional design constraints that must be addressed. First, it is difficult to place the entire interferometer setup, including the source and the camera, at the distal tip of the probe. Fiber-optic illumination and fiber bundle imaging are therefore desired. In order to avoid difficulties in matching reference and sample arm spatial coherence, path length, dispersion, and polarization, the interferometer should be present at the distal end of the fiber imaging bundle so that the reference and sample arm light passes through the same bundle. Finally, most FFOCM systems modulate the path length of the reference arm by a piezoelectric transducer in order to acquire out-of-phase interference fringes and reconstruct an optical section [6]. A more attractive endoscopic device would contain no moving parts. In this paper, we present an FFOCM scheme for endoscopic microscopy that addresses these issues by using a spectrally modulated source and a passive Linnik interferometer at the distal end of a multimode fiber bundle.
2. System configuration
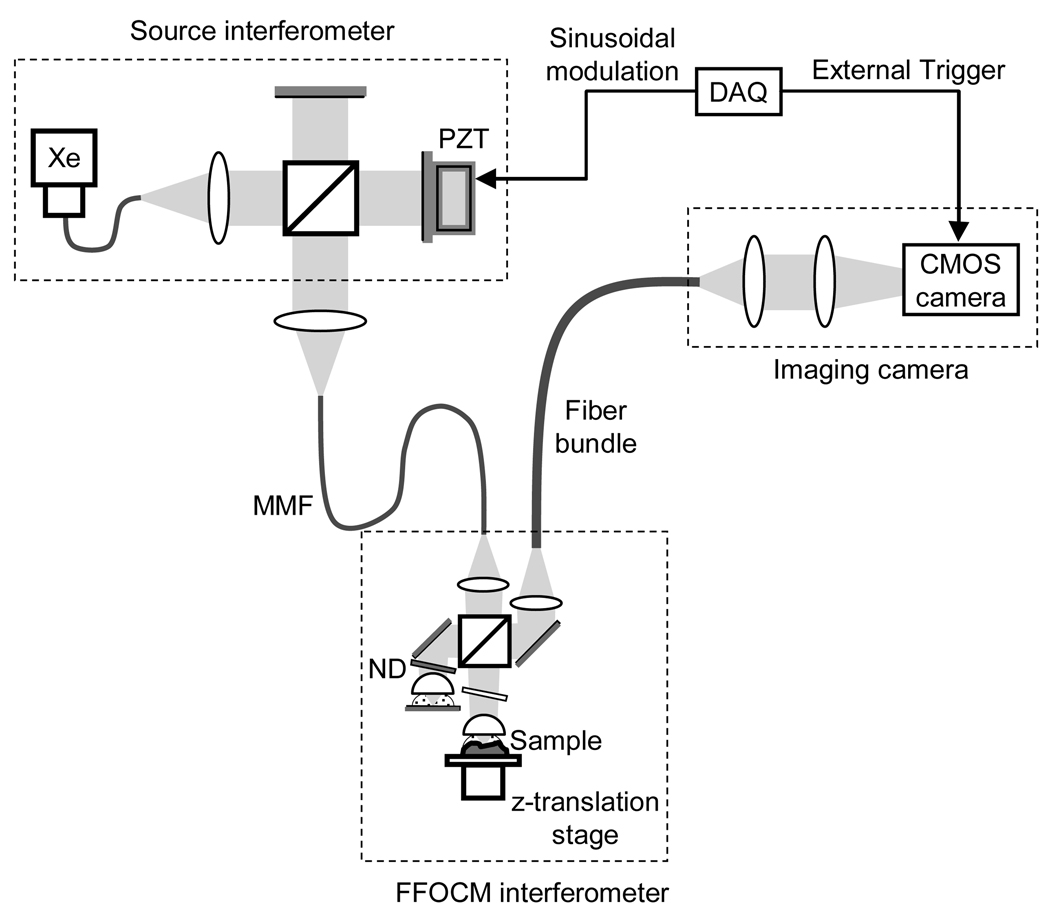
The FFOCM system (Fig. 1) comprised two separate interferometers. Light from a xenon arc lamp (Oriel 6263) was spectrally modulated in a Michelson interferometer (source interferometer) prior to illuminating a conventional Linnik FFOCM interferometer. By controlling the source interferometer path length with a piezoelectric transducer and analog I/O board (DAQ), interference fringes of variable frequency could be induced on the source spectrum. We will demonstrate that these fringes can be used to acquire in-phase and out-of-phase images as an alternative to the conventional approach of modulating the path length of the FFOCM interferometer. Light from the source interferometer was transmitted to the input port of the FFOCM interferometer by a multi-mode fiber (1.0 mm diameter, Oriel 77519) and the path length difference in each interferometer was adjusted to 600 µm. The sample and reference arms of the FFOCM interferometer were terminated by two identical water-immersion microscope objective lenses (Olympus 10×, 0.3 NA in water, working distance 3 mm). In order to obtain three-dimensional images, the sample was scanned by a computer-controlled translation stage (Picomotor 8302, New Focus). A neutral density (ND) filter attenuated the intensity of the FFOCM interferometer’s reference arm light, and a glass plate was inserted in the sample arm to compensate the dispersion of the neutral density filter. Interference images, generated by four beam interference through the two coupled interferometers, were transmitted to a high speed CMOS area scan camera (Dalsa 1M150, 1024 × 1024 pixels, 8 bits, 150 Hz, full well capacity 200,000 e−) either through free-space or a leached-type coherent multimode fiber optic bundle (Schott, 1.93 mm diameter, diameter of individual fiber 12.7 µm, 17,000 pixels, 0.4 NA, 1.76 m length). Image acquisition was synchronized to the piezoelectric transducer by the DAQ clock signal.
Fig. 1.
Schematic of the experimental setup. Xe, xenon arc lamp; ND, neutral density filter; GP, glass plate; MMF, multi-mode fiber; DAQ, data acquisition board in computer.
Assuming a Gaussian source spectrum and using a sinusoidal phase modulation in the source interferometer, the interference signal acquired by the camera can be expressed as:
| (1) |
where L denotes the path length difference between the arms of the source interferometer, δl and f are the path length, I0 (x, y) is the average intensity, A (x, y) represents the amplitude of the OCM interference signal, and ϕ (x, y) represents the total phase shift induced by the sample. Two images were acquired over a source interferometer spectral modulation period of π radians. The optically sectioned image data was obtained by squaring the difference of the two images [9].
In order to obtain the optical section, the source interferometer path length difference was matched to the path length difference of the FFOCM interferometer. However, the coherence gated interference signal was detected from two conjugate depth positions in the FFOCM interferometer sample arm, z = L and z = −L, where 2L was the path length difference in the source interferometer. As there could only be one focus, we positioned it at either z = L or z = −L. In addition, since we were interested in detecting sample arm light only from the focus, we selected a sufficiently large L so that the unwanted signal from the conjugate depth position was minimized. When the light at sample arm is focused at z = L,
| (2) |
with L >> δl and κδl < 1. The processed image is given by
| (3) |
In order to optimize spectral fringe contrast and SNR, the modulation amplitude and phase were adjusted to maximize the processed signal. For our system, we found that Γ = Γmax ≈ 0.62 when 2k0δl ≈ 1.98 and θ = 0. Assuming that the well of each camera pixel is full upon maximum illumination, and neglecting the relative intensity noise (RIN), it can be shown that the system SNR is given by [6,10]:
| (4) |
where N is the number of image accumulations, Rr is the reflectance of the reference mirror, Rs is the sample reflectance, Rinc is the portion of incoherent light remitted from the sample, ξmax is the full-well-depth (FWD) per camera pixel, and η is the noise-equivalent electrons (NEE) representing total electrical noise [10]. The sensitivity of the system defined by the minimum detectable reflectance (SNR = 2) can be expressed as:
| (5) |
It should be noted that our SNR is 6 dB lower than that of a conventional FFOCM system [9]. A loss of 6 dB is incurred because interference is detected from one out of two possible positions within the sample (either z = L or z = −L), thereby reducing the intensity of the interferometric signal by a factor of two.
3. Free space spectrally-modulated FFOCM imaging
In order to evaluate the source spectral modulation principle, we first conducted imaging in free space without the fiber optic imaging bundle. Single image frames containing 512 × 512 pixels were captured at the speed of 200 frames per second (fps). The maximum exposure time at this frame rate was 3.3 ms. The field of view (FOV) was approximately 680 µm × 680 µm. The lateral resolution in water, measured from the full-width-half-maximum (FWHM) of the derivative of the edge response function [11,12] was 2.0 µm, which was limited by the camera pixel resolution. We measured an axial plane response resolution (FWHM) of 1.1 µm by translating a mirror through the focus. By carefully aligning the source interferometer, we achieved a source spectral modulation with approximately 80% fringe visibility through the illumination multi-mode fiber. With 2% reference arm reflectance and a −54 dB sample reflector, the sensitivity of the system was measured to be 81.5 dB (N = 200). This value was approximately 1.9 dB lower than the theoretical sensitivity (ξmax = 200,000 and η = 300), which can be attributed to the incomplete source interferometer spectral fringe visibility (~80%) and losses in the sample arm optics. Since the CMOS pixel full-well depth was filled when the sum of sample and reference arm reflectances were ~2.0%, and the amount of incoherent light typically coming back from scattering samples, Rinc, is approximately 1% [8], the reference mirror reflectance was set to Rr = 1.0% for biological tissue imaging. For these parameters, a sensitivity of ~ 78.5 dB was expected (N = 200).
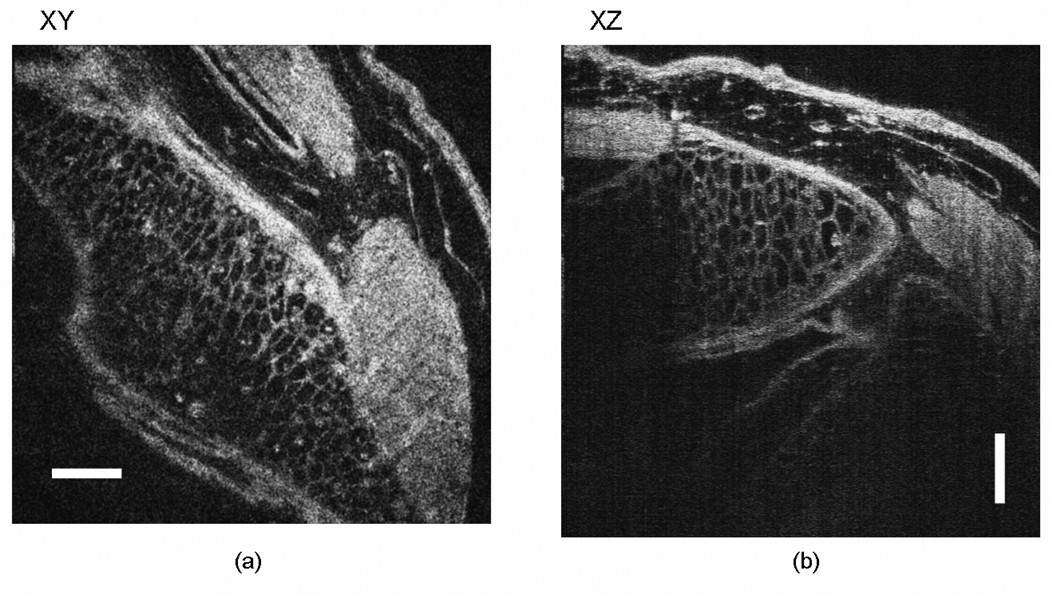
Figure 2 depicts images of a Xenopus laevis embryo, obtained ex vivo with our FFOCM system. An embryo (stage 49 according to Nieuwkoop and Faber tables) fixed in MEMFA (0.1M MOPS [pH7.4], 2mM EGTA, 1mM MgSO4 and 3.7% formaldehyde) for approximately one hour was positioned with the ventral surface up in a petri dish. The whole embryo was covered with 1 × PBS (phosphate-buffered saline), which served as the immersion medium for the microscope objective [10]. A three-dimensional data set with a volume of 680 µm × 680 µm × 700 µm was acquired with 1.0 µm axial steps. A total of 200 images were accumulated to construct a single en face image; the acquisition time per FFOCM image was therefore 2 seconds. A series of en face images of the head mesenchymal cell area, acquired from top (ventral side) to bottom (dorsal side), is presented as a movie in Fig. 2(a). A reconstructed cross-sectional image is shown in Fig. 2(b). High resolutions in all three dimensions enabled clear visualization of mesenchymal cell membranes and nuclei.
Fig. 2.
Images of head mesenchymal cells of a fixed Xenopus laevis embryo. (a) Movie of a series of en face images from ventral side (top) to dorsal side (bottom) (presented at 30 fps, smaller version: 2.5 MB, larger version: 15 MB). (b) Cross-sectional image acquired from 700 en face FFOCM images. Scale bar: 100 µm.
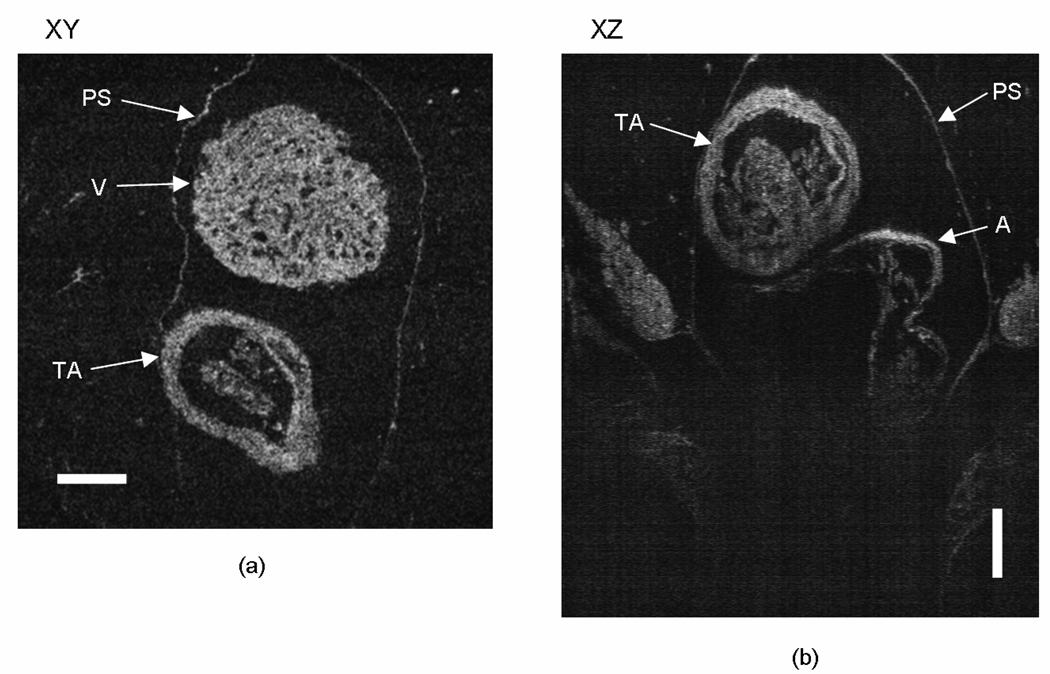
A heart of the same embryo was also imaged by our spectrally-modulated FFOCM system. The large FOV allowed imaging of the entire embryo heart, shown in Fig. 3(a) as a movie of en face image sections from the ventral to dorsal aspect of the specimen. Microscopic structures such as the pericardial sac, the truncus arteriosus, ventricle, and atrium can be clearly seen in both en face images and cross-sectional reconstructions (Fig. 3(b)).
Fig. 3.
Images of Xenopus laevis embryo heart, ex vivo. (a) Movie of a series of en face images (ventral to dorsal) (presented at 30 fps, smaller version: 2.5 MB, larger version: 15 MB). (b) Movie of a series of reconstructed cross-sectional images (anterior to posterior) (presented at 30 fps, smaller version: 1.8 MB, larger version: 11 MB). PS: pericardial sac, V: ventricle, TA: truncus arteriosus, A: atrium. Scale bar: 100 µm.
4. Multimode fiber bundle spectrally-modulated FFOCM imaging
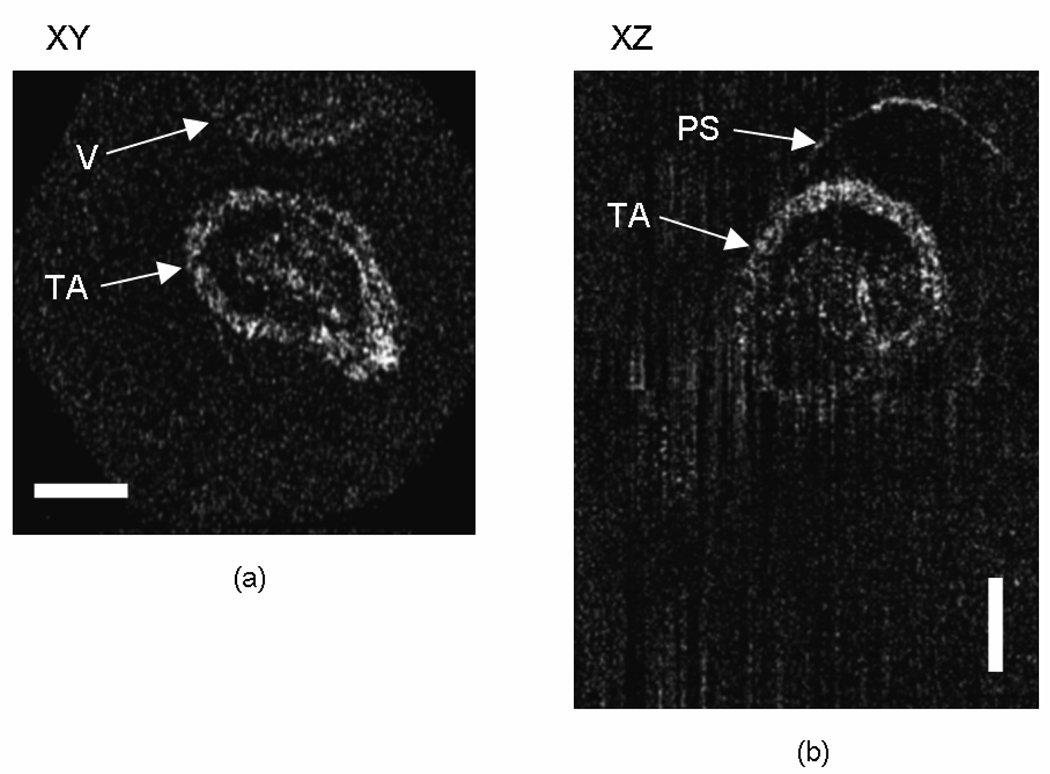
In order to take the next step towards endoscopic FFOCM, we inserted a multimode fiber optic bundle between the FFOCM interferometer and the imaging camera. Single-pass fiber bundle loss was measured to be 10 dB at the source wavelengths. To attempt to compensate for this loss, three modifications were made to the system. First, the window size of the camera was reduced to 256 × 256 pixels, which allowed ~ 33% longer exposure time, resulting in a signal gain of 1.2 dB. Second, the sample magnification was reduced by factor of ~1.47 by adjusting of the area scan camera imaging optics, producing a signal gain of ~ 3.3 dB. Finally, we increased the number of accumulated images to 800, providing an additional sensitivity gain of 6 dB. Following these modifications, we measured the sensitivity, using the same partial reflector (Rs = −54 dB) as before. To fill up the full well capacity, the reflectance of the reference arm was adjusted to 7.1%. The sensitivity was measured to be 77.4 dB (N = 800), which was ~ 4.5 dB lower than expected. We attribute the additional 4.5 dB loss to saturation of sensitivity enhancement associated with mechanical and thermal instabilities that take place during longer exposure times and greater numbers of accumulations [8] and the visibility degradation caused by the crosstalk between fiber pixels in imaging bundle, which is measured to induce approximately 1 dB sensitivity drop. Based on these measurements, we predicted that we would achieve a sensitivity of ~ 76.8 dB (Rr = 6.1%) when imaging biological samples.
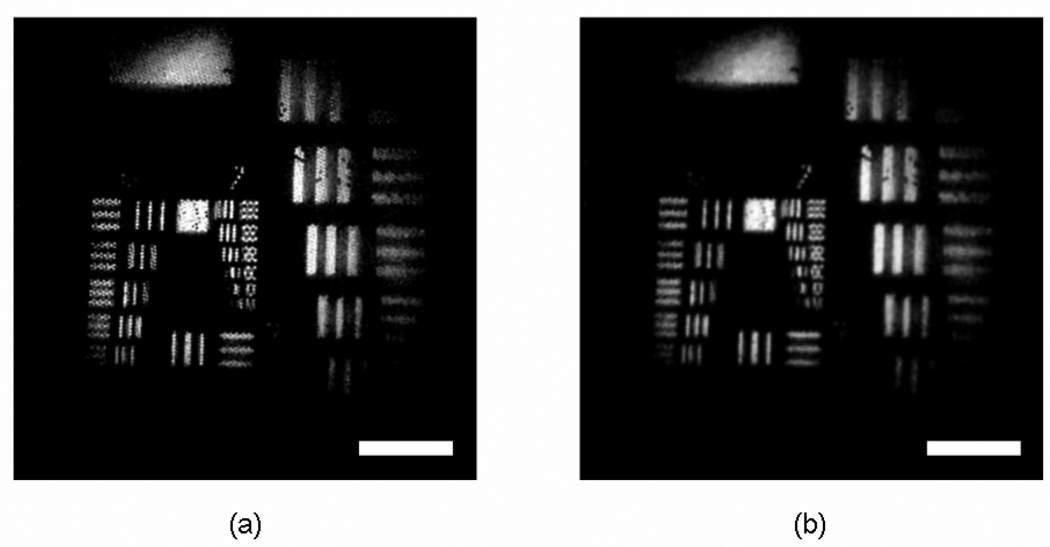
Images of a 1951 USAF resolution target, obtained through the multimode bundle, revealed a degradation of transverse resolution due to the reduced magnification and the pixilation effect of the fiber bundle (Fig. 4). Using the FWHM of the first derivative of the edge response function, we measured the transverse resolution to be 3.6 µm. By applying a disk filter (circular averaging filter) using a radius of 1 (Matlab) [13], we were able to significantly reduce the pixelation artifact while maintaining a transverse resolution of 4.1 µm.
Fig. 4.
(a) FFOCM images of 1951 USAF resolution target acquired through fiber optic bundle. (b) Image of Fig. 4a smoothed to reduce pixilation artifacts. Scale bar: 100 µm.
In order to demonstrate imaging of a biological sample, we imaged the same embryo heart of Fig. 3 (Fig. 5). A sequence of en face images acquired in 2 µm steps (ventral to dorsal) is presented as a movie in Fig. 5(a). Fig. 5(b) shows a reconstructed cross-sectional image. The FOV was 500 µm × 500 µm, and the acquisition time per image was 8 s with ~ 77 dB sensitivity (N = 800). Although the use of the multimode fiber optic bundle degraded the transverse resolution and reduced the sensitivity of the system, we could identify many of the same detailed morphologic features observed in images acquired with the free space system, including the truncus arteriosus, and ventricle, and pericardial sac (Fig. 5).
Fig. 5.
Images of Xenopus laevis embryo heart, ex vivo, obtained through a multimode fiber optic imaging bundle. (a) Movie of a series of en face images (ventral to dorsal) (presented at 15 fps, smaller version: 1.8 MB, larger version: 4.1 MB). (b) Reconstructed cross-sectional images. PS: pericardial sac, V: ventricle, TA: truncus arteriosus.. Scale bar: 100 µm.
5. Discussion
Our results demonstrate the feasibility of conducing spectrally-modulated FFOCM through a multimode fiber optic imaging bundle. Advantages of this approach include the potential for miniaturization in a flexible catheter/endoscope and the absence of moving parts in the FFOCM probe. While encouraging, several hurdles must be overcome to realize an FFOCM endoscope, including increasing imaging sensitivity/speed and the development of a small-diameter probe.
5.1. Imaging sensitivity/speed
Our current system requires 8 seconds to obtain a single en face FFOCM image with ~ 77 dB sensitivity. Due to patient motion, this frame rate is at least an order of magnitude too slow for practical clinical application. Since our imaging speed is directly related to system sensitivity, reduction of losses should be attempted by careful selection of fiber bundles with greater transmission and reduced cross-talk. Additional approaches for increasing sensitivity/speed include the use of higher power light sources and imaging cameras with higher frame rates and larger full well capacities. High power mode locked lasers and continuum sources are attractive alternatives to arc lamps and other filament-based sources commonly used in FFOCM. However, additional opto-mechanical elements may be required to make these sources spatially incoherent, which is highly beneficial in FFOCM for crosstalk reduction between imaging pixels.
5.2. Endoscope probe design
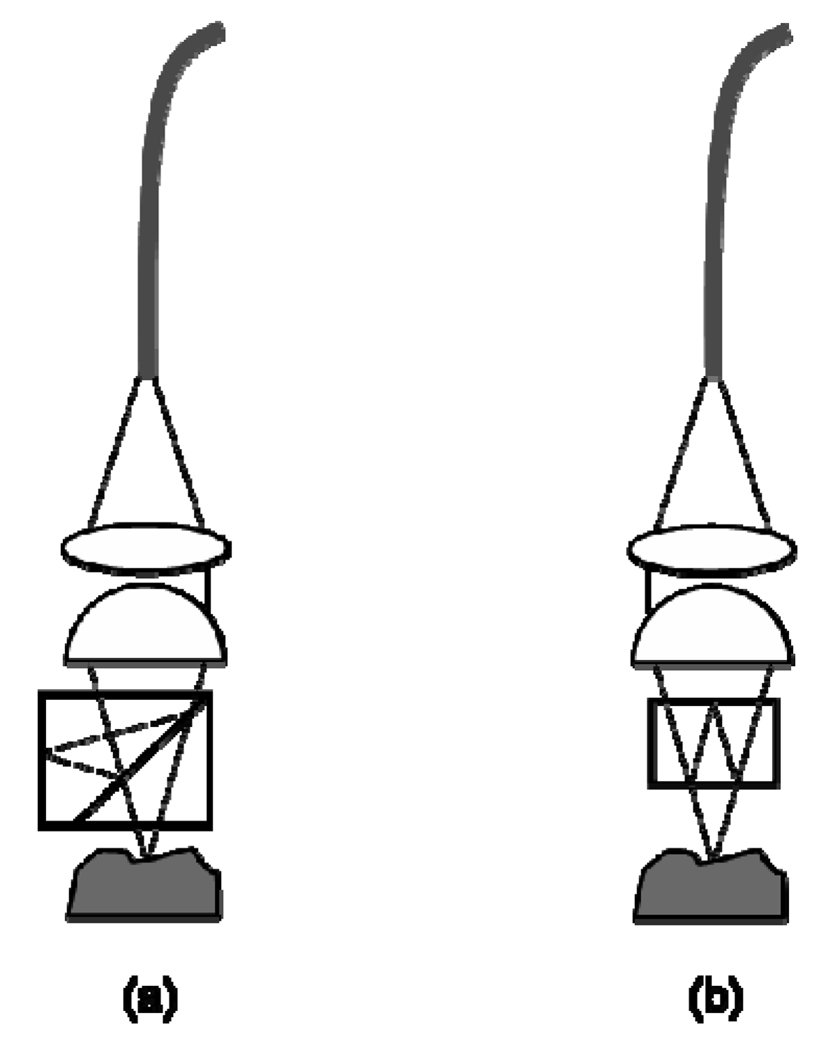
Design and fabrication of a miniature distal Linnik interferometer remains an important task that is required for eventual translation of this technique. Fortunately, since optical sectioning in FFOCM is achieved by coherence gating, low NA objective lenses (NA = 0.1 ~ 0.4) that may be easier to fabricate and miniaturize, can be utilized in endoscopic FFOCM probes. The interferometer should be also miniaturized; the FFOCM Linnik interferometer demonstrated here may not be optimal since it requires two objective lenses. A Michelson interferometer with a beam splitter positioned between the objective and sample [5], as depicted in Fig. 6(a), could be an attractive option. This design requires only one objective lens and possibly one face of the beam splitter could be utilized as the reference reflector. An additional advantage of this arrangement is its mechanical stability. Another configuration that may be suitable for endoscopic FFOCM is the Mirau interferometer [14]. As illustrated in Fig. 6(b), an etalon is inserted between the objective and sample. The etalon can serve as a beam splitter and one surface can be the reference reflector. Potential difficulties of both of these designs include unbalanced dispersion and spherical aberration [14]. These challenges may not be too difficult to overcome, however, as proper glasses can be utilized to minimize dispersion mismatch and the NA of the objective will be relatively low. In addition, since the optical sectioning (axial resolution) relies on the coherence gating in FFOCM, modest spherical aberration is not expected to affect the imaging performance significantly.
Fig. 6.
Designs for endoscopic FFOCM probe optics. (a) Michelson interferometer with a beam splitter between the objective lens and sample. (b) Mirau interferometer.
Using the fiber bundle for both illumination and detection (imaging) can further augment miniaturization. Reduction of backreflections from the fiber bundle faces is an important consideration for this design as they can easily saturate the camera. Other investigators who have employed fiber bundles for endocopic confocal microscopy have successfully addressed this issue [15,16].
6. Conclusion
FFOCM is capable of obtaining isotropic, cellular-level resolution images in tissue without beam scanning. As such, it is an excellent candidate for endoscopic microscopy of internal organ systems of living human patients. However, previously demonstrated FFOCM system designs are not amenable to endoscopic imaging due their free space operation and moving reference mirrors. In this paper, we have demonstrated a new method for FFOCM, which utilizes a spectrally modulated source and a static interferometer that may be placed at the distal end of a small diameter probe. Images of the Xenopus laevis embryo were obtained with this technique, revealing a high level of structural detail that is characteristic of the FFOCM technique. While several challenges remain, we believe this first demonstration of spectrally-modulated imaging through a multimode fiber optic bundle represents an important step toward achieving endoscopic FFOCM.
Acknowledgments
This research was supported in part by the Center for Integration of Medicine and Innovative Technology (CIMIT, development of the imaging system platform).
Footnotes
OCIS codes: (170.4500) Optical coherence tomography; (170.3880) Medical and biological imaging; (170.3890) Medical optics instrumentation; (180.3170) Interference microscopy
References and links
- 1.Rajadhyaksha M, Anderson RR, Webb RH. Video-rate confocal scanning laser microscope for imaging human tissue in vivo. Appl. Opt. 1999;38:2105–2115. doi: 10.1364/ao.38.002105. [DOI] [PubMed] [Google Scholar]
- 2.Koester CJ, Auran JD, Rosskothen HD, Florakis GJ, Tackaberry RB. Clinical microscopy of the cornea utilizing optical sectioning and high-numerical-aperture objective. J. Opt. Soc. Am. A. 1993;10:1670–1679. doi: 10.1364/josaa.10.001670. [DOI] [PubMed] [Google Scholar]
- 3.Tearney GJ, Brezinski ME, Bouma BE, Boppart SA, Pitris C, Southern JF, Fujimoto JG. In vivo endoscopic optical biopsy with optical coherence tomography. Science. 1997;276:2037–2039. doi: 10.1126/science.276.5321.2037. [DOI] [PubMed] [Google Scholar]
- 4.Bouma BE, Tearney GJ. Handbook of optical coherence tomography. New York: Marcel Dekker; 2002. [Google Scholar]
- 5.Beaurepaire E, Boccara AC, Lebec M, Blanchot L, Saint-Jalmes H. Full-field optical coherence microscopy. Opt. Lett. 1998;23:244–246. doi: 10.1364/ol.23.000244. [DOI] [PubMed] [Google Scholar]
- 6.Dubois A, Vabre L, Boccara AC, Beaurepaire E. High-resolution full-field optical coherence tomography with a Linnik microscope. Appl. Opt. 2002;41:805–812. doi: 10.1364/ao.41.000805. [DOI] [PubMed] [Google Scholar]
- 7.Vabre L, Dubois A, Boccara AC. Thermal-light full-field optical coherence tomography. Opt. Lett. 2002;27:530–532. doi: 10.1364/ol.27.000530. [DOI] [PubMed] [Google Scholar]
- 8.Dubois A, Grieve K, Moneron G, Lecaque R, Vabre L, Boccara C. Ultrahigh-resolution full-field optical coherence tomography. Appl. Opt. 2004;43:2874–2883. doi: 10.1364/ao.43.002874. [DOI] [PubMed] [Google Scholar]
- 9.Dubois A, Moneron G, Grieve K, Boccara AC. Three-dimensional cellular-level imaging using full-field optical coherence tomographt. Phys. Med. Biol. 2004;49:1227–1234. doi: 10.1088/0031-9155/49/7/010. [DOI] [PubMed] [Google Scholar]
- 10.Oh WY, Bouma BE, Iftimia N, Yun SH, Yelin R, Tearney GJ. Ultrahigh-resolution full-field optical coherence microscopy using InGaAs camera. Opt. Express. 2006;14:726–735. doi: 10.1364/opex.14.000726. http://www.opticsinfobase.org/abstract.cfm?URI=oe-14-2-726. [DOI] [PubMed]
- 11.Bentzen SM. Evaluation of the spatial resolution of a CT scanner by direct analysis of the edge response function. Med. Phy. 1983;10:579–581. doi: 10.1118/1.595328. [DOI] [PubMed] [Google Scholar]
- 12.Hall DJ, Hebden JC, Delpy DT. Evaluation of spatial resolution as a function of thickness for time-resolved optical imaging of highly scattering media. Med. Phys. 1997;24:361–368. doi: 10.1118/1.597904. [DOI] [PubMed] [Google Scholar]
- 13. http://www.mathworks.com/access/helpdesk/help/toolbox/images/fspecial.html.
- 14.Kino GS, Chim SSC. Mirau correlation microscope. Appl. Opt. 1990;29:3775–3783. doi: 10.1364/AO.29.003775. [DOI] [PubMed] [Google Scholar]
- 15.Gmitro AF, Aziz D. Confocal microscopy through a fiber-optic imaging bundle. Opt. Lett. 1993;18:565–567. doi: 10.1364/ol.18.000565. [DOI] [PubMed] [Google Scholar]
- 16.Lane PM, Dlugan ALP, Richards-Kortum R, MacAulay CE. Fiber-optic confocal microscopy using a spatial light modulator. Opt. Lett. 2000;25:1780–1782. doi: 10.1364/ol.25.001780. [DOI] [PubMed] [Google Scholar]


