Abstract
Epithelial cells express calcium-activated Cl− channels of unknown molecular identity. These Cl− channels play a central role in diseases such as secretory diarrhea, polycystic kidney disease, and cystic fibrosis. The family of bestrophins has been suggested to form calcium-activated Cl− channels. Here, we demonstrate molecular and functional expression of bestrophin-1 (BEST1) in mouse and human airways, colon, and kidney. Endogenous calcium-activated whole cell Cl− currents coincide with endogenous expression of the Vmd2 gene product BEST1 in murine and human epithelial cells, whereas calcium-activated Cl− currents are absent in epithelial tissues lacking BEST1 expression. Blocking expression of BEST1 with short interfering RNA or applying an anti-BEST1 antibody to a patch pipette suppressed ATP-induced whole cell Cl− currents. Calcium-dependent Cl− currents were activated by ATP in HEK293 cells expressing BEST1. Thus, BEST1 may form the Ca2+-activated Cl− current, or it may be a component of a Cl− channel complex in epithelial tissues.
Ca2+-activated Cl− channels (CaCC)2 are present in almost every cell type examined. Although this type of channel has been studied extensively, the molecular identity of CaCC in epithelial tissues remains a mystery (1, 2). The channels are of small conductance, show outward rectification upon moderate increases in intracellular Ca2+, and have an anion selectivity of I− > Cl− (3, 4). Both direct activation of the channel by increases in intracellular Ca2+ and indirect activation through Ca2+-dependent phosphorylation by calmodulin kinase II have been described (2, 5). Small conductance CaCC in excised membrane patches of human pancreatic CFPAC cells have been shown to be regulated by Ca2+, calmodulin kinase II, and inositol 3,4,5,6-tetrakisphosphate (6). CaCC are inhibited by compounds like DIDS and niflumic acid, although these pharmacological tools lack specificity (7).
Molecular candidates for CaCC have been proposed in the past. A family of Ca2+-activated Cl− channels (CLCA) has been identified (8, 9). These proteins are involved not only in chloride conductance and epithelial secretion but also in cell-cell adhesion, apoptosis, and cell cycle control. However, detailed structure-function analysis is still missing, and these proteins have a surprisingly low Ca2+ sensitivity (1). Thus, CLCA could be part of a higher Cl− channel complex (10). The ClC-3 channel has been shown to be regulated by calmodulin kinase II (11). However, ClC-3 is a cytosolic Cl− channel, located in endosomes, and ClC-3 knock-out animals apparently do not lack CaCC (1).
Previous studies demonstrated that bestrophin-1, the product of the vitelliform macular dystrophy (VMD2) gene, is able to form CaCC (12). Mutations in the VMD2 gene cause early-onset autosomal dominant macular dystrophy of the retina, the so-called Best disease (13). Previous studies detected this channel in the basolateral membrane of the retinal pigment epithelium (14), where it controls the light-peak amplitude in the electrooculogram. Expression of BEST1 was reported to be limited to the retinal pigment epithelium, although it has also been detected in cultured airway epithelial cells (15, 16). For the first time, we will provide evidence that endogenously expressed BEST1 causes Ca2+-activated Cl− conductance in epithelial tissues.
EXPERIMENTAL PROCEDURES
Ussing Chamber Recordings
Mice (C57BL/6, Charles Rivers Laboratories) were killed under CO2 narcosis by cervical dislocation. Tissues were put immediately into an ice-cold buffer solution containing 145 mmol/liter NaCl, 3.8 mmol/liter KCl, 5 mmol/liter d-glucose, 1 mmol/liter MgCl2, 5 mmol/liter HEPES, and 1.3 mmol/liter calcium gluconate (pH 7.4). After mounting into a perfused micro-Ussing chamber, apical and basolateral surfaces of the epithelium were perfused continuously with buffer solution at a rate of 5–10 ml/min (chamber volume of 2 ml). All experiments were carried out at 37 °C under open circuit conditions. Transepithelial resistance (Rte) was determined by applying short (1 s) current pulses (I = 0.5 μA), and the corresponding changes in transepithelial voltage (Vte) and basal Vte were recorded continuously. Vte values refer to the serosal side of the epithelium. The equivalent short circuit current (Isc) was calculated according to Ohm's law from Vte and Rte (Isc = Vte/Rte).
Patch Clamp
Cell culture dishes were mounted on the stage of a Zeiss IM35 inverted microscope and kept at 37 °C. The bath was perfused continuously with Ringer's solution at ∼10 ml/min. Patch clamp experiments were performed in the fast whole cell configuration. Patch pipettes had an input resistance of 2–4 megaohms when filled with a solution containing 30 mm KCl, 95 mm potassium gluconate, 1.2 mm NaH2PO4, 4.8 mm Na2HPO4, 1 mm EGTA, 0.758 mm calcium gluconate, 1.034 mm MgCl2, 5 mm d-glucose, and 3 mm ATP. The pH was 7.2, and the Ca2+ activity was 0.1 μm. The access conductance was measured continuously and was 60–140 nanosiemens. Currents (voltage clamp) and voltages (current clamp) were recorded using a patch clamp amplifier (EPC-7, List Medical Electronics, Darmstadt, Germany), an LH1600 interface and PULSE software (HEKA, Lambrecht, Germany), and Chart software (ADInstruments, Spechbach, Germany). Data were stored continuously on a computer hard disc and analyzed using PULSE software. In regular intervals, membrane voltages (Vc) were clamped in steps of 10 mV from −50 to +50 mV relative to the resting potential. Membrane conductance (Gm) was calculated from the measured current (I) and Vc values according to Ohm's law.
mRNA Expression of Bestrophins in Tissues and Cultured Cells
Total RNA was isolated from freshly isolated tissues and cell lines studied using NucleoSpin RNA II columns (Macherey-Nagel, Düren, Germany). After reverse transcription of total RNA (Moloney murine leukemia virus reverse transcriptase, Promega, Mannheim, Germany), reverse transcription (RT)-PCR was used to detect expression of mRNAs for bestrophins. The oligonucleotide primers were designed for the mRNA of each gene product (name, gene, NCBI accession number, sense and antisense primers, size of the PCR product): hBEST1, VMD2, NM_004183, 5′-CTGCTCTGCTACTACATCATC-3′, 5′-GTGTCCACACTGAGTACGC-3′, 552 bp; hBEST2, VMD2L1, NM_017682, 5′-GTTCTACATGGCGCTGAGTG-3′, 5′-CATAGTGAAAGAGCATTCCAC-3′, 560 bp; hBEST3, VMD2L3, NM_152439, 5′-CAGGAGTCCAAAAACGTTAC-3′, 5′-CCTTCATTCCGGGCTTTAG-3′, 433 bp; hBEST4, VMD2L2, NM_153274, 5′-CATGTCCCAGGAAGAGAGG-3′, 5′-GGTCCTCATCCCAGTACTG-3′, 584 bp; mBEST1, Vmd2, NM_011913, 5′-ACACAACACATTCTGGGTGC-3′, 5′-TTCAGAAACTGCTTCCCGATC-3′, 246 bp; mBEST2, Vmd2l1, NM_145388, 5′-GAGCTGTTATGTTTCCTGGG-3′, 5′-GTAGCAACTTTAGGGCACTG-3′, 529 bp; and mBEST4, Vmd2l3, NM_001007583, 5′-CAACCTGACGTCCCTGCTC-3′, 5′-CTTCTTCATCTTGGGCAAAC-3′, 607 bp. Oligonucleotide primers for both human β-actin (ACTB, NM_001101) and mouse β-actin (Actb, NM_007393) were designed: 5′-CAACGGCTCCGGCATGTG-3′, 5′-GTGGTGGTGAAGCTGTAGC-3′, 576 bp. PCRs were performed at 94 °C for 2 min, for 35 cycles at 94 °C for 30 s, and at annealing temperatures of 60 °C for 30 s and 72 °C for 1 min. PCR products were visualized by loading onto agarose gels and were verified by sequencing.
Down-regulation of VMD2 Expression by Stealth RNAiTM
Duplexes of 25 nucleotides of small interfering RNA (siRNA) were designed and synthesized by Invitrogen. The sense strand of the siRNA used to silence the VMD2 gene was 5′-UGUCCCUGUUGGCUGUGGAUGAGAU-3′, corresponding to position 1038 of the VMD2 mRNA relative to the start codon. A scrambled sequence siRNA double-stranded oligomer not homologous to any known gene (BLOCK-iTTM fluorescent oligonucleotide) served as a control. Transfection of HT29, T84, and 16HBE cells was carried out 1 day after seeding (Lipofectamine 2000, Invitrogen) in Opti-MEM I. After 24–48 h, cells were used for patch clamping and protein isolation.
Expression of Human BEST1 in HEK293 Cells
pRK5 vector carrying cDNA for human BEST1 was kindly provided by Dr. Hugh Cahill (The Johns Hopkins University, Baltimore, MD). The plasmid was cotransfected (Lipofectamine 2000) in Opti-MEM I into HEK293 cells together with pEGFP-1 (Clontech) at a ratio of 10:1. One day after transfection, the cells were replated on 4-cm2 glass coverslips. Transfected cells were identified by enhanced green fluorescent protein (EGFP) fluorescence and used for patch clamp experiments within 3 days.
Antibodies
Affinity-purified polyclonal antiserum were produced in rabbits immunized with the peptide carrying either mouse BEST1 (AESYPYRDEAGTKPVLYE) or human BEST1 (KDHMDPYWALENRDEAHS) coupled to keyhole limpet hemocyanin (Davids Biotechnologie, Regensburg, Germany).
Immunohistochemistry
Tissues were fixed for 2 h with 4% paraformaldehyde in 0.1 m cacodylate buffer (pH 7.4). Tracheas and colons were dehydrated and embedded in paraffin. Paraffin-embedded tissues were cut at 4 μm on a rotary microtome (RM 2165, Leica, Wetzlar, Germany). Sections were dewaxed and rehydrated. In tracheal sections, endogenous peroxide activity was eliminated by incubation in methanol with 3% H2O2 for 20 min. Sections were incubated overnight at 4 °C with rabbit anti-mouse bestrophin-1 antibodies diluted 1:10,000 in Tris buffer containing Triton X-100 (0.8%) and goat serum to prevent nonspecific binding. Subsequently, sections were incubated with horseradish peroxidase-linked goat anti-rabbit secondary antibodies (Amersham Biosciences), and the ABC (avidin-biotin-peroxidase complex) technique was used to visualize labeling with 3,3-diaminobenzidine. The ABC technique involves application of a biotin-labeled secondary antibody, followed by the addition of an avidin-biotin-peroxidase complex (17). Sections were counterstained with Mayer's hematoxylin.
Detection of Mouse and Human BEST1 Proteins by Western Blotting
Protein was isolated from mouse nose, trachea, and kidney epithelium and from cultured cells using buffer containing 150 mmol of NaCl, 50 mmol of Tris, 100 mmol of dithiothreitol, 1% Nonidet P-40, and 1% protease inhibitor mixture (Sigma). Equal amounts of total protein (20 μg) were separated on a 7% SDS-polyacrylamide gel and transferred to a polyvinylidene difluoride membrane (Amersham Biosciences), which was blocked with 3% nonfat dried milk in phosphate-buffered saline/Tween 20 (0.1%) buffer for 1 h at room temperature. The membrane was incubated with a rabbit anti-mouse or rabbit anti-human BEST1 antibody (1:5000) overnight at 4 °C. Proteins were visualized using a horseradish peroxide-conjugated goat anti-rabbit IgG secondary antibody (1:30,000; Acris Antibodies GmbH, Hiddenhausen, Germany) and an ECL Advance Western blotting detection kit (Amersham Biosciences). Signal detection was done using a Fluor-STM MultiImager system (Bio-Rad).
Cell Culture
9HTE and 16HBE-14o cells (bronchial epithelium; kindly provided by Prof. D. Gruenert, California Pacific Medical Research Institute, San Francisco), Calu-3 cells (pulmonary adenocarcinoma), H441 cells (lung adenocarcinoma; kindly provided by Dr. S. Wilson, University of Dundee, Dundee, Scotland, United Kingdom), HT29 cells (colorectal carcinoma epithelial), T84 cells (colorectal carcinoma), and M1 cells (mouse collecting duct; kindly provided by C. Korbmacher, Physiologisches Institut, Universität Erlangen, Erlangen, Germany) were grown in Dulbecco's modified Eagle's/Ham's F-12 medium (1:1). HEK293 cells (embryonic kidney; kindly provided by Dr. Ralph Witzgall, Institute of Anatomy, University of Regensburg) and 9HTE/16HBE cells were grown in Dulbecco's modified Eagle's medium and minimum Eagle's medium, respectively. H441 cells were grown in RPMI 1640 medium. All media were supplemented with 100 units/ml penicillin, 100 μg/ml streptomycin, and 10% fetal calf serum. Cells were incubated in 5% CO2 at 37 °C. Media were substituted with 2 mm glutamine (Calu-3, H441, T84, and 9HTE), 20 mg/ml galactose (HT29), 10 mm HEPES (Calu-3), and 10 μg/ml insulin, 5.5 μg/ml transferrin, 6.7 μg/ml selenium, and 0.1 μm dexamethasone (H441 and M1). Cells were seeded on plastic dishes or glass coverslips coated with bovine plasma fibronectin (Invitrogen) and bovine dermal collagen (Cellon, Bereldange, Luxembourg).
Materials and Statistical Analysis
All compounds used were of the highest available grade of purity and were from Sigma or Merck. All cell culture reagents were from Invitrogen. Student's t test (for paired or unpaired samples as appropriate) and analysis of variance were used for statistical analysis. p < 0.05 was accepted as significant.
RESULTS
Ca2+-activated Cl− Secretion in Mouse Airways
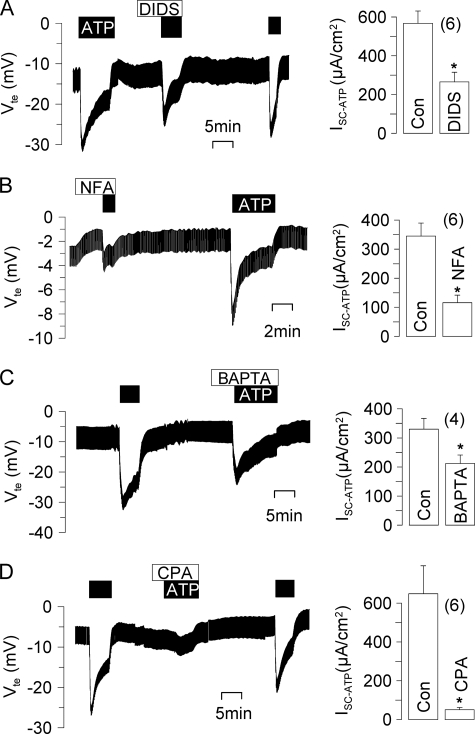
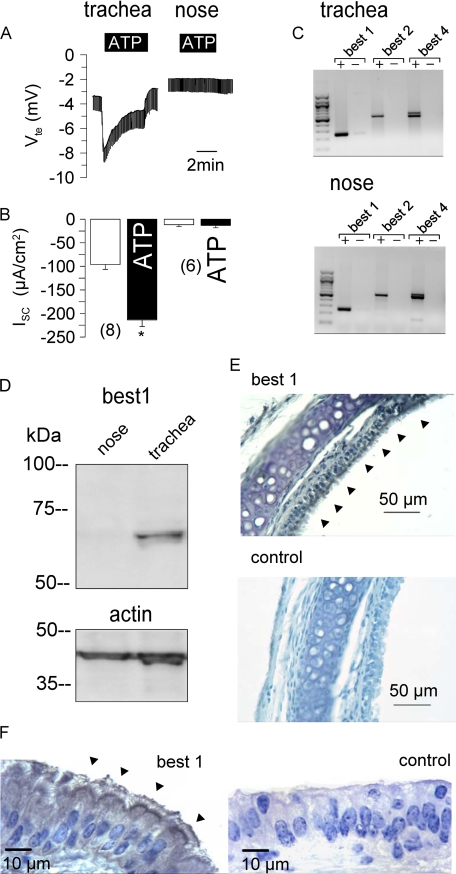
In mouse trachea, stimulation of luminal purinergic P2Y receptors by ATP (100 μm) increases intracellular Ca2+ and stimulates Cl− secretion (18, 19). ATP induced a negative voltage deflection in Ussing chamber experiments and activated a short circuit current (Isc) (Fig. 1). Application of a CaCC inhibitor, DIDS (100 μm) or niflumic acid (10 μm), inhibited ATP-induced transport in the trachea (Fig. 1, A and B). Activation of Cl− secretion was suppressed by the Ca2+ chelator BAPTA (10 μm) or by depletion of intracellular endoplasmic reticulum Ca2+ stores with cyclopiazonic acid (10 μm) (Fig. 1, C and D). CaCC have been found in primary murine nasal cell cultures and in cystic fibrosis nasal epithelium but not in normal murine nasal tissue (20–22). We occasionally detected a small Cl− secretory response upon ATP stimulation, which was insignificant, however (Fig. 2, A and B). mRNA analysis demonstrated the presence of mouse bestrophin-1, -2, and -4 in both the trachea and nose (Fig. 2C). However, Western blot analysis detected BEST1 protein only in the trachea but not in the nasal epithelium (Fig. 2D). Expression of BEST1 was further demonstrated by immunohistochemistry using horseradish peroxidase-conjugated rabbit IgG. BEST1 was detected in the tracheal epithelium at lower and higher magnifications, whereas control stains without primary antibody were negative (Fig. 2, E and F). Thus, expression of BEST1 correlates with the appearance of Ca2+-activated Cl− currents in mouse trachea.
FIGURE 1.
Ca2+-activated Cl− secretion in mouse trachea. Shown are Ussing chamber recordings of the transepithelial voltage (Vte). A and B, ATP (100 μm) induced a negative voltage deflection and a short circuit current (Isc) due to activation of CaCC in mouse trachea, which was inhibited by DIDS (100 μm) or niflumic acid (NFA; 10 μm). C and D, activation of Cl− secretion can be suppressed by the Ca2+ chelator BAPTA (10 μm) or by depletion of intracellular endoplasmic reticulum Ca2+ stores with cyclopiazonic acid (CPA) (10 μm). Asterisks indicate significant difference compared with the control (Con; paired Student's t test). The number of experiments is indicated in parentheses.
FIGURE 2.
Expression of BEST1 in mouse trachea but not nose. Shown are Ussing chamber recordings of the transepithelial voltage (Vte). A and B, ATP (100 μm) induced a negative voltage deflection and a short circuit current (Isc) due to activation of CaCC in mouse trachea but not nasal epithelium. The asterisk indicates significant difference compared with the control (paired Student's t test). The number of experiments is indicated in parentheses. C, shown are the results from RT-PCR analysis of mRNA (with (+) and without (−) reverse transcriptase) isolated from mouse tracheal and nasal epithelium. The mRNAs of all three mouse isoforms of bestrophin are expressed in both the trachea and nose. D, expression of BEST1 protein could be detected only in the trachea but not nasal epithelium. The actin band is shown to indicate equal loading. E and F, shown is the detection of BEST1 expression in the tracheal epithelium at two magnifications using horseradish peroxidase. Arrowheads indicate expression on the apical side of the tracheal epithelium. Controls were obtained without primary antibody.
Expression of Endogenous BEST1 Induces CaCC in Airway Cells
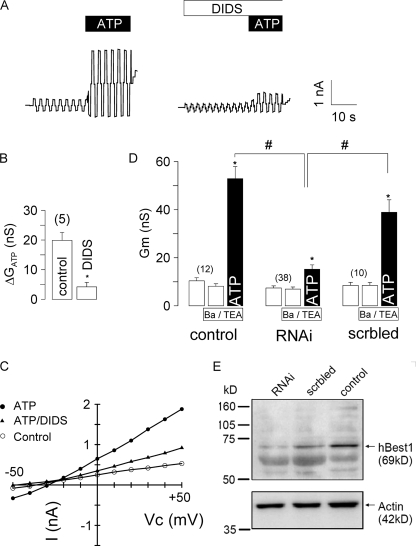
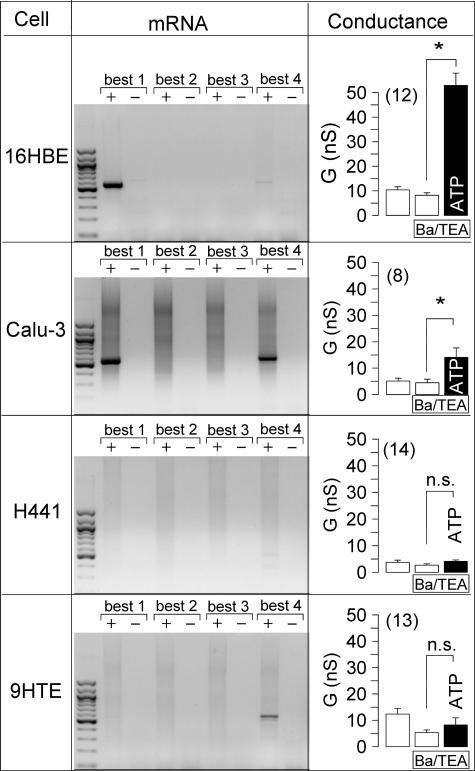
We examined CaCC in different human airway epithelial cell lines. In patch clamp experiments with human bronchial epithelial cells (16HBE), a whole cell Cl− current was activated by 100 μm ATP, which was inhibited by 100 μm DIDS (Fig. 3). Expression of BEST1 protein in 16HBE cells was verified by Western blotting (data not shown). We suppressed expression of BEST1 in 16HBE cells by incubation with BEST1 siRNA. Successful suppression was verified by semiquantitative RT-PCR, BEST1 immunocytochemistry, and Western blotting (Fig. 3E). ATP-induced whole cell conductances were significantly reduced in siRNA-treated cells compared with control cells or cells transfected with scrambled RNA (Fig. 3D). Ca2+-activated whole cell conductances were compared in four different human airway epithelial cell lines grown on glass coverslips (Fig. 4). Because both Cl− and K+ currents may be activated by increases in intracellular Ca2+, we stimulated the cells in the presence of the K+ channel blockers Ba2+ (5 mm) and tetraethylammonium (10 mm). RT-PCR analysis of the four human bestrophin isoforms demonstrated expression of BEST1 in 16HBE and Calu-3 cells but not in H441 and 9HTE cells (Fig. 4). Accordingly, ATP-activated Cl− currents were found only in 16HBE and Calu-3 cells but not in H441 and 9HTE cells. This further suggests that expression of endogenous BEST1 allows for Ca2+-activated Cl− currents in airway epithelial cells.
FIGURE 3.
CaCC human airway epithelial cells. A, stimulation of human airway epithelial cells (16HBE) with 100 μm ATP activates a Cl− current in a whole cell patch clamp experiment. Activation was inhibited by 100 μm DIDS. B, summary of experiments shown in A. nS, nanosiemens. C, I/V relationship of the whole cell currents before and after exposure to ATP and ATP/DIDS. D, summary of the experiments in which 16HBE cells were incubated with BEST1 siRNA (RNAi) to knock down BEST1 expression. Transfection with scrambled RNA (scrbled) served as a control. Experiments were performed in the presence of the K+ channel blockers Ba2+ (5 mm) and tetraethylammonium (TEA; 10 mm) to exclude K+ conductances. The asterisks indicate significant difference compared with the control (paired Student's t test). The number signs indicate significant difference compared with siRNA (unpaired Student's t test). The number of experiments is indicated in parentheses. E, Western blot of human BEST1 and actin in siRNA-treated and control cells.
FIGURE 4.
Expression of bestrophins in different human airway epithelial cell lines. Shown are the results from RT-PCR analysis (with (+) and without (−) reverse transcriptase) of the four human isoforms of bestrophin (BEST1–4) in four different human airway epithelial cell lines (left panels). Whole cell conductances were measured before and after stimulation of airway epithelial cells by 100 μm ATP in the presence of the K+ channel blockers Ba2+ (5 mm) and tetraethylammonium (TEA; 10 mm) (right panels). ATP activated a whole cell current only in respiratory cell lines that express BEST1. The asterisks indicate significant difference compared with the control (paired Student's t test). n.s. indicates no significant changes upon ATP stimulation. The number of experiments is indicated in parentheses. nS, nanosiemens.
Expression of BEST1 in Colonic Epithelial Cells
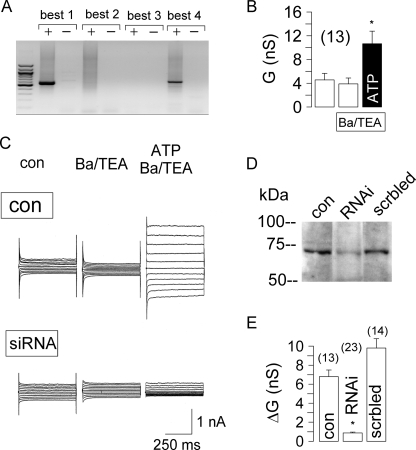
We also detected expression of BEST1 along with BEST4 in the human colonic cancer cell line HT29 (Fig. 5A). These cells activated a Ca2+-dependent Cl− conductance upon stimulation with ATP (Fig. 5B). Similar results, e.g. expression of BEST1 mRNA and protein along with Ca2+-activated Cl− currents, were obtained in the colonic cancer cell line T84 (data not shown). We suppressed expression of BEST1 in HT29 cells by BEST1 siRNA. BEST1 knockdown was 61–78% according to densitometric analysis of Western blots (Fig. 5D). Incubation of the cells with scrambled unrelated RNA showed no effects. Whole cell patch clamp analysis demonstrated largely reduced Ca2+ (ATP)-activated whole cell currents in siRNA-treated cells compared with control cells or cells transfected with scrambled RNA. Of 23 siRNA-incubated cells, none showed a current similar in size to control cells (Fig. 5, C and E).
FIGURE 5.
Expression of BEST1 in HT29 colonic epithelial cells. A, RT-PCR analysis (with (+) and without (−) reverse transcriptase) of the four human isoforms of bestrophin (BEST1–4) in HT29 human colonic epithelial cells. B, summary of ATP-induced whole cell Cl− conductances in HT29 cells. nS, nanosiemens; TEA, tetraethylammonium. C, activation of whole cell currents in HT29 cells by ATP (100 μm) under control (con) conditions and after incubation of the cells with BEST1 siRNA. D, Western blot analysis of BEST1 expression in HT29 cells grown under control conditions after incubation with siRNA (RNAi) or after incubation with scrambled (scrbled) RNA. E, summary of the whole cell conductances activated in HT29 cells grown under control conditions after incubation with siRNA or after incubation with scrambled RNA. The asterisks indicate significant difference compared with the control (paired Student's t test). The number of experiments is indicated in parentheses.
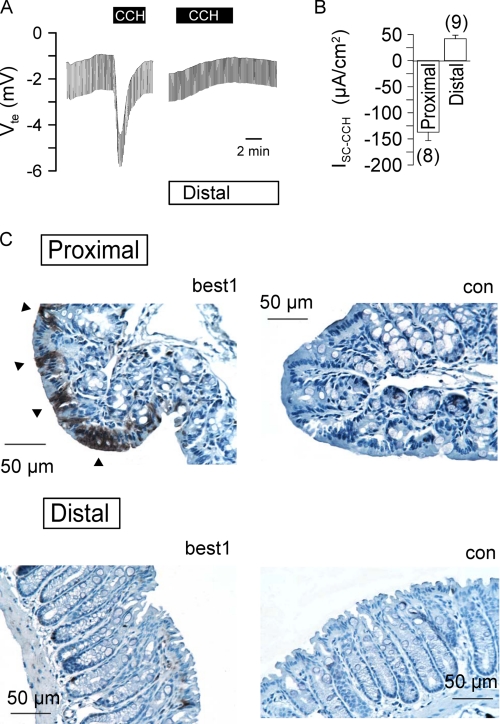
We further examined expression of BEST1 in native mouse colonic epithelium. To this end, we isolated proximal and distal colonic epithelia and determined ion transport activated by carbachol stimulation (100 μm) of basolateral M3 receptors. In the proximal colon, carbachol induced a fast and negative voltage deflection due to activation of a transient Cl− secretion. In contrast, stimulation of the distal colon activated a delayed luminal K+ secretion (Fig. 6, A and B). Expression of both BEST1 mRNA and protein was more prominent in isolated colonic crypts of the proximal colon (data not shown). Immunohistochemistry clearly detected BEST1 expression in the mouse proximal colon, whereas only a few cells stained positive for BEST1 in the distal colonic epithelium (Fig. 6C). Taken together, these results suggest that BEST1 also participates in Ca2+-dependent Cl− secretion in the proximal colonic epithelium.
FIGURE 6.
Expression of BEST1 in proximal and distal mouse colons. A, Ussing chamber recordings of the transepithelial voltage (Vte) in proximal and distal colonic epithelia. Basolateral carbachol (CCH; 100 μm) induced a negative voltage deflection by activation of CaCC in the proximal colon but caused a lumen-positive voltage deflection in the distal colon due to activation of K+ secretion. B, summary of the carbachol-induced Isc in proximal and distal colonic epithelia. The number of experiments is indicated in parentheses. C, detection of BEST1 expression in the proximal and distal colonic epithelia. Arrowheads indicate expression on the apical side of the proximal colonic epithelium. Controls (con) were obtained without primary antibody.
Expression of BEST1 in Renal Epithelial Cells
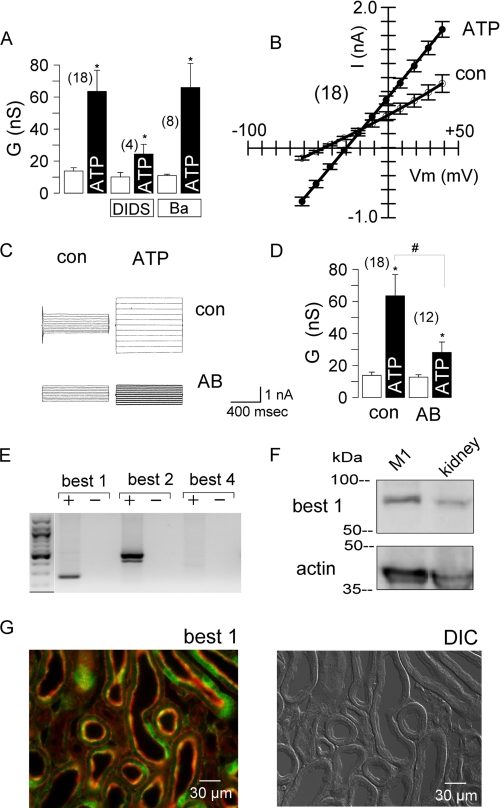
In mouse collecting duct cells, ATP activated a whole cell conductance, which was inhibited by 100 μm DIDS but not by 5 mm Ba2+ (Fig. 7A). The corresponding I/V curves were linear (Fig. 7B), probably due to high intracellular Ca2+ levels induced by purinergic stimulation (data not shown). We added an anti-mouse BEST1 antibody (1:500) to the patch pipette filling solution, which binds to the C-terminal end of BEST1. Inclusion of this antibody significantly reduced the whole cell conductance activated by 100 μm ATP (Fig. 7, C and D). M1 cells expressed mRNAs for the two isoforms BEST1 and BEST2 (Fig. 7E). Expression of BEST1 protein was detected in lysates from M1 cells and mouse kidney (Fig. 7F). In mouse kidney, immunohistochemistry detected expression of BEST1 throughout the medulla and cortex, with the strongest expression in the region of the papilla. However, not all cells within a tubular segment expressed BEST1, and thus, a rather spotted staining was obtained. Fig. 7G shows co-staining of the cytoskeleton (red) and BEST1 (green). In agreement with this result, CaCC have been found in cells from almost all renal tubular segments (4).
FIGURE 7.
Expression of BEST1 in cultured kidney epithelial cells and mouse kidney. A, summary of the ATP (100 μm)-induced whole cell Cl− conductances in M1 cells and inhibition by DIDS (100 μm) but not by barium (Ba; 5 mm). nS, nanosiemens. B, summary of the I/V curves of the whole cell currents measured before and after stimulation with ATP. C, activation of whole cell currents by ATP in M1 cells with control solution in the patch pipette (con) or after adding an anti-BEST1 antibody (AB) to the patch pipette filling solution. D, summary of the experiments shown in C. The asterisks indicate significant difference compared with the control (paired Student's t test). The number signs indicate significant difference compared with the absence of the antibody (unpaired Student's t test). The number of experiments is indicated in parentheses. E, RT-PCR analysis (with (+) and without (−) reverse transcriptase) of three mouse isoforms of bestrophin in mouse kidney. F, expression of BEST1 protein in M1 cells and kidney. The actin band is shown to indicate loading of the gel. G, co-staining of the cytoskeleton (Alexa Fluor 647-phalloidin; red) and BEST1 (Alexa Fluor 546; green) in mouse kidney (left panel) and differential interference contrast (DIC) image of the kidney slice (right panel).
Expression of Human BEST1 Induces CaCC in HEK293 Cells
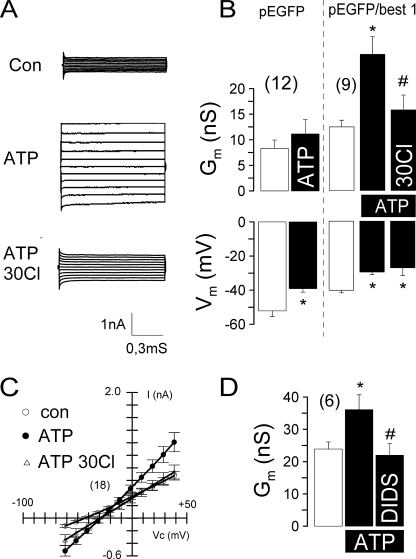
To further confirm a role for BEST1 as a CaCC, we expressed human BEST1 in HEK293 cells. Expression was verified by Western blot analysis and immunocytochemistry (data not shown). HEK293 cells coexpressing BEST1 and EGFP activated a whole cell conductance upon stimulation with 100 μm ATP. This was not observed in HEK293 cells expressing only EGFP (Fig. 8, A and B). Coexpressing cells demonstrated an enhanced base-line conductance and a reduced membrane voltage, probably due to enhanced base-line Cl− conductance. Membrane voltage was further depolarized, and the whole cell conductance was inhibited by reducing the bath Cl− concentration to 30 mm (Fig. 8, B and C). The ATP-activated whole cell conductance was inhibited by 100 μm DIDS (Fig. 8D). Taken together, these results strongly suggest that Ca2+-dependent Cl− currents in epithelial cells from airways, colon, and kidney are due to expression of BEST1.
FIGURE 8.
Activation of CaCC in HEK293 cells after overexpression of human BEST1. A, activation of whole cell currents by ATP (100 μm) in HEK293 cells coexpressing EGFP and human BEST1. Lowering the bath Cl− concentration to 30 mm reduced ATP-activated whole cell conductance. B, summary of the experiments shown in A. HEK293 cells expressing only EGFP did not activate a whole cell conductance. nS, nanosiemens. C, summary of the I/V curves of the whole cell currents measured before and after stimulation with ATP. D, summary of the effects of DIDS (100 μm) on ATP-induced Cl− conductance in HEK293 cells. The asterisks indicate significant difference compared with the control (con; paired Student's t test). The number signs indicate significant difference compared with ATP. The number of experiments is indicated in parentheses.
DISCUSSION
CaCC in Epithelial Tissues
CaCC are fundamental for fluid secretion in acini of exocrine tissues, such as lachrymal, parotid, mandibular, and pancreatic glands (23). In airways and in the colonic epithelium, electrolyte secretion is dominated by cystic fibrosis transmembrane conductance regulator (CFTR) Cl− channels (24). Apart from CFTR, Cl− secretion is activated through stimulation of CaCC present in the apical membranes of airways and other organs. Previous studies showed that (i) application of the Ca2+ ionophore ionomycin also activates Cl− secretion; (ii) in the presence of low (1 μm) extracellular Ca2+, activation of Cl− secretion is very transient; (iii) after inhibition of phospholipase C, purinergic Cl− secretion is reduced; and (iv) DIDS inhibits Ca2+-activated Cl− secretion in mouse airways (18). These and other experiments (19) strongly suggest that secretion occurs through Ca2+-dependent activation of Cl− channels. Outwardly rectifying Cl− channels are unlikely candidates because Ca2+ activates small conductance Cl− channels in HT29 and 16HBE cells (25, 26).
Both CFTR and CaCC control airway surface liquid, which is essential for mucociliary clearance (27). Purinergic activation of CaCC in the airways resembles an important therapeutic principle for cystic fibrosis (28, 29). Cl− secretion in mouse airways is dominated by CaCC, which explains why CFTR knock-out animals do not develop a cystic fibrosis lung disease (21). Interestingly, a functional relationship exists between CaCC and CFTR (30, 31), and Ca2+-mediated Cl− secretion is enhanced in cystic fibrosis airways (19). Thus, Ca2+-activated Cl− secretion is found in cystic fibrosis but not normal murine nasal epithelium (21). After pre-stimulation of CFTR, CaCC was also activated in normal nasal epithelium. However, this is probably due to activation of basolateral K+ channels rather than activation of luminal CaCC (32). Although transcripts for BEST1 were detected in the nasal epithelium, no significant levels of BEST protein were found. This is probably not explained by mRNA instability because no AU-rich elements could be detected.
In the human colonic epithelia of older infants and adults, CaCC-mediated Cl− secretion is less important. Thus, no Cl− secretion is found in the absence of functional CFTR, e.g. in the colonic epithelia of cystic fibrosis patients (33–35). However, younger infants may express CaCC in the colonic epithelium and therefore be susceptible to virus-induced diarrhea. In fact, age-dependent diarrhea was induced in mice by the rotavirus toxin NSP4 in a previous study (36). NSP4 increases intracellular Ca2+ and activates Cl− secretion in newborn mouse pups (37). In the present study, we detected Ca2+-activated Cl− secretion in the proximal but not distal colon. Accordingly, BEST1 was well detected in the proximal but not distal colon. The role of CaCC in the kidney is controversial (38, 39). However, in studies with primary and permanent cultures of proximal and distal tubules, thick ascending limb, and collecting ducts, CaCC was identified (40–43). Also in the present experiments with M1 collecting duct cells, CaCC was detected. Thus, renal epithelial cells may retain the ability to induce Ca2+-activated Cl− transport.
Bestrophin: Cl− Channel or Regulator of Ca2+ Signaling?
Sulfhydryl scanning enabled structure-function analysis and demonstrated that bestrophins form bona fide Cl− channels (44, 45). Direct activation of BEST4 by Ca2+ was demonstrated in excised membrane patches (46). Nevertheless, it has been proposed that BEST1 is a regulator of voltage-gated L-type Ca2+ channels rather than a Ca2+-regulated Cl− channel (47, 48). Purinergic increase in [Ca2+]i was augmented in retinal pigment epithelium cells of Vmd2−/− mice. In this study, the [Ca2+]i increase was remarkably slow. This is in sharp contrast to Ca2+ responses observed in the epithelial tissues used here: the [Ca2+]i increase occurred within <1 s and was typically 4–10-fold (data not shown). Moreover, the ATP-induced Ca2+ increase is due to Ca2+ release from intracellular stores (peak) and Ca2+ influx, probably through transient receptor potential-related Ca2+ channels (plateau) (49). Preliminary unpublished measurements show only insignificant changes in Ca2+ signaling upon manipulation of BEST1 expression.
BEST1 Mediates Ca2+-activated Cl− Secretion in Epithelial Tissues
The present data show endogenous expression of BEST1 in mouse and human epithelial cells from airways, colon, and kidney. BEST1 expression clearly correlated with the appearance of CaCC. Rectification of the Cl− currents varied between the different cell lines. I/V curves were almost linear for M1 and HEK293 cells but were rectifying for 16HBE cells. Rectification depends on the level of [Ca2+]i and disappears at high (>1 μm) concentrations (3, 42, 50, 51). ATP increased [Ca2+]i to values above 1 μm in M1 cells but to values below 1 μm in 16HBE cells (data not shown), which may explain the variability. In HT29 and 16HBE cells, suppression of BEST1 by siRNA inhibited CaCC. These results clearly indicate that BEST1 is necessary for Ca2+-activated Cl− secretion. However, they do not rule out the possibility that BEST1 is a regulator of a still unidentified CaCC or that it is part of a Cl− channel complex. Only a fraction of BEST1 appears to be localized in the plasma membrane, whereas most is found in the cytosol, probably bound to vesicular membranes (15, 45). The spotted expression of BEST1 in some tissues suggests that CaCC is not equally present within the epithelium. Thus, expression may depend on additional factors, which should be the subject of subsequent studies.
Acknowledgments
We gratefully acknowledge the supply of human BEST1 cDNA from Prof. Dr. J. Nathans (Department of Neuroscience, The Johns Hopkins University). We acknowledge A. Paech for expert technical assistance and Dr. V. Milenkovic for help with cell transfection and advice on this project.
This paper was published in 2006; however, due to an error by the publisher, it was not published in print. This work was supported by Deutsche Forschungsgemeinschaft Grants KU 756/9-1 and SFB699 and Else Kröner-Fresenius-Stiftung P36/05/A44/05.
- CaCC
- Ca2+-activated Cl− channel(s)
- DIDS
- 4,4′-diisothiocyanostilbene-2,2′-disulfonic acid
- RT
- reverse transcription
- siRNA
- small interfering RNA
- EGFP
- enhanced green fluorescent protein
- BAPTA
- 1,2-bis(o-aminophenoxy)ethane-N,N,N′,N′-tetraacetic acid
- CFTR
- cystic fibrosis transmembrane conductance regulator.
REFERENCES
- 1.Jentsch T. J., Stein V., Weinreich F., Zdebik A. A. (2002) Physiol. Rev. 82, 503–568 [DOI] [PubMed] [Google Scholar]
- 2.Nilius B., Droogmans G. (2003) Acta Physiol. Scand. 177, 119–147 [DOI] [PubMed] [Google Scholar]
- 3.Kuruma A., Hartzell H. C. (2000) J. Gen. Physiol. 115, 59–80 [DOI] [PMC free article] [PubMed] [Google Scholar]
- 4.Hartzell C., Putzier I., Arreola J. (2005) Annu. Rev. Physiol. 67, 719–758 [DOI] [PubMed] [Google Scholar]
- 5.Worrell R. T., Frizzell R. A. (1991) Am. J. Physiol. Cell Physiol. 260, C877–C882 [DOI] [PubMed] [Google Scholar]
- 6.Ho M. W., Kaetzel M. A., Armstrong D. L., Shears S. B. (2001) J. Biol. Chem. 276, 18673–18680 [DOI] [PubMed] [Google Scholar]
- 7.Eggermont J. (2004) Proc. Am. Thoracic Soc. 1, 22–27 [DOI] [PubMed] [Google Scholar]
- 8.Cunningham S. A., Awayda M. S., Bubien J. K., Ismailov I. I., Arrate M. P., Berdiev B. K., Benos D. J., Fuller C. M. (1995) J. Biol. Chem. 270, 31016–31026 [DOI] [PubMed] [Google Scholar]
- 9.Pauli B. U., Abdel-Ghany M., Cheng H. C., Gruber A. D., Archibald H. A., Elble R. C. (2000) Clin. Exp. Pharmacol. Physiol. 27, 901–905 [DOI] [PubMed] [Google Scholar]
- 10.Loewen M. E., Forsyth G. W. (2005) Physiol. Rev. 85, 1061–1092 [DOI] [PubMed] [Google Scholar]
- 11.Huang P., Liu J., Di A., Robinson N. C., Musch M. W., Kaetzel M. A., Nelson D. J. (2001) J. Biol. Chem. 276, 20093–20100 [DOI] [PubMed] [Google Scholar]
- 12.Sun H., Tsunenari T., Yau K. W., Nathans J. (2002) Proc. Natl. Acad. Sci. U.S.A. 99, 4008–4013 [DOI] [PMC free article] [PubMed] [Google Scholar]
- 13.Petrukhin K., Koisti M. J., Bakall B., Li W., Xie G., Marknell T., Sandgren O., Forsman K., Holmgren G., Andreasson S., Vujic M., Bergen A. A., McGarty-Dugan V., Figueroa D., Austin C. P., Metzker M. L., Caskey C. T., Wadelius C. (1998) Nat. Genet. 19, 241–247 [DOI] [PubMed] [Google Scholar]
- 14.Marmorstein A. D., Marmorstein L. Y., Rayborn M., Wang X., Hollyfield J. G., Petrukhin K. (2000) Proc. Natl. Acad. Sci. U.S.A. 97, 12758–12763 [DOI] [PMC free article] [PubMed] [Google Scholar]
- 15.Stanton J. B., Goldberg A. F., Hoppe G., Marmorstein L. Y., Marmorstein A. D. (2006) Biochim. Biophys. Acta 1758, 241–247 [DOI] [PMC free article] [PubMed] [Google Scholar]
- 16.Duta V., Szkotak A. J., Nahirney D., Duszyk M. (2004) FEBS Lett. 577, 551–554 [DOI] [PubMed] [Google Scholar]
- 17.Greenberg N. M., DeMayo F., Finegold M. J., Medina D., Tilley W. D., Aspinall J. O., Cunha G. R., Donjacour A. A., Matusik R. J., Rosen J. M. (1995) Proc. Natl. Acad. Sci. U.S.A. 92, 3439–3443 [DOI] [PMC free article] [PubMed] [Google Scholar]
- 18.Kunzelmann K., Schreiber R., Cook D. I. (2002) Pflügers Arch. 444, 220–226 [DOI] [PubMed] [Google Scholar]
- 19.Mall M., Gonska T., Thomas J., Schreiber R., Seydewitz H. H., Kuehr J., Brandis M., Kunzelmann K. (2003) Pediatr. Res. 53, 608–618 [DOI] [PubMed] [Google Scholar]
- 20.Grubb B. R., Rogers T. D., Diggs P. C., Boucher R. C., Ostrowski L. E. (2006) Am. J. Physiol. Lung Cell. Mol. Physiol. 290, L270–L277 [DOI] [PubMed] [Google Scholar]
- 21.Grubb B. R., Boucher R. C. (1999) Physiol. Rev. 79, S193–S214 [DOI] [PubMed] [Google Scholar]
- 22.Grubb B. R., Vick R. N., Boucher R. C. (1994) Am. J. Physiol. Cell Physiol. 266, C1478–C1483 [DOI] [PubMed] [Google Scholar]
- 23.Greger R. (1996) Pflügers Arch. 432, 579–588 [DOI] [PubMed] [Google Scholar]
- 24.Kunzelmann K. (1999) Rev. Physiol. Biochem. Pharmacol. 137, 1–70 [DOI] [PubMed] [Google Scholar]
- 25.Kubitz R., Warth R., Allert N., Kunzelmann K., Greger R. (1992) Pflügers Arch. 421, 447–454 [DOI] [PubMed] [Google Scholar]
- 26.Kunzelmann K., Kubitz R., Grolik M., Warth R., Greger R. (1992) Pflügers Arch. 421, 238–246 [DOI] [PubMed] [Google Scholar]
- 27.Tarran R., Button B., Boucher R. C. (2006) Annu. Rev. Physiol. 68, 543–561 [DOI] [PubMed] [Google Scholar]
- 28.Lazarowski E. R., Tarran R., Grubb B. R., van Heusden C. A., Okada S., Boucher R. C. (2004) J. Biol. Chem. 279, 36855–36864 [DOI] [PMC free article] [PubMed] [Google Scholar]
- 29.Kunzelmann K., Mall M. (2003) Am. J. Respir. Med. 2, 299–309 [DOI] [PubMed] [Google Scholar]
- 30.Kunzelmann K., Mall M., Briel M., Hipper A., Nitschke R., Ricken S., Greger R. (1997) Pflügers Arch. 434, 178–181 [DOI] [PubMed] [Google Scholar]
- 31.Wei L., Vankeerberghen A., Cuppens H., Eggermont J., Cassiman J. J., Droogmans G., Nilius B. (1999) Pflugers Arch. 438, 635–641 [DOI] [PubMed] [Google Scholar]
- 32.Clarke L. L., Grubb B. R., Gabriel S. E., Smithies O., Koller B. H., Boucher R. C. (1992) Science 257, 1125–1128 [DOI] [PubMed] [Google Scholar]
- 33.Berschneider H. M., Knowles M. R., Azizkhan R. G., Boucher R. C., Tobey N. A., Orlando R. C., Powell D. W. (1988) FASEB J. 2, 2625–2629 [DOI] [PubMed] [Google Scholar]
- 34.Mall M., Bleich M., Schürlein M., Kühr J., Seydewitz H. H., Brandis M., Greger R., Kunzelmann K. (1998) Am. J. Physiol. Gastrointest. Liver Physiol. 275, G1274–G1281 [DOI] [PubMed] [Google Scholar]
- 35.Mall M., Wissner A., Seydewitz H. H., Kuehr J., Brandis M., Greger R., Kunzelmann K. (2000) Am. J. Physiol. Gastrointest. Liver Physiol. 278, G617–G624 [DOI] [PubMed] [Google Scholar]
- 36.Ball J. M., Tian P., Zeng C. Q., Morris A. P., Estes M. K. (1996) Science 272, 101–104 [DOI] [PubMed] [Google Scholar]
- 37.Dong Y., Zeng C. Q., Ball J. M., Estes M. K., Morris A. P. (1997) Proc. Natl. Acad. Sci. U.S.A. 94, 3960–3965 [DOI] [PMC free article] [PubMed] [Google Scholar]
- 38.Schlatter E., Greger R., Schafer J. A. (1990) Pflügers Arch. 417, 317–323 [DOI] [PubMed] [Google Scholar]
- 39.Leipziger J. (2003) Am. J. Physiol. Renal Physiol. 284, F419–F432 [DOI] [PubMed] [Google Scholar]
- 40.Barrière H., Belfodil R., Rubera I., Tauc M., Poujeol C., Bidet M., Poujeol P. (2003) Am. J. Physiol. Renal Physiol. 284, F796–F811 [DOI] [PubMed] [Google Scholar]
- 41.Lu L., Markakis D., Guggino W. B. (1993) J. Membr. Biol. 135, 181–189 [DOI] [PubMed] [Google Scholar]
- 42.Qu Z., Wei R. W., Hartzell H. C. (2003) Am. J. Physiol. Renal Physiol. 285, F326–F335 [DOI] [PubMed] [Google Scholar]
- 43.Bidet M., Tauc M., Rubera I., de Renzis G., Poujeol C., Bohn M. T., Poujeol P. (1996) Am. J. Physiol. Renal Physiol. 271, F940–F950 [DOI] [PubMed] [Google Scholar]
- 44.Qu Z., Fischmeister R., Hartzell C. (2004) J. Gen. Physiol. 123, 327–340 [DOI] [PMC free article] [PubMed] [Google Scholar]
- 45.Tsunenari T., Sun H., Williams J., Cahill H., Smallwood P., Yau K. W., Nathans J. (2003) J. Biol. Chem. 278, 41114–41125 [DOI] [PMC free article] [PubMed] [Google Scholar]
- 46.Tsunenari T., Nathans J., Yau K. W. (2006) J. Gen. Physiol. 127, 749–754 [DOI] [PMC free article] [PubMed] [Google Scholar]
- 47.Rosenthal R., Bakall B., Kinnick T., Peachey N., Wimmers S., Wadelius C., Marmorstein A., Strauss O. (2006) FASEB J. 20, 178–180 [DOI] [PubMed] [Google Scholar]
- 48.Marmorstein L. Y., Wu J., McLaughlin P., Yocom J., Karl M. O., Neussert R., Wimmers S., Stanton J. B., Gregg R. G., Strauss O., Peachey N. S., Marmorstein A. D. (2006) J. Gen. Physiol. 127, 577–589 [DOI] [PMC free article] [PubMed] [Google Scholar]
- 49.Nilius B., Voets T. (2005) Pflugers Arch. 451, 1–10 [DOI] [PubMed] [Google Scholar]
- 50.Evans M. G., Marty A. (1986) J. Physiol. 378, 437–460 [DOI] [PMC free article] [PubMed] [Google Scholar]
- 51.Arreola J., Melvin J. E., Begenisich T. (1996) J. Gen. Physiol. 108, 35–47 [DOI] [PMC free article] [PubMed] [Google Scholar]


