Abstract
MicroRNAs (miRNAs) are endogenous short (∼22) nucleotide RNAs that regulate gene function by modification of target mRNAs. miRNA-1 (miR-1) and miRNA-206 (miR-206) are highly expressed in skeletal muscle. Due to the tissue-specific nature of miR-1/206 for skeletal muscles, we investigated the role of miR-1/206 in the development of rhabdomyosarcoma. Initially, we demonstrated that miR-1/206 expression was suppressed in rhabdomyosarcomas and found at very low levels in a rhabdomyosarcoma RD cell line. Transient transfection of miR-1/206 into cultured RD cells led to a significant decrease in cell growth and migration. Using bioinformatics, we identified two putative miR-1/206 binding sites within the 3′-untranslated region of the human c-Met mRNA. miR-1/206 was then shown to have activity on mRNA expression by targeting the c-Met 3′-untranslated region. The expression of c-Met protein was shown to be down-regulated by subsequent Western blot analysis. Conversely, up-regulation of c-Met was confirmed in tissue samples of human rhabdomyosarcoma, with its level inversely correlated with miR-1/206 expression. In vivo, miR-1/206-expressing tumor cells showed growth delay in comparison with negative control. Our results demonstrated that miR-1/206 suppressed c-Met expression in rhabdomyosarcoma and could function as a potent tumor suppressor in c-Met-overexpressing tumors. Inhibition of miR-1/206 function could contribute to aberrant cell proliferation and migration, leading to rhabdomyosarcoma development.
Soft tissue sarcomas are a heterogeneous group of mesenchymal tumors that carries a guarded prognosis due to the aggressive local invasion and metastatic potential of these tumors. Progress in the search for etiology and treatment of soft tissue sarcomas is hampered by the fact that they represent a small proportion of all malignancies. Rhabdomyosarcoma (RMS)3 is a distinct soft tissue sarcoma that likely originates from cells of the myogenic lineage (1). On the basis of histology, three main subgroups are often described: alveolar, embryonal, and pleomorphic RMS (2). Alveolar RMS consists of small, round, and densely packed cells and occurs mainly in the trunk and extremities and carries with it a more unfavorable prognosis (1, 3). Embryonal RMS typically consists of spindle-shaped cells and occurs mainly in the head and neck region (1, 3). Pleomorphic RMS is uncommon and usually occurs in the adult population (2). Until now, treatment of RMS has largely been based on local regional control and toxic systemic chemotherapy regimens without directed cellular therapy (2, 3). Recent investigations, however, are improving our understanding of its tumor biology and are helping to identify novel prognostic factors and targets for clinical therapy (1).
MicroRNAs (miRNAs) are endogenously expressed, non-protein-coding RNAs that can influence a wide variety of biological processes including development, metabolism, proliferation, differentiation, and oncogenesis (4). Aberrant post-transcriptional regulation of mRNAs by miRNAs can lead to oncogenesis with increased cell proliferation, decreased apoptosis, and enhanced metastatic potential of affected cells (5). Following the discovery of miRNA let-7, multiple miRNAs were linked to oncogenes and tumor suppressor genes including the Ras proto-oncogene, the antiapoptotic gene BCL2, the potent p53 tumor suppressor gene, and the MET oncogene (5, 6). The MET oncogene encodes a cell surface receptor tyrosine kinase, c-Met, that is up-regulated in a variety of tumors including rhabdomyosarcoma (7, 8). c-Met is a disulfide-linked heterodimer consisting of an extracellular α-subunit and a β-subunit that spans the plasma membrane and contains the catalytic region with tyrosine kinase activity (7). Binding of hepatocyte growth factor (HGF)/scatter factor induces c-Met dimerization and autophosphorylation, which leads to cellular activation (7). c-Met activation, through aberrant HGF stimulation, can contribute to tumor growth, invasiveness, and metastasis (9). c-Met has been predicted and shown to be the target gene of multiple miRNAs including miRNA-206 (miR-206) (10).
miR-206 and miRNA-1 (miR-1) are members of the muscle-specific miR-1 family of so-called myomiRs that currently consists of six members (10). Based on sequence conservation of the seed region, the miR-1 family can be divided into miR-1/206 or miR-133a/b subgroups (11, 12). Although miR-1 is highly enriched in both cardiac and skeletal muscle, miR-206 is exclusively expressed in skeletal muscle (11, 12). Therefore, it can be deduced that these miRNAs play an important role in the myogenesis and development of cardiac and skeletal muscles. miR-1 knock-out mice confirmed that this miRNA is necessary for cardiac development and physiology (13). miR-206, which is specifically expressed in skeletal muscle and rarely detected in the heart, plays an important role in skeletal muscle development (12, 14). However, development and progression of skeletal muscle tumors such as rhabdomyosarcoma based on the presence or absence of miR-1 and miR-206 remain largely unknown.
In this study, we attempted to decipher the biological function of miR-1/206 in human rhabdomyosarcoma specimens and rhabdomyosarcoma RD cells. By causal association following the identification of cell specificity for miR-1/206, we surmised that miR-1/206 acted as a suppressor of RD cell proliferation and migration. Furthermore, we set out to elucidate the cellular mechanisms responsible for its activity and to identify its target, c-Met, so that it may one day serve as a potential target in the treatment of rhabdomyosarcoma.
EXPERIMENTAL PROCEDURES
Cell Culture and Tumor Specimens
The human rhabdomyosarcoma cell line, RD, purchased from ATCC (Manassas, VA), was grown in Dulbecco's modified Eagle's medium (DMEM; Invitrogen) supplemented with 10% fetal bovine serum (Hyclone, Logan, UT) and incubated at 37 °C in a humidified incubator containing 5% CO2. HEK-293 cells were grown under the same conditions. Eight rhabdomyosarcoma specimens and normal donor skeletal muscle tissues were obtained from the Eye Hospital and the First Affiliated Hospital of Wenzhou Medical College (Wenzhou, China). All studies and procedures involving human tissue samples were approved by the Wenzhou Medical College Institutional Review Board.
Northern Blot Analysis
Total RNA was extracted from cell lines or tissue samples with TRIzol reagent (Invitrogen), and the integrity was confirmed using spectrophotometry and formaldehyde/agarose gel electrophoresis. 10 μg of total RNA were dissolved in gel loading buffer II (Ambion, Austin, TX), heated at 95 °C for 3 min, loaded onto denaturing 15% Tris borate-EDTA-urea gels, and separated on a 15% denaturing urea-PAGE gel for 1 h and then transferred onto positively charged nylon membranes (GE Healthcare) followed by a cross-linking with UV irradiation. The RNA blots were prehybridized at 68 °C for 1 h using ULTRAhyb ultrasensitive hybridization buffer (Ambion) and subjected to hybridization with 3′-digoxigenin (DIG)-labeled locked nucleic acid probe for miR-1 or miR-206 (100 ng/ml) overnight at 42 °C. The locked nucleic acid-modified oligonucleotide probe was obtained from Exiqon (Vedbaek, Denmark). 100 pmol of the probe were DIG-labeled using DIG oligonucleotide 3′-end labeling kit (Roche Applied Science, Mannheim, Germany). Following hybridization, membranes were rinsed and then washed three times using a low stringency buffer (2× SSC and 0.1% SDS). Detection was performed using the DIG luminescent detection kit (Roche Applied Science) according to manufacturer's instructions. In brief, membranes were blocked in blocking buffer for 30 min and then incubated with alkaline phosphatase-conjugated anti-DIG antibody for 60 min followed by washing three times in washing buffer. After equilibration in detection buffer, blots were incubated with chemiluminescent substrate CDP-Star and exposed to a Kodak Biomax MR film (Eastman Kodak Co.). DIG-labeled U6 small nuclear RNA probe was used as an internal control.
Cell Proliferation Assay
RD cells were plated at 3 × 10³ cells/well in 96-well plates for each transfection. Transfections were performed using Lipofectamine 2000 (Invitrogen). For each well, 50 nm miR-1 or miR-206 precursor molecule or a negative control precursor miRNA was employed. For convenience, the miR-1 precursor or the miR-206 precursor is termed miR-1 or miR-206, respectively, following transfection throughout this report. Pre-miRTM miRNA precursor molecules (Ambion) are small, chemically modified double-stranded RNA molecules designed to mimic endogenous mature miRNAs once properly transfected and expressed by recipient cells. The negative control is a scrambled oligonucleotide that has been validated to not produce identifiable effects on known miRNA function (Ambion). After a 24-h culture, cell proliferation was assessed using the CellTiter 96 AQueous MTS [3-(4,5-dimethylthiazol-2-yl)-5-(3-carboxymethoxyphenyl)-2-(4-sulfophenyl)-2H-tetrazolium, inner salt] assay (Promega, Madison, WI) according to the manufacturer's instructions. Briefly, the CellTiter 96 AQueous one solution reagent was added to each well and incubated at 37 °C for 3 h. Cell proliferation was assessed by measuring the absorbance at 490 nm using a microtiter plate reader (Molecular Devices, Sunnyvale, CA).
Hoechst Staining
RD cells were plated in 24-well plates and transfected with different miRNAs as described above. 24 h later, doxorubicin (0.1 μg/ml; Sigma) was added to each well prior to staining with Hoechst 33342 (5 μg/ml; Sigma) to visualize nuclear condensation and DNA fragmentation. After 20 min of staining at 25 °C, the cells were examined under fluorescence microscopy (Zeiss, Oberkochen, Germany).
Caspase Activity Assay
Apoptosis in RD cells was determined using the Caspase-Glo 3/7 assay kit according to the manufacturer's instructions (Promega). RD cells were first plated in triplicates in 96-well plates and transfected with different miRNAs as described above. Samples were then incubated with the caspase substrate for 2 h followed with measurements by a microtiter plate reader (Molecular Devices).
Fluorescence-activated Cell Sorting of Cell Cycling
RD cells were transfected with 50 nm miR-1 or miR-206 precursor molecule or a negative control. After 48 h, the cells were collected, washed with phosphate-buffered saline, and stained with propidium iodide using the BD Cycletest Plus DNA reagent kit (BD Biosciences). The stained cells (1 × 10⁵) were then analyzed for DNA content with a flow cytometer (FACScaliber, BD Biosciences).
Luciferase Reporter Assays
The 3′-untranslated region (UTR) of human c-Met was amplified from human genomic DNA and individually cloned into the pMIR-REPORT vector (Ambion) by directional cloning. Seed regions were mutated to remove all complementarity to nucleotides 1–7 of miR-1/206 by using the QuikChange XL mutagenesis kit (Stratagene, La Jolla, CA). HEK-293 cells were co-transfected with 0.4 μg of firefly luciferase reporter vector and 0.02 μg of the control vector containing Renilla luciferase, pRL-SV40 (Promega), using Lipofectamine 2000 (Invitrogen) in 24-well plates. Each transfection was carried out in four wells. For each well, 50 nm miR-1 or miR-206 precursor molecule (Ambion) or a negative control precursor miRNA (Ambion) was co-transfected with the reporter constructs. Luciferase assays were performed 24 h after transfection using the Dual-Luciferase reporter assay system (Promega). Firefly luciferase activity was normalized to Renilla luciferase activity.
Transwell Migration Assay
RD cells were grown in DMEM containing 10% fetal bovine serum to ∼60% confluence and transfected with 50 nm miR-1 or miR-206 precursor molecule or a negative control. After 24 h, the cells were harvested by trypsinization and washed once with Hanks' balanced salt solution (Invitrogen). To measure cell migration, 8-mm pore size culture inserts (Transwell; Costar, High Wycombe, UK) were placed into the wells of 24-well culture plates, separating the upper and the lower chambers. In the lower chamber, 400 μl of DMEM containing recombinant human hepatocyte growth factor (HGF, 20 ng/ml) were added. HGF was purchased from R&D Systems (Minneapolis, MN). Then, 1 × 10⁵ cells were added to the upper chamber. After 24 h of incubation at 37 °C with 5% CO2, the number of cells that had migrated through the pores was quantified by counting 10 independent visual fields under the microscope (Zeiss) using a ×20 objective, and cell morphology was observed by staining with hematoxylin and eosin.
Western Blot Analysis
RD cells (1 × 10⁵) were seeded and grown in DMEM with 10% fetal bovine serum in 6-well plates for 24 h. After transfection, the cells were washed with cold phosphate-buffered saline and subjected to lysis in a lysis buffer (50 mm Tris-Cl, 1 mm EDTA, 20 g/liter SDS, 5 mm dithiothreitol, 10 mm phenylmethylsulfonyl fluoride). Equal amounts of protein lysates (50 μg each) and rainbow molecular weight markers (GE Healthcare) were separated by 10% SDS-PAGE and then electrotransferred to nitrocellulose membranes. The membranes were blocked with a buffer containing 5% nonfat milk in phosphate-buffered saline with 0.05% Tween 20 for 2 h and incubated overnight with antibody at 4 °C. After a second wash with phosphate-buffered saline containing 0.05% Tween 20, the membranes were incubated with peroxidase-conjugated secondary antibodies (Santa Cruz Biotechnology, Santa Cruz, CA) and developed with an enhanced chemiluminescence (ECL) detection kit (Pierce). Glyceraldehyde-3-phosphate dehydrogenase (GAPDH) was used as a loading control. Antibodies for total extracellular signal-regulated kinases 1 and 2 (ERK1/2), phosphorylated ERK1/2, total Akt, phosphorylated Akt, total focal adhesion kinase (FAK), phosphorylated FAK, CDK2, CDK4, CDK6, phosphorylated Rb, and p21 were from Cell Signaling Technology (Beverly, MA), and those for c-Met, E2F1, and E2F3 were from Santa Cruz Biotechnology.
In Vivo Tumor Growth Assay
The pre-microRNA expression constructs lenti-miR-1, lenti-miR-206, and pCDH-CMV-MCS-EF1-copGFP control vector were purchased from System Biosciences (Mountain View, CA). The lentivirus was produced according to the manufacturer's instructions. RD cells were infected with lentivirus expressing miR-1, miR-206, or negative control, respectively. Female nude mice 6 weeks of age were used for xenograft studies. RD cells (8 × 10⁶) expressing miR-1/206 or negative control were inoculated subcutaneously into the flanks of nude mice. All mice were sacrificed 8 weeks later after injection of tumor cells. Tumor size was measured with a caliper, and volume was calculated using the following formula: (L × W2) × 0.5 (where L = length and W = width), according to the method previously reported (15). All studies and procedures were approved by the Wenzhou Medical College Animal Care and Use Committee.
Statistical Analysis
All data were shown as the mean ± S.E. Differences between samples were analyzed using the Student's t test. Statistical significance was accepted at p < 0.05.
RESULTS
miR-1/206 Expression Is Down-regulated in Rhabdomyosarcoma Specimens and RD Tumor Cells
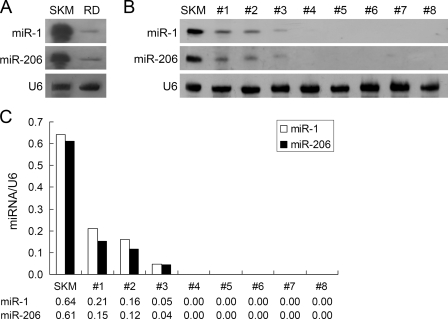
To determine whether miRNA was involved in the tumorigenesis of rhabdomyosarcoma cells, we first compared miR-1/206 expression in normal skeletal muscle and rhabdomyosarcoma. Northern blot analysis was performed using DIG-labeled locked nucleic acid probe for miR-1 or miR-206 to detect its expression in tissue specimens and the immortalized rhabdomyosarcoma RD cell line. Both miR-1 and miR-206 were highly expressed in normal skeletal muscle (Fig. 1A). In contrast, expression of miR-1/206 was decreased significantly in RD cells (Fig. 1A). To determine the expression pattern of miR-1/206 in primary human rhabdomyosarcoma, total RNA from eight human rhabdomyosarcoma specimens was analyzed by Northern blotting. Consistent with results from the RD cells, miR-1/206 expression was suppressed or not detected in all eight samples (Fig. 1, B and C). These results indicate that miR-1/206 expression is down-regulated in human rhabdomyosarcoma and imply a possible role of miR-1/206 in rhabdomyosarcoma development.
FIGURE 1.
miR-1/206 expression is down-regulated in human RD rhabdomyosarcoma cell line and human rhabdomyosarcoma specimens. A, Northern blot analysis was performed to detect the expression of miR-1 and miR-206 in the RD cell line (RD), in comparison with human skeletal muscle (SKM). miR-1 and miR-206 were highly expressed in human skeletal muscle tissues but were down-regulated in RD cells. U6 small nuclear RNA (U6) was used as an internal control. B, miR-1 and miR-206 were expressed at low levels in eight human rhabdomyosarcoma specimens. C, quantitative representation of the data from panel B by measuring the intensities of each band and then normalizing to the intensity of the internal control U6 small nuclear RNA.
miR-1/206 Inhibits RD Cell Proliferation through Apoptosis and Cell Cycle Arrest
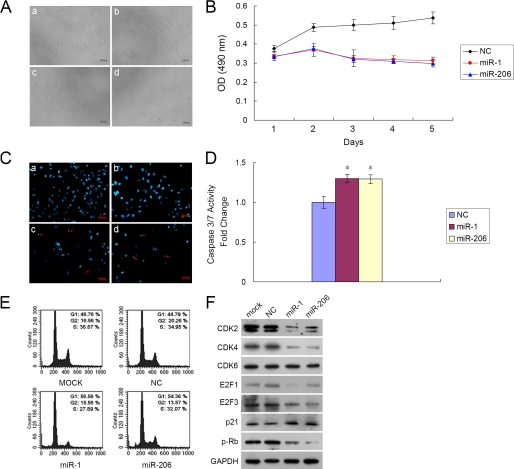
Because miR-1/206 expression was down-regulated in rhabdomyosarcoma, we sought to establish its biological activity on cell growth. RD cells were first transfected with the miR-1, the miR-206 precursor molecule, or a negative control. Although transfection with the negative control did not affect RD cell viability, both miR-1 and miR-206 caused a significant inhibition of RD cell growth as compared with that of control (Fig. 2A). Subsequently, the MTS assay was carried out to assess growth inhibition at days 1–5 after transfection. miR-1 or miR-206 transfected cells caused a dramatic inhibition of RD cell proliferation as compared with that of control over a 5-day interval (Fig. 2B). The decrease in cell number was statistically significant between cells transfected with miR-1/206 and cells transfected with a negative control at day 5 (miR-1 led to 41.5 ± 3.2%, whereas miR-206 led to 44.4 ± 3.6% decrease, p < 0.01). To further characterize miR-1/206-mediated inhibition of cell proliferation, we measured the amount of cell death using Hoechst staining. miR-1/206-transfected RD cells showed diminished viability and higher incidence of DNA fragmentation following Hoechst staining (Fig. 2C). RD cells transfected with miR-1 or miR-206 had a 12 ± 1.5% (n = 3, p < 0.01) and 11 ± 2% (n = 3, p < 0.01) increase in cell death as compared with control. We then investigated apoptosis as a mode of cell death by examining caspase activity. Caspase 3/7 activity was significantly increased in miR-1/206 transfected cells in comparison with negative control after 48 h (Fig. 2D). Complementary to the finding that miR-1/206 inhibited cell proliferation, these cells were found to have G1 cell cycle arrest. 48 h after transfection, cells were stained with propidium iodide and analyzed by flow cytometry. Cells transfected with miR-1 or miR-206 showed 56.56 and 54.36% G1 arrest in comparison with 46.76% with mock transfection and 44.79% with negative control (Fig. 2E). Concurrently, introduction of miR-1/206 dramatically down-regulated cell cycle-related proteins, including CDK2, CDK4, E2F1, E2F3 and phosphorylated Rb, which are important for cell cycle G1 phase progression and G1/S transition (Fig. 2F). In contrast, p21, which mediates the p53-dependent cell cycle G1 arrest, was up-regulated (Fig. 2F). Overall, these results suggest that miR-1/206 expression suppressed RD cell growth by increasing apoptosis and by cell cycle G1 arrest.
FIGURE 2.
Exogenous miR-1/206 inhibits RD cell proliferation through induction of apoptosis and G1 cell cycle arrest. A, RD cell growth was assessed after transfection with miR-1 or miR-206. The negative control (NC) scrambled oligonucleotide does not encode for any known miRNA. The number of cells was dramatically reduced after transfection with miR-1 (panel c) or miR-206 (panel d) as compared with mock (panel a) and NC (panel b) transfection. Photos were taken 72 h after transfection. B, the MTS cell proliferation assay was carried out and plotted from days 1 to 5 as indicated after Lipofectamine transfection of RD cells with miR-1 (50 nm), miR-206 (50 nm), or NC. Cells transfected with miR-1/206 were less metabolically active than cells transfected with NC. The data are expressed as the mean value ± S.E. (error bars) of the results obtained from triplicates in one experiment. Results are representative of three separate experiments. C, transfection with miR-1/206 induced DNA fragmentation in RD cells as demonstrated by Hoechst staining. Photographs of cells following transfection are shown as indicated: panel a, mock; panel b, negative control; panel c, miR-1; and panel d, miR-206. Red arrows denote cells with fragmented nuclei. D, caspase 3/7 activity assay was performed on RD cells transfected with either NC or miR-1/206. Relative caspase 3/7 activity is indicated in comparison with negative control. Results are expressed as the mean value ± S.E. (error bars) of the results obtained from triplicates in one experiment. Results are representative of three separate experiments. *, differences between miR-1/206 and negative control transfected cells were significant, p < 0.05. E, cell cycle arrest was evaluated using flow cytometry. RD cells, collected 48 h after transfection, were stained with propidium iodide and analyzed by flow cytometry. Cells transfected with miR-1 and miR-206 had a higher proportion of cell cycle arrest at the G1 phase in comparison with mock or NC. 10,000 cells were evaluated in each sample. Results depicted are representative of three independent experiments. F, miR-1/206 regulated cell cycle-related proteins that are important for cell cycle G1 phase progression and G1/S transition. RD cells were transfected with miR-1/206, mock, or a negative control. Cell lysates were prepared and used for Western blot analysis with CDK2, CDK4, CDK6, E2F1, E2F3, p21, and phosphorylated Rb (p-Rb) antibodies. GAPDH was used as a loading control.
miR-1/206 Inhibits Migration of RD Cells
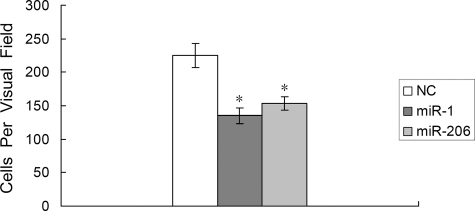
Cell migration, a prerequisite for malignant transformation and metastasis, was assessed using a Transwell migration assay. RD cells were first transfected with either the miR-1/206 precursor or a control precursor. Cells were seeded on culture inserts, and the ability of cells to migrate to the underside of the inserts was determined in the presence of HGF. As shown in Fig. 3, the HGF-induced migration was significantly decreased when comparing miR-1/206-transfected cells with negative control (135 ± 12 versus 225 ± 18 for miR-1, 153 ± 10 versus 225 ± 18 for miR-206, n = 3 each, p < 0.01). Therefore, introduction of miR-1/206 resulted in reduced cell motility in response to HGF.
FIGURE 3.
Transfection of miR-1/206 reduces the migration of RD cells. RD cells were transfected with miR-1/206 or NC for 24 h and plated on culture inserts in DMEM containing 20 ng/ml HGF to assess the number of migrating cells. The number of cells that had migrated through the pores was quantified by counting 10 independent visual fields using a ×20 microscope objective. Results are expressed as the mean ± S.E. (error bars) for the data obtained from three independent assays. *, differences in cell migration between miR-1/206 and negative control transfected cells were significant, p < 0.01.
c-Met Is a Target of miR-1/206
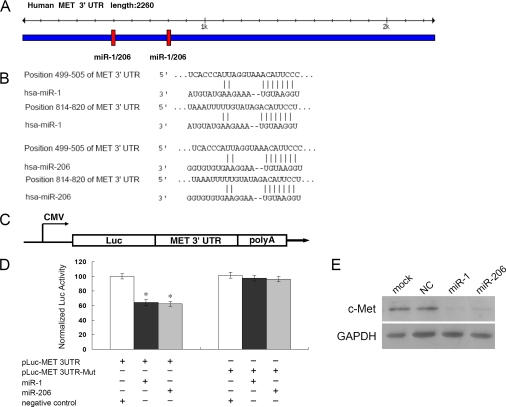
Having demonstrated a functional role for miR-1/206 in RD cells, we attempted to explore the cellular mechanisms underlying miR-1/206-mediated cell proliferation and migration. TargetScan was conducted for miR-1/206 target prediction. Two potential binding sites of miR-1/206 were predicted in the c-Met 3′-UTR (Fig. 4A). Alignment between the predicted miR-1/206 target sites and miR-1/206, the conserved 7-bp seed sequence for miR-1/206:mRNA pairing, is shown (Fig. 4B). To test the specific regulation of c-Met through the two predicted binding sites, we amplified the c-Met 3′-UTR sequence and inserted it downstream of the firefly luciferase coding region of a pMIR-Luc vector (Fig. 4C). Mutants with the putative binding sites were prepared as described (see “Experimental Procedures”). As indicated, introduction of miR-1 or miR-206 in HEK293 cells with the wild-type 3′-UTR (pLuc-MET 3UTR) construct had significant inhibition of luciferase activity as opposed to negative control (Fig. 4D). Mutations of the two binding sites, using a mutant vector (pLuc-MET 3UTR-Mut), completely abolished the ability of miR-1 or miR-206 to regulate luciferase expression (Fig. 4D). These results demonstrated that c-Met was a potential target of miR-1/206. To further confirm that miR-1/206 was indeed responsible for the down-regulation of c-Met, RD cells were transfected with the miR-1/206 molecule or a negative control. Western blot analysis showed that although c-Met expression was not affected by the transfection of a negative control, c-Met expression was dramatically reduced when transfected with either miR-1 or miR-206 (Fig. 4E).
FIGURE 4.
c-Met is a direct target of miR-1/206. A, predicted miR-1/206 binding sites in c-Met 3′-UTR. Specific locations of the binding sites were marked with red color, and c-Met 3′-UTR was marked with blue color. B, alignment between the predicted miR-1/206 target sites and miR-1/206 is shown. The conserved, 7-bp seed sequence for miR-1/206:mRNA pairing is also indicated. C, diagram depicting the pMIR luciferase reporter constructs, containing a cytomegalovirus (CMV) promoter, which was utilized to verify the putative miR-1/206 binding sites (see “Experimental Procedures”). Luc, luciferase; poly A, poly(A) tail. D, HEK293 cells were co-transfected with miR-1 or miR-206, pLuc-MET 3′-UTR, along with a pRL-SV40 reporter plasmid. After 24 h, the luciferase activity was measured. Values are presented as relative luciferase activity after normalization to Renilla luciferase activity. The data are expressed as the mean value ± S.E. (error bars) of the results obtained from three independent experiments. *, differences in luciferase activity between miR-1/206 and negative control transfected cells were significant, p < 0.01. E, c-Met expression levels in RD cells after transfection with miR-1/206 were determined by Western blot analysis. As compared with the NC miRNA, miR-1/206 expression dramatically reduced the levels of c-Met in RD cells. GAPDH was used as an internal control.
Introduction of miR-1/206 Down-regulates Activation of Intracellular Targets ERK1/2, Akt, and FAK
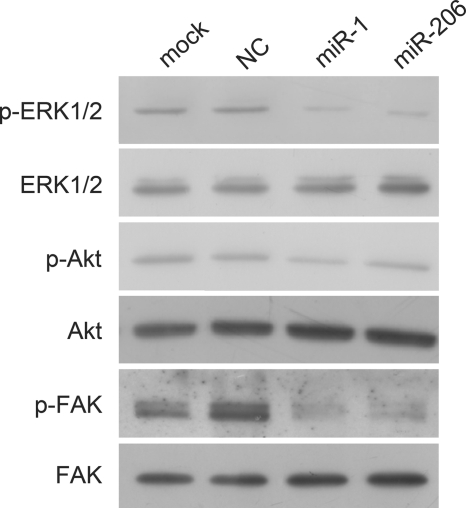
c-Met has been shown to activate diverse intracellular signaling pathways (7, 8). To examine intracellular expression patterns affected by c-Met in RD cells, we next determined the activation status of ERK1/2, Akt, and FAK after down-regulation of c-Met by miR-1/206. RD cells were transfected with miR-1, miR-206, or a negative control. Cells were solubilized and subjected to Western blot analysis with phosphorylation-specific antibodies to ERK1/2, Akt, and FAK, molecules involved in the three major signaling pathways previously shown to be stimulated by HGF (7, 8). As shown in Fig. 5, down-regulation of c-Met by miR-1 or miR-206 led to significant reduction of phosphorylated ERK1/2 and FAK in RD cells but had less obvious effect on phosphorylated Akt. Total ERK1/2, Akt, and FAK were not affected when comparing miR-1/206 transfection with negative control transfection (Fig. 5). Taken together, these results demonstrated that introduction of miR-1/206 in RD tumor cells suppressed c-Met and in turn targets of c-Met, leading to inhibition of cell proliferation and migration.
FIGURE 5.
Introduction of miR-1/206 down-regulates targets of c-Met. RD cells were transfected with miR-1, miR-206, or NC. Cell lysates were prepared and used for Western blot analysis with antibodies specific for phosphorylated ERK1/2 (p-ERK1/2), total ERK1/2, phosphorylated Akt (p-Akt), total Akt, phosphorylated FAK (p-FAK), and total FAK. miR-1/206 down-regulated expression levels of p-ERK1/2, p-Akt, and p-FAK, but not total ERK1/2, Akt, or FAK.
miR-1/206 Suppresses Rhabdomyosarcoma Development through c-Met Expression
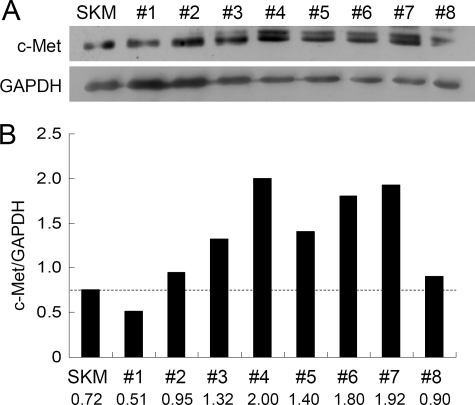
Having demonstrated that c-Met is a potential target of miR-1/206 in RD cells (Fig. 4), we next evaluated the interaction of miR-1/206 with c-Met on tissue specimens. As shown in Fig. 1, B and C, both miR-1 and miR-206 were highly expressed in normal skeletal muscle but not in rhabdomyosarcoma. Moreover, down-regulation of miR-1/206 in human rhabdomyosarcoma was associated with an elevated c-Met level in most of the tissue samples analyzed. Expression of c-Met was up-regulated in all the samples except one (Fig. 6, A and B).
FIGURE 6.
The expression levels of c-Met in human rhabdomyosarcoma specimens are up-regulated. A, tissue samples were prepared and used for Western blot analysis. SKM, skeletal muscle. B, the majority of samples examined (samples 2–8) showed an up-regulation of c-Met. Expression of c-Met was shown after normalization to GAPDH.
Expression of miR-1/206 Suppresses Tumor Growth in Vivo
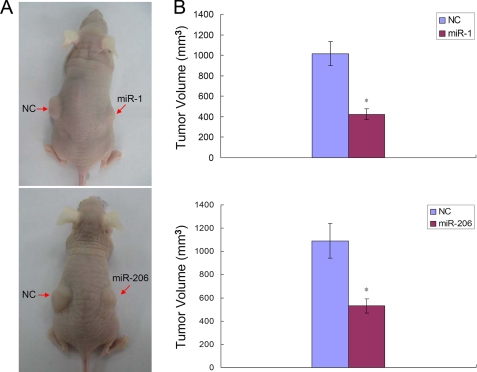
Because miR-1/206 expression inhibited the proliferation and migration of RD cells in vitro, it was reasonable to speculate that ectopic miR-1/206 could also repress tumor growth in vivo. To confirm this, RD cells infected with lentivirus expressing miR-1, miR-206, or negative control were injected subcutaneously into the flanks of nude mice. After 8 weeks, all mice were sacrificed, and the tumor volumes were measured (Fig. 7A). The average tumor volumes were significantly decreased in cells infected with miR-1 or miR-206, as compared with negative control (Fig. 7B). The results indicated that introduction of miR-1 or miR-206 suppressed the growth of RD rhabdomyosarcoma cells in vivo.
FIGURE 7.
Introduction of miR-1/206 in RD cells suppresses tumor growth in nude mice. A, mice were inoculated with lentivirus-infected RD cells expressing miR-1, miR-206, or NC. Representative photographs of nude mice 8 weeks after inoculation are shown. B, average volume of tumors derived from RD cells infected with NC or miR-1/206 in nude mice. *, differences in tumor volume between miR-1/206 and NC infected cells were significant, n = 6 each, p < 0.01. Error bars indicate S.E.
DISCUSSION
Emerging evidence suggests that in addition to protein-encoding genes, miRNAs have more than a cursory role in the pathogenesis of human cancer development by acting as agents of the RNA interference pathway (16). Following transcription and post-transcriptional modification by the ribonuclease Dicer, miRNA becomes associated with the RNA-induced silencing complex to repress expression (16). Preceded by the insight that global suppression of miRNA leads to increased tumorigenesis, studies to identify cancer-related miRNAs have unveiled a plethora of potential candidates important for human tumors (5, 17). miR-1/206, which plays a key role in heart and muscle development, was evaluated for its role in the pathogenesis of rhabdomyosarcoma within the context of this study.
In this study, we were able to illustrate for the first time that miR-1/206 can regulate cell proliferation and migration through its target gene c-Met in rhabdomyosarcoma. miR-1/206, which is highly expressed in human skeletal muscle, is down-regulated in rhabdomyosarcoma tissue specimens and the RD cell line (Fig. 1). We computationally identified the c-Met mRNA as a potential target of miR-1/206 and demonstrated that miR-1/206 decreased endogenous c-Met protein levels in RD cells by Western blotting. We also provided evidence that miR-1/206 can directly regulate mRNA expression by targeting the c-Met 3′-UTR. The inverse relationship between miR-1/206 expression and c-Met production is illustrated by Western blot analysis of the original human rhabdomyosarcoma tissue specimens (Fig. 6). Functionally, miR-1/206 may have a role in the treatment of rhabdomyosarcoma. Tumor cell invasiveness, a cornerstone capability necessary for tumor metastasis, has been shown to be affected by the presence of miRNAs (18). A series of Transwell experiments outlined under “Results” illustrated that RD cell migration can be inhibited with the restoration of miR-1/206 activity (Fig. 3). miR-1/206 inhibited RD cell migration by targeting c-Met in an HGF-dependent fashion. Finally, introduction of miR-1/206 through transfection into RD rhabdomyosarcoma cells led to a significant decrease in cell growth both in vitro and in vivo (Figs. 2 and 7).
c-Met is a particularly interesting target of investigation due to its involvement in many types of cancer (7). c-Met expression has previously been confirmed to be up-regulated in the two most common forms of rhabdomyosarcoma: alveolar and embryonal types (19–22). Other investigations into c-Met revealed that it is an essential mediator of the oncogenic properties of PAX3/7-FKHR gene translocation, thereby resulting in a number of different tumors including rhabdomyosarcoma (3). c-Met was also demonstrated to be the common denominator for aberrant cell growth using a fusion protein PAX3-FKHR (3). Despite histological differences between several types of RMS, studies using an inducible lentivirus expressing anti-c-Met short hairpin RNA validated dependence of RMS cell proliferation, survival, and invasiveness on the presence of c-Met (3). Concordant to all these findings, RMS samples evaluated in this study showed an up-regulation of c-Met (Fig. 6). In addition, we provided evidence that this up-regulation is inversely proportional to miR-1/206 through direct inhibition of c-Met 3′-UTR by miR-1/206.
Recent studies have revealed that both miR-1 and miR-206 were down-regulated in primary human cancers (23, 24), including sarcomas (25). Antitumor effects of miR-1 were seen in lung cancer cells with its targets linked to MET and Pim-1, a serine/threonine kinase commonly seen in lung cancer (23). Likewise, miR-206 was found to be inversely correlated with levels of estrogen receptor α mRNA in estrogen receptor α positive human breast cancer and could also act as a therapeutic agent in a dose-dependent fashion (24). We demonstrated that c-Met levels were directly down-regulated by introduction of miR-1/206 in rhabdomyosarcoma cells (Fig. 4E). Concomitantly, the downstream targets of c-Met including phosphorylated ERK1/2, Akt, and FAK were reduced (Fig. 5). Previous studies have demonstrated that inactivation of INK4a/ARF, along with aberrant c-Met signaling, led to rhabdomyosarcomagenesis in mice (26). The INK4a/ARF locus contains tumor suppressor genes encoding p16INK4a and p14ARF that affect downstream target proteins Rb and p53, respectively. Therefore, it would be very interesting to examine whether Rb and p53 are affected in human rhabdomyosarcoma tissue specimens as well.
In the present study, we identified a mechanism for regulation of c-Met gene expression through the miRNAs miR-1 and miR-206 in rhabdomyosarcoma. c-Met overexpression following miR-1/206 down-regulation seems to be the common etiology for the pathogenesis of RMS in the majority of samples examined in this study. Although other mechanisms of tumorigenesis surely exist, overexpression of c-Met can be an etiology for RMS development with c-Met being reported as the target gene of miR-1/206. In summary, we demonstrated that miR-1/206 negatively modulates the c-Met signaling pathway involved in cell proliferation and migration. These findings suggest that miR-1/206 plays an important role in regulating the development of rhabdomyosarcoma. Our studies will hopefully have important clinical consequences in the treatment of rhabdomyosarcoma.
This work was supported, in part, by the National Natural Science Foundation of China Grant 30772385.
- RMS
- rhabdomyosarcoma
- miRNA
- microRNA
- HGF
- hepatocyte growth factor
- DIG
- digoxigenin
- GAPDH
- glyceraldehyde-3-phosphate dehydrogenase
- UTR
- untranslated region
- DMEM
- Dulbecco's modified Eagle's medium
- MTS
- 3-(4,5-dimethylthiazol-2-yl)-5-(3- carboxymethoxyphenyl)-2-(4-sulfophenyl)-2H-tetrazolium, inner salt
- ERK1/2
- extracellular signal-regulated kinases 1 and 2
- FAK
- focal adhesion kinase
- NC
- negative control.
REFERENCES
- 1.Breitfeld P. P., Meyer W. H. (2005) Oncologist 10, 518–527 [DOI] [PubMed] [Google Scholar]
- 2.Ferrari A., Dileo P., Casanova M., Bertulli R., Meazza C., Gandola L., Navarria P., Collini P., Gronchi A., Olmi P., Fossati-Bellani F., Casali P. G. (2003) Cancer 98, 571–580 [DOI] [PubMed] [Google Scholar]
- 3.Taulli R., Scuoppo C., Bersani F., Accornero P., Forni P. E., Miretti S., Grinza A., Allegra P., Schmitt-Ney M., Crepaldi T., Ponzetto C. (2006) Cancer Res. 66, 4742–4749 [DOI] [PubMed] [Google Scholar]
- 4.He L., Hannon G. J. (2004) Nat. Rev. Genet. 5, 522–531 [DOI] [PubMed] [Google Scholar]
- 5.Zhang B., Pan X., Cobb G. P., Anderson T. A. (2007) Dev. Biol. 302, 1–12 [DOI] [PubMed] [Google Scholar]
- 6.Cho W. C. (2007) Mol. Cancer 6, 60. [DOI] [PMC free article] [PubMed] [Google Scholar]
- 7.Birchmeier C., Birchmeier W., Gherardi E., Vande Woude G. F. (2003) Nat. Rev. Mol. Cell Biol. 4, 915–925 [DOI] [PubMed] [Google Scholar]
- 8.Mazzone M., Comoglio P. M. (2006) FASEB J. 20, 1611–1621 [DOI] [PubMed] [Google Scholar]
- 9.Danilkovitch-Miagkova A., Zbar B. (2002) J. Clin. Invest. 109, 863–867 [DOI] [PMC free article] [PubMed] [Google Scholar]
- 10.McCarthy J. J. (2008) Biochim. Biophys. Acta 1779, 682–691 [DOI] [PMC free article] [PubMed] [Google Scholar]
- 11.Chen J. F., Mandel E. M., Thomson J. M., Wu Q., Callis T. E., Hammond S. M., Conlon F. L., Wang D. Z. (2006) Nat. Genet. 38, 228–233 [DOI] [PMC free article] [PubMed] [Google Scholar]
- 12.Kim H. K., Lee Y. S., Sivaprasad U., Malhotra A., Dutta A. (2006) J. Cell Biol. 174, 677–687 [DOI] [PMC free article] [PubMed] [Google Scholar]
- 13.Zhao Y., Ransom J. F., Li A., Vedantham V., von Drehle M., Muth A. N., Tsuchihashi T., McManus M. T., Schwartz R. J., Srivastava D. (2007) Cell 129, 303–317 [DOI] [PubMed] [Google Scholar]
- 14.Anderson C., Catoe H., Werner R. (2006) Nucleic Acids Res. 34, 5863–5871 [DOI] [PMC free article] [PubMed] [Google Scholar]
- 15.Naito S., von Eschenbach A. C., Giavazzi R., Fidler I. J. (1986) Cancer Res. 46, 4109–4115 [PubMed] [Google Scholar]
- 16.Valencia-Sanchez M. A., Liu J., Hannon G. J., Parker R. (2006) Genes Dev. 20, 515–524 [DOI] [PubMed] [Google Scholar]
- 17.Bartel D. P. (2004) Cell 116, 281–297 [DOI] [PubMed] [Google Scholar]
- 18.Ma L., Teruya-Feldstein J., Weinberg R. A. (2007) Nature 449, 682–688 [DOI] [PubMed] [Google Scholar]
- 19.Ferracini R., Olivero M., Di Renzo M. F., Martano M., De Giovanni C., Nanni P., Basso G., Scotlandi K., Lollini P. L., Comoglio P. M. (1996) Oncogene 12, 1697–1705 [PubMed] [Google Scholar]
- 20.Epstein J. A., Shapiro D. N., Cheng J., Lam P. Y., Maas R. L. (1996) Proc. Natl. Acad. Sci. U.S.A. 93, 4213–4218 [DOI] [PMC free article] [PubMed] [Google Scholar]
- 21.Keller C., Hansen M. S., Coffin C. M., Capecchi M. R. (2004) Genes Dev. 18, 2608–2613 [DOI] [PMC free article] [PubMed] [Google Scholar]
- 22.Ginsberg J. P., Davis R. J., Bennicelli J. L., Nauta L. E., Barr F. G. (1998) Cancer Res. 58, 3542–3546 [PubMed] [Google Scholar]
- 23.Nasser M. W., Datta J., Nuovo G., Kutay H., Motiwala T., Majumder S., Wang B., Suster S., Jacob S. T., Ghoshal K. (2008) J. Biol. Chem. 283, 33394–33405 [DOI] [PMC free article] [PubMed] [Google Scholar] [Retracted]
- 24.Kondo N., Toyama T., Sugiura H., Fujii Y., Yamashita H. (2008) Cancer Res. 68, 5004–5008 [DOI] [PubMed] [Google Scholar]
- 25.Subramanian S., Lui W. O., Lee C. H., Espinosa I., Nielsen T. O., Heinrich M. C., Corless C. L., Fire A. Z., van de Rijn M. (2008) Oncogene 27, 2015–2026 [DOI] [PubMed] [Google Scholar]
- 26.Sharp R., Recio J. A., Jhappan C., Otsuka T., Liu S., Yu Y., Liu W., Anver M., Navid F., Helman L. J., DePinho R. A., Merlino G. (2002) Nat. Med. 8, 1276–1280 [DOI] [PubMed] [Google Scholar]


