Abstract
Transforming growth factor β (TGFβ) signaling has an increasing interest in regenerative medicine as a potential tool to repair cartilages, however the chondrogenic effect of this pathway in developing systems is controversial. Here we have analyzed the function of TGFβ signaling in the differentiation of the developing limb mesoderm in vivo and in high density micromass cultures. In these systems highest signaling activity corresponded with cells at stages preceding overt chondrocyte differentiation. Interestingly treatments with TGFβs shifted the differentiation outcome of the cultures from chondrogenesis to fibrogenesis. This phenotypic reprogramming involved down-regulation of Sox9 and Aggrecan and up-regulation of Scleraxis, and Tenomodulin through the Smad pathway. We further show that TGFβ signaling up-regulates Sox9 in the in vivo experimental model system in which TGFβ treatments induce ectopic chondrogenesis. Looking for clues explaining the dual role of TGFβ signaling, we found that TGFβs appear to be direct inducers of the chondrogenic gene Sox9, but the existence of transcriptional repressors of TGFβ signaling modulates this role. We identified TGF-interacting factor Tgif1 and SKI-like oncogene SnoN as potential candidates for this inhibitory function. Tgif1 gene regulation by TGFβ signaling correlated with the differential chondrogenic and fibrogenic effects of this pathway, and its expression pattern in the limb marks the developing tendons. In functional experiments we found that Tgif1 reproduces the profibrogenic effect of TGFβ treatments.
TGFβs4 form a small family of multipotent regulatory polypeptides that gives the name to a large cytokine superfamily, which also includes Activins and bone morphogenetic proteins, characterized by structural and signaling similarities. In mammalians and birds the family is composed of three highly homologous isoforms, although the avian homologue of the mammalian TGFβ1 was initially named TGFβ4 (1). Signaling by these factors is mediated by ligand binding with type II and type I receptors to form heteromeric complexes, which phosphorylate Smad2 and -3 proteins. The activated p-Smads associate with Smad4 prior to translocation into the nucleus, where they regulate the expression of a variety of genes (see Ref. 2). TGFβs may also signal through the mitogen-activated protein kinase (MAPK) transduction pathway (3).
TGFβs are considered major regulators of the differentiation and growth of the skeletal connective tissues, with a promising future in regenerative medicine as tools to modulate the differentiation of stem cells for reconstruction of cartilage, tendon, or bone. In the long appendicular bones TGFβs are expressed in the chondrocytes of the growth plate and regulate the rate of differentiation of prehypertrophic chondrocytes to hypertrophic chondrocytes (4–7). In embryonic systems, TGFβs are expressed in the developing limb forming well defined domains in the digit chondrogenic aggregates, in the developing joints and in the differentiating tendon blastemas (8–10). However, the precise functional significance of these expression domains is not fully understood.
Limb phenotypes consisting of reduced size of appendicular skeleton were observed in mice deficient in Tgfβ2 but not in Tgfβ3 (11, 12). However deletion of TgfβR2 targeted to the limb mesenchyme provides evidence for a wider role of this signaling pathway in skeletogenesis, including a key function in joint morphogenesis (7, 13). In vivo, exogenous TGFβs induce ectopic cartilages and extra digits when they are applied in the interdigital regions of the embryonic limb (14), however similar treatments in early limb mesenchyme exert an antichondrogenic influence (15, 16). Equivalent contradictory observations were also obtained in “in vitro” model systems of chondrogenic differentiation. TGFβs are expressed in the chondrogenic aggregates of limb mesenchymal cell cultures plated at high density “micromass cultures” (17, 18), but its function in chondrogenesis is controversial. Some studies have reported that, in this culture system, addition of TGFβs to the medium increases chondrogenesis (19–23). Similar results were obtained using other cell lineages, including C3H10T1/2 cells or bone marrow-derived chondrogenic stem cells (24, 25). However, other studies reported an inhibitory influence of these factors on chondrogenesis (13, 26–28), and still other studies reported the occurrence, at the same time, of both positive and negative chondrogenic influence of TGFβs in micromass cultures (17, 18). The dual effect of TGFβ on chondrogenesis has been associated with differences in the stage of differentiation of the cell cultures, but the molecular basis remains unknown.
In adult individuals TGFβs are major factors responsible for a variety of physiological and pathological processes involving fibrosis (29, 30), and connective tissues appear defective in mice deficient for both TGFβ2 and TGFβ3 (12). Furthermore TGFβs have been implicated in the maturation of the fibrous tissue of the tendons (31) and in the establishment of the regions of tendon attachment into the skeleton (32, 33). Our hypothesis is that the negative influence of TGFβs on chondrogenesis observed in a variety of experimental models might reflect the positive influence on fibrogenesis of these cytokines. Therefore, the aim of this study was to analyze the function of TGFβ signaling in developing limb mesenchymal micromass cultures to clarify their function in chondrogenesis and in the formation of fibrous connective tissue. During the preparation of this report it was found that tendons are lost in mice mutants with abolished TGFβ signaling (34), however how this tenogenic function is coordinated with the demonstrated role of TGFβ signaling in chondrogenesis awaits clarifications.
EXPERIMENTAL PROCEDURES
In this work, we employed Rhode Island chicken embryos of stages 25–28 HH (Hamburger and Hamilton (73)).
Micromass Cultures
Chondrogenesis was analyzed in high density (2 × 10⁷ cells/ml) micromass cultures of undifferentiated mesodermal cells obtained from the progress zone region located under the apical ectodermal ridge of chick leg buds at stage 25 HH. Use of this tissue guarantees that no muscle is included in the micromass (35, 36). Cells were incubated in serum-free medium (Dulbecco's modified Eagle's medium) with 100 units/ml penicillin and 100 μg/ml streptomycin. The chondrogenic outcome was analyzed by Alcian blue staining.
Gene expression associated with chondrogenesis (Aggrecan and Sox9) or tenogenesis (Scleraxis and Tenomodulin) were studied at different periods in control and experimental cultures treated with TGFβ1 (2 or 10 ng/ml), TGFβ2 (2 or 10 ng/ml), and/or inhibitors of their downstream signaling effectors, including the inhibitor of Smad2 and -3, SB431542 (0.01 mm, Sigma); the inhibitor of p38 MAPK, SB203580 (5 μm, Calbiochem); and the inhibitor of MEK, PD98059 (20 μm, Calbiochem). Inhibition of protein synthesis was performed in some experiments by addition of 20 μg/ml cycloheximide (Sigma) to the culture.
For histological analysis, micromass cultures after Alcian blue staining were dehydrated and embedded in diethyleneglycol for sectioning. Sections were stained with 0.1% hematoxylin as counterstain.
In Vivo Induction of Ectopic Chondrogenesis
Eggs were windowed at stage 28 HH, and the right leg bud was exposed. Affi-Gel blue (Bio-Rad) beads bearing 0.01 mg/ml TGFβ1, or 0.01 mg/ml TGFβ2 (R&D Systems), were implanted in the third interdigit of the right leg. After manipulation, eggs were sealed and further incubated until processing. At different time intervals the treated interdigit and the contralateral controls were dissected free for qPCR analysis. TGFβ treatments induce ectopic cartilages in 100% of the treated interdigits. The ectopic cartilage can be detected by cartilage staining as soon as 10–12 h after the treatment. By 2 or 3 days after the treatment the ectopic cartilage attains the morphology of an extra digit.
Antibodies, Immunolabeling, and Confocal Microscopy
The following primary polyclonal rabbit antibodies were used: phospho-Smad2 (Ser465/467, Cell Signaling); phospho-Smad3 (Abcam); panHistone (Roche Applied Science); LTBP1 (Santa Cruz Biotechnology); and monoclonal antibody for Fibrillin 2 (JB3, Hybridoma Bank). For immunolabeling, samples were fixed in 4% paraformaldehyde. For double labeling purposes, we performed actin staining using 1% of Phalloidin-TRITC (Sigma). Details for staining procedures have been described previously (37). Samples were examined with a laser confocal microscope (Leica LSM 510) by using Plan-Neofluar 10×, 20×, or Plan-Apochromat 63× objectives, and an argon ion laser (488 nm) to excite fluorescein isothiocyanate fluorescence and an HeNe laser (543 nm) to excite Texas Red.
Cell Nucleofection
For gain-of-function experiments we used a construct based on the coding sequence of the human Tgif1 gene cloned into the pCMV5 vector, previously shown to display functional conservation in chicken (38). For this purpose limb mesodermal cells were electroporated by using a Cell Nucleofector kit (Lonza) following the manufacturer's instructions. Control nucleofections using pCMV5 vector were performed in all experiments.
For loss-of-function experiments limb mesodermal cells obtained from mouse embryos at day 10.5 post coitus were nucleofected with a combination of small interference RNAs with proved efficiency in silencing mouse Tgif1 gene (Santa Cruz Biotechnology).
In both cases cells were cultured following the micromass culture protocol described above. Cultures were incubated for 4 or 5 days and then processed for qPCR analysis or Alcian blue staining and histology.
In Situ Hybridization
In situ hybridization was performed in whole mount or in 100-μm vibratome sectioned specimens. Samples were treated with 10 μg/ml proteinase K for 20–30 min at 20 °C. Hybridization with digoxigenin-labeled antisense RNA probes was performed at 68 °C. Alkaline phosphatase-conjugated anti-digoxigenin antibody (dilution 1:2000) was used (Roche Applied Science). Reactions were developed with 5-bromo-4-chloro-3-indolyl phosphate/nitro blue tetrazolium substrate (Roche Applied Science). Probes for Tgif1 and SnoN were obtained by PCR (primers provided upon request). Probes for Tgfβ2 and Tgfβ3 were employed in previous studies (9).
Real-time qPCR for Gene Expression Analysis
In each experiment total RNA was extracted and cleaned from specimens using the RNeasy Mini Kit (Qiagen). RNA samples were quantified using a spectrophotometer (Nanodrop Technologies ND-1000). First strand cDNA was synthesized by reverse transcription-PCR using random hexamers and Moloney murine leukemia virus reverse transcriptase (Fermentas). The cDNA concentration was measured in a spectrophotometer (Nanodrop Technologies ND-1000) and adjusted to 0.5 μg/μl. qPCR was performed using the Mx3005P system (Stratagene) with automation attachment. In this work, we have used SYBR Green (Takara)-based qPCR. Gapdh had no significant variation in expression across the samples set and therefore was chosen as the normalizer in our experiments. Mean values for -fold changes were calculated for each gene. Expression level was evaluated relative to a calibrator according to the 2−(ΔΔCt) equation (39). Each value in this work represents the mean ± S.E. of at least three independent samples obtained under the same conditions. Samples consisted of four micromass cultures or twelve interdigital spaces. Data were analyzed using one-way analysis of variance followed by Bonferroni tests for post-hoc comparisons, and Student's t test for gene expression levels in overexpression experiments. Statistical significance was set at p < 0.05. All the analyses were done using SPSS for Windows version 15.0. Primers for qPCR were as follows: for Aggrecan, 5′-aggagagacatcaggcatgg-3′ and 5′-atctccagcactccagaagc-3′; for Sox9, 5′-gaggaagtcggtgaagaacg-3′ and 5′-gatgctggaggatgactgc-3′; for Scleraxis, 5′-caccaacagcgtcaacacc-3′ and 5′-cgtctcgatcttggacagc-3′; for Tenomodulin, 5′-atgcagaagcatccaagacc-3′ and 5′-aagagcacgaggatgagagc-3′; for Tgif1, 5′-ctctcctaccacgaggatgc-3′ and 5′-gtgcaacatccaccagtagc-3′; for Tgif2, 5′-caaccagttcaccatctctcg-3′ and 5′-gaggaaccaccagcattcc-3′; for SnoN (SKIL), 5′-acctgcctcctatccagagc-3′ and 5′-ccacctcttgcagaatgagc-3′; and for I-Smad 7, 5′-ggctgtactctgtccaagagc-3′ and 5′-cagctggcttctgttgtcc-3′.
RESULTS
TGFβ Signaling Is Active in the Prechondrogenic Mesenchyme
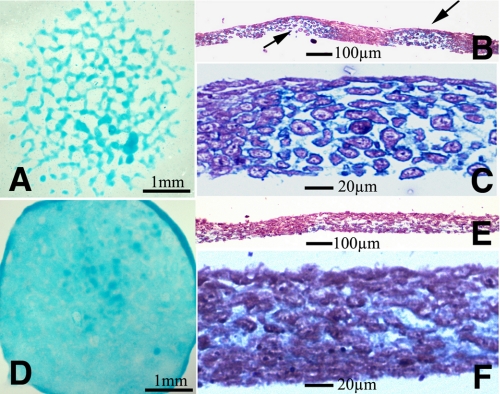
Here we have employed primary cultures of limb undifferentiated mesenchyme from the progress zone mesoderm of stage 25 leg buds platted at high density, to compare the effects of TGFβs on chondrogenesis and tendon formation (tenogenesis/fibrogenesis). This culture system (named micromass cultures) has been widely employed to study the different steps of cartilage differentiation (40). Within the first 2 days of culture, mesenchymal cells undergo condensation forming numerous prechondrogenic aggregates. From the end of the second day of culture on, the cells of the core of the aggregates begin chondrogenic differentiation becoming rounded and secreting specific cartilage matrix components. Hence, progression of the chondrogenic outcome can be easily monitored within the following days of culture, by specific staining of the cartilage extracellular matrix with Alcian blue (Fig. 2A).
FIGURE 2.
Effect of exogenous TGFβs in limb mesenchyme micromass cultures. Five-day-old micromass cultures representative of control (A–C) and cultures treated with TGFβ1 at the beginning of day 3. A shows the characteristic nodular pattern of the control cultures stained for cartilage with Alcian blue. B and C are semi-thin histological sections to show the presence of cartilage nodules in the culture. B is a low magnification view showing two cartilage nodules (arrows) separated by a fibrous like tissue. C is a detailed view of a cartilage node showing the rounded morphology of chondrocytes and the Alcian blue-positive extracellular matrix. D–F illustrate the morphology of the experimental micromasses to show the absence of cartilage nodes. Note the uniform and weak Alcian blue staining in D and the fibrous appearance of the tissue in the semi-thin sections (E and F).
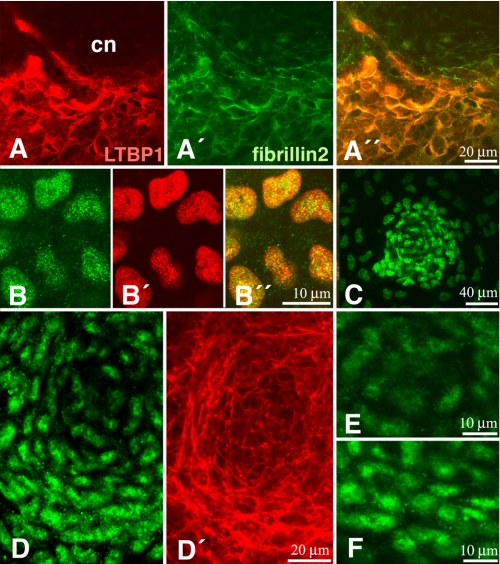
It is known that TGFβ genes are expressed in micromass cultures (17). However the spatial distribution of the active TGFβ-signaling domains in the cultures remains unknown. Thus, to unravel the signaling distribution pattern, we have employed two different approaches. First, we have explored the distribution within the micromass cultures of latent TGFβ-binding protein 1 as a marker of zones of active TGFβ delivery. Second, we have analyzed by immunofluorescence the distribution of phosphorylated Smad2 and -3. Latent TGFβ-binding protein 1 is a polypeptide, associated with fibrillins in the extracellular matrix and required for storing and activating TGFβ ligands in the pericellular space (41). As shown in Fig. 1A, latent TGFβ-binding protein 1 immunolabeling appears associated with fibrillin2 showing a characteristic distribution in zones lacking cartilage and in the contour of the differentiating cartilage nodules. In consistency with this finding, nuclear labeling for p-Smad3 (Fig. 1B) was very intense in prechondrogenic nodules (Fig. 1C) during the first 2 days of culture, when poor chondrogenic differentiation has occurred yet. During the next days of culture, the rounded cells in the core of chondrogenic nodes, showing the characteristic cortical actin cytoskeleton of initial chondrogenic differentiation, displayed little nuclear staining for p-Smad3 (Fig. 1, D and E). However, perinodular cells, displayed an intense nuclear p-Smad3 labeling (Fig. 1, D and F). These cells are characterized by an elongated morphology and a cytoskeleton very rich in actin fibers, indicative of cellular rearrangements involved in cell condensation.
FIGURE 1.
The TGFβ pathway in micromass cultures. A, A′, and A″, immunostaining of LTPB1 (red, A) and Fibrillin 2 (green, A′) in a 4-day micromass culture showing the preferential location of these components around the core of a chondrogenic node (cn). B and B″, immunostaining for p-Smad 3 (green, B) and the nuclei marker pan-histone (red, B′) to illustrate the specific nuclear distribution of p-Smad3 (B″; merge) in a prechondrogenic aggregate of a 2-day-old micromass culture. C, p-Smad3 immunolabeling of an incipient forming node of 1-day micromass culture. Note the strong labeling of pSmad3 in the prechondrogenic aggregation. D and D′, chondrogenic node at an intermediate stage of differentiation (3-day-old micromass culture) showing intense p-Smad3 immunolabeling in the peripheral cells and weak labeling in the core of the node (D). Actin fibers have been labeled with phalloidin (red, D′) for a better distinction of the central chondrocytes and the peripheral elongated cells. E and F, detailed view of the nuclear p-Smad3 immunolabeling in the cells of the core (E) and the periphery (F) of a chondrogenic node in the course of differentiation.
TGFβ Treatment Transforms Cartilage Aggregates into Fibrous Tissue
The effect of TGFβs on micromass cultures was analyzed when most cells have initiated overt chondrogenic differentiation. For this purpose we selected micromass cultures at the beginning of day three of culture when they undergo progressive differentiation into cartilage, forming nodules positive for Alcian blue staining. Under these conditions, addition of TGFβ1 or TGFβ2 to the medium was followed by intense loss of cartilage nodules. After 3 days of additional culture, the treated cultures appeared weakly but uniformly stained with Alcian blue, contrasting with the nodular staining pattern observed in the control cultures (Fig. 2, A and D). Histological sections showed that the characteristic presence of cartilage nodules in controls (Fig. 2, B and C) was substituted in the experimental cultures, by a tissue of fibrous appearance still containing some, although weak Alcian blue-positive matrix, but lacking nodules of rounded chondrocytes (Fig. 2, E and F).
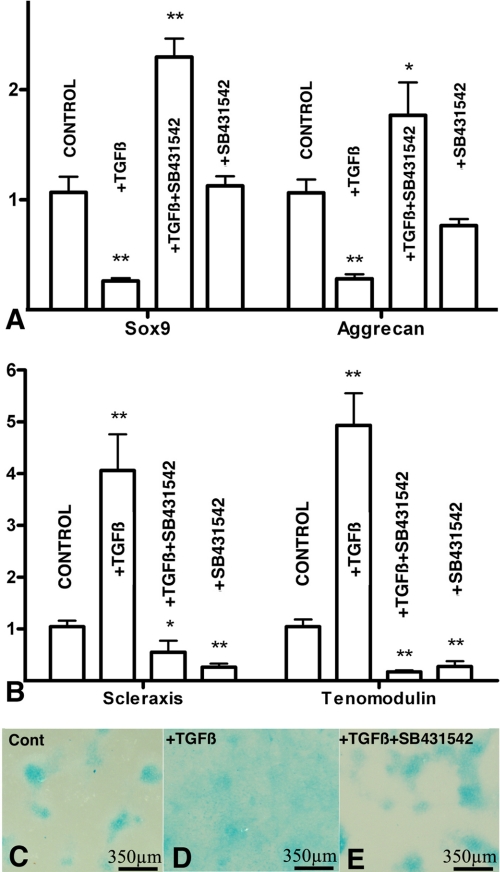
To better characterize the molecular basis of this inhibitory effect of TGFβ signaling on chondrogenesis, we have analyzed by qPCR changes in the expression of Sox9 and Aggrecan, which are canonical chondrogenic markers and Scleraxis and Tenomodulin as tenogenic markers (42). As shown in Fig. 3 (A and B) we observed a significant reduction in the expression of cartilage markers (Fig. 3A) accompanied by an intense up-regulation of the tendon markers Scleraxis and Tenomodulin (Fig. 3B). To explore the intracellular pathway responsible for these changes in gene expression, TGFβ treatments were performed in combination with the Smad2 and -3 specific inhibitor SB431542. Under these conditions the positive and negative regulation of tenogenic and chondrogenic markers, respectively, were not only blocked but even significantly reverted (Fig. 3). In consistence with this finding, the uniform fibrous staining pattern of the micromass cultures treated with TGFβ was reverted to a nodular chondrogenic pattern when TGFβs were added in combination with SB431542 (Fig. 3, C–E), but not when combined with inhibitors of p-38 MAPK or MEK (not shown). These findings indicate that the profibrogenic effect of TGFβ is mediated by Smad signaling and reveal the occurrence of an alternative prochondrogenic intracellular signaling cascade, which is directly or indirectly activated by TGFβs but inhibited by the canonical Smad pathway. The physiological significance of this hypothetical prochondrogenic pathway requires further investigation, because expression of chondrogenic markers was not significantly regulated after treatment with SB431542 alone (Fig. 3A).
FIGURE 3.
Smad2 and -3 signaling modulate the tenogenic versus chondrogenic fates of limb mesenchymal micromass cultures. A and B, qPCR analysis of chondrogenic (A) and tenogenic (B) markers from 5-day-old micromass cultures treated at day 3 with TGFβ2, with TGFβ2 plus the Smad2 and -3 inhibitor SB431542, or with SB431542 only. A shows levels of expression of Aggrecan and Sox9, and B shows the expression of Scleraxis and Tenomodulin. Expression of each gene in control cultures was used as calibrator. Note that TGFβ treatments drastically inhibit the expression of chondrogenic markers while promoting the expression of tenogenic genes. In addition, treatments with TGFβ in combination with SB431542 not only abrogate these regulations but also promote the expression of the chondrogenic genes and down-regulates the tenogenic markers. Changes in the expression of chondrogenic markers were not appreciated by treatments with SB431542 alone, but tenogenic markers were down-regulated most likely reflecting the inhibition of a physiological tenogenic influence of endogenous TGFβs. *: p < 0.05; **: p < 0.01. C–E, detailed view of 5 days micromass cultures incubated in control media (C), treated at day 3 with TGFβ2 (D), or with TGFβ2 plus SB431542 (E). Note that chondrogenic nodes disappear after TGFβ treatments and are restored in co-treatments with the Smad inhibitor.
TGFβ/Smad Signaling Is a Direct Transcriptional Regulator of Scleraxis and Sox9 Modulated by Transcriptional Co-repressors
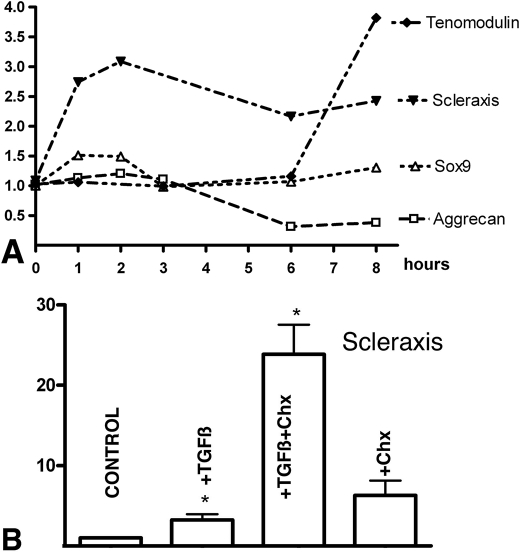
To determine the time course of gene regulation in experimental micromass cultures, qPCR analysis was performed at different time points after addition of 10 ngr/ml TGFβs from the third day of culture (Fig. 4A). Up-regulation of Scleraxis was detectable within the first hour after application of TGFβ, but negative regulation for Sox9 was not observed within the first 8 h of treatment. These findings suggest that the negative effect of TGFβs on Sox9 expression is secondary to other modifications or requires longer exposures to TGFβ. In fact, a mild increase in the expression of Sox9 was appreciable 1 and 2 h after the addition of TGFβs into the culture medium. Negative regulation of Aggrecan by TGFβs has been previously reported (17), however here we show that this negative regulation precedes that of Sox9 despite being the most precocious genetic marker of cartilage (43). Interestingly regulation of Aggrecan, though in the opposite direction, follows a similar timing than that of Tenomodulin, which is stimulated by 6 h of treatment. Again, these findings indicate that the differentiation of the culture shifts from chondrogenic toward tendinous-like tissue.
FIGURE 4.
Time course of gene regulation and the existence of TGFβ modulators. A shows the relative gene expression levels quantified by qPCR of Aggrecan, Sox9, Scleraxis, and Tenomodulin in the first 8-h period after addition of TGFβ1 (10 ng/ml) to 3-day-old micromass cultures. Expression of each gene in control cultures was used as calibrator. Note the precocious up-regulation of Scleraxis from the first hour after the treatment. B, the levels of expression of Scleraxis quantified by qPCR in micromass cultures treated for 2 h at the beginning of day 3. Bars from left to right correspond to expression levels in control cultures; cultures treated with 10 ng/ml TGFβ1; cultures treated with 10 ng/ml TGFβ1 30 min after adding 20 μg/ml cycloheximide; and cultures treated with only 20 μg/ml cycloheximide. Note the dramatic increase in the expression of Scleraxis when TGFβ treatment is combined with inhibition of protein synthesis by cycloheximide, suggesting the existence of a TGFβ-repressive modulator of TGFβ action on Scleraxis expression. *, p < 0.05.
To check whether the rapid regulation of Scleraxis by TGFβs was caused at transcriptional level, we analyzed the effect of TGFβ in micromasses preincubated with cycloheximide to inhibit de novo protein synthesis. After 2 h of culture this combined treatment caused a dramatic up-regulation of Scleraxis (up to 25 times (Fig. 4B)). Regulation of Scleraxis by addition of cycloheximide alone was not significantly modified, suggesting that TGFβs promote not only a positive transcriptional regulation of Scleraxis, but also a potent inhibitor of TGFβ signaling, which would act in a negative feedback loop.
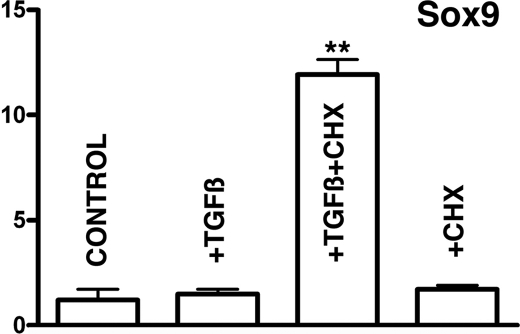
The intense up-regulation of Scleraxis following inhibition of protein synthesis prompted us to examine if expression of Sox9 was influenced in the same fashion. As shown in Fig. 5, Sox9 was up-regulated up to 11-fold in conditions of inhibition of protein synthesis. This up-regulation was not observed adding cycloheximide without TGFβs.
FIGURE 5.
In absence of protein synthesis TGFβ signaling up-regulates Sox9. Shown are the levels of expression of Sox9 quantified by qPCR in micromass cultures treated with TGFβ for 2 h at the beginning of day 3. Bars from left to right correspond to expression levels in control cultures; cultures treated with 10 ng/ml TGFβ1; cultures treated with 10 ng/ml TGFβ1 30 min after adding 20 μg/ml cycloheximide; and cultures treated with only 20 μg/ml cycloheximide. Note the dramatic increase in gene expression when TGFβ treatment is combined with inhibition of protein synthesis with cycloheximide, suggesting the existence of a TGFβ-repressive modulator of TGFβ action on Sox9 expression. **, p < 0.01.
Regulation of the TGFβ Transcriptional Modulators Tgif1 and SnoN in Treated Micromass Cultures
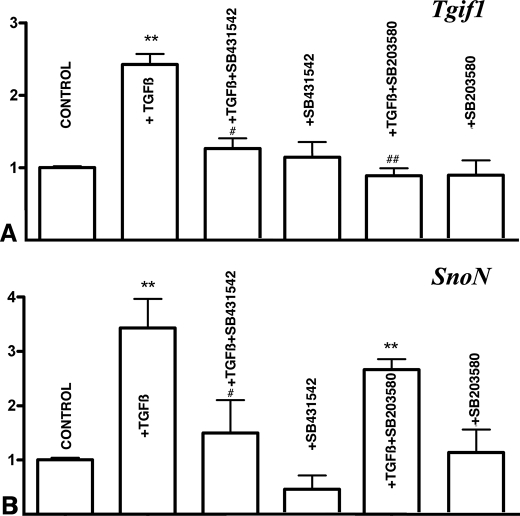
The above described findings moved us to explore the expression and regulation in the cultures of signals able to modulate TGFβ signaling. We detected the expression of two potent negative regulators of TGFβ-signaling, Tgif1 (44) and SnoN (45), which were up-regulated in the first hour after the treatment with TGFβs (Fig. 6, A and B). In both cases up-regulation was drastically reduced if TGFβs was added in combination with SB431542 to inhibit Smad signaling. In addition, up-regulation of Tgif1 was also reduced, by adding the p38 inhibitor SB203580 in combination with TGFβ (Fig. 6A). Other potential repressors of TGFβ-signaling explored included Tgif2 and I-Smad7, but their expression in the cultures was not modified within the first 3 h of treatment with TGFβs (not shown).
FIGURE 6.
Up-regulation of Tgif1 and SnoN in the treated micromasses. A and B, qPCR analysis of Tgif1 (A) and SnoN (B) gene expression in 3-day-old micromasses treated for 1 h with TGFβ alone or in combination with inhibitors of Smad2 and -3 (SB431542) or p38 MAPK (SB203580). Note that TGFβ up-regulation of Tgif1 is abolished by inhibitor of both Smad and p38MAPK (A) while up-regulation of SnoN is only abolished by the inhibitor of Smad signaling (B). **, p < 0.01 treated versus control cultures. #, p < 0.05; ##, p < 0.01 TGFβ-treated versus cultures treated with TGFβ plus the Smad or p38 inhibitors.
Expression of Tgif1 and SnoN in the Developing Limb and Gene Regulation during Experimentally Induced Chondrogenesis
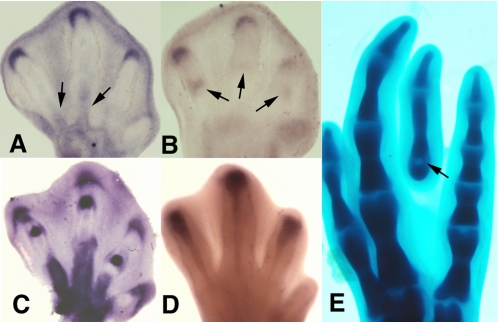
To establish the relevance of the in vitro studies to the in vivo situation we first examined the expression of Tgif1 and SnoN genes in the developing limb. As shown in Fig. 7 (A and B), both genes exhibited expression domains around the tip of the growing digit cartilage primordia. In addition SnoN was also expressed in the developing joints (Fig. 7B) and Tgif1 in the blastemas of the digit tendons (Fig. 7A). All these domains are coincident with the domains of expression of TGFβ 2 and TGFβ 3 genes (Fig. 7, C and D).
FIGURE 7.
Tgif1 and SnoN are co-expressed with Tgfβ2 and Tgfβ3 in the developing digits. A, expression of Tgif1 at the tip of the developing digits and in the tendon blastemas (arrows) at stage 30 HH. B, expression of SnoN in the developing autopod at stage 29 HH. Note the crescent domain at the digit tips, and more reduced labeling in the prospective joint regions (arrow). C and D, in situ hybridizations of chick embryo leg autopods at stage 30 HH, illustrating the characteristic domains of Tgfβ2 in the digit tip, joints, and tendons (C) and Tgfβ3 in the developing tendons. E, image shows the formation of an ectopic digit in the third interdigital space 3 days after the implantation of a TGFβ-bead (arrow) at stage 28 HH.
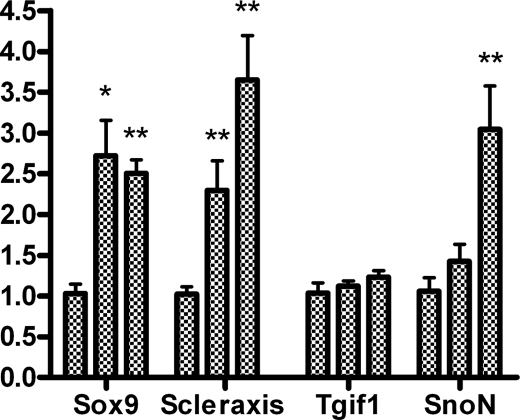
In previous studies we have observed that interdigital application of beads bearing TGFβs induces the formation of ectopic digits (Fig. 7E) (14). Hence we selected this experimental model of TGFβ-induced chondrogenesis to compare early changes in gene regulation in the treated interdigits with findings obtained in micromass cultures. As shown in Fig. 8, at difference of expression changes observed in the treated cultures, not only Scleraxis but also Sox9 appeared significantly up-regulated in the first hour after bead implantation. Furthermore, at difference of observations in the culture conditions neither Tgif1 nor SnoN were up-regulated in the first hour after bead implantation. Three hours after the treatment up-regulation of SnoN was appreciable but Tgif1 was not. Up-regulation of Tgif-1 was appreciated 8 h after the implantation of the TGFβ-bead when the ectopic cartilage is already formed.
FIGURE 8.
Gene regulation in the interdigital space preceding the formation of an ectopic cartilage after local treatment with TGFβ2. qPCR analysis of the expression of Sox9, Scleraxis, Tgif1, and SnoN in experimental interdigits, 1 and 3 h after the implantation of a TGFβ-bead. For each gene the first bar illustrates the expression in the control untreated interdigit, the second bar corresponds to interdigits treated for 1 h, and the third bar corresponds to interdigits treated for 3 h. Note that TGFβ treatments up-regulate Sox9 and Scleraxis from the first hour, whereas SnoN is regulated at 3 h. Tgif1 is not up-regulated in this short time period of treatment. *, p < 0.05; **, p < 0.01.
Tgif1 Mimics the Profibrogenic Effects of TGFβ Treatments
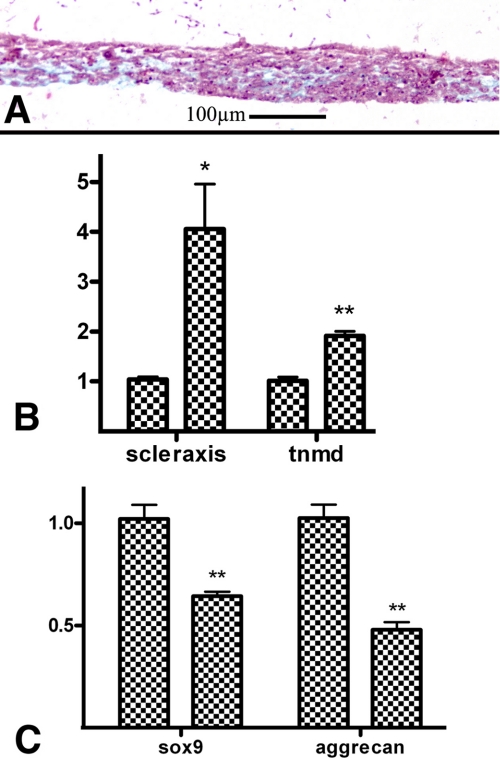
In the above described results we observed that the profibrogenic effect of TGFβ in micromass cultures correlated with an early up-regulation of Tgif1. To further explore this finding we analyzed the differentiation outcome and gene regulation in micromass cultures of limb mesodermal cells overexpressing Tgif1 gene. For this purpose micromass cultures were set up from limb mesodermal cells nucleofected with the expression vector for Tgif1 gene or with the empty vector for controls. In all experiments after 4 days of culture the expression of the transgene was over 18-fold with respect to the control. Under these experimental conditions the presence of chondrogenic nodules was reduced, and the tissue acquired a predominant fibrous appearance in histological sections (Fig. 9A). In consistence with this morphology expression of tendon markers Scleraxis and Tenomodulin were up-regulated (Fig. 9B). In contrast expression of chondrogenic markers were moderately, but significantly, reduced (Fig. 9C).
FIGURE 9.
Micromass cultures of limb mesodermal cells overexpressing Tgif1 undergo fibrogenic differentiation. A, histological section of a 4-day-old micromass culture of limb mesodermal cells transfected with Tgif1. Note the fibrous appearance of the culture in comparison with the chondrogenic outcome of control micromass cultures (Fig. 2B). B and C, qPCR analysis of tenogenic (B) and chondrogenic (C) markers in 4-day-old micromass culture of limb mesodermal cells transfected with Tgif1 (right bar for each gene) in comparison with cultures of mesodermal cells transfected with the empty vector (left bar for each gene). Note the intense up-regulation of Scleraxis and Tenomodulin (A) and the moderate down-regulation of Sox9 and Aggrecan (C). *, p < 0.05; **, p < 0.01.
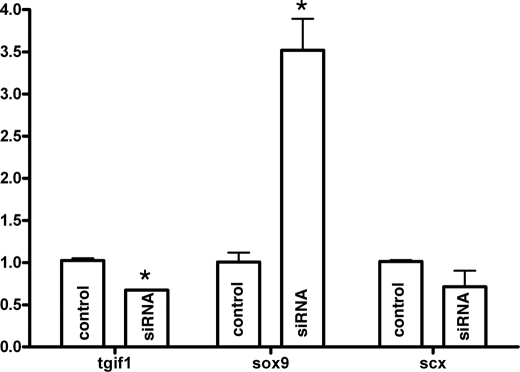
Tgif1 silencing experiments performed in micromass cultures of limb mesoderm of mice embryos at day 10.5 post coitus nucleofected with Tgif1 small interference RNA were also consistent with a role of this gene in fibrogenesis. As shown in Fig. 10, Sox9 gene expression appeared significantly up-regulated after 4 days of culture indicating that chondrogenesis was promoted after functional reduction of Tgif1 gene. However, the expression of fibrogenic marker Scleraxis was not significantly down-regulated suggesting that a reduced number of Tgif1 transcripts is enough to sustain the expression of Scleraxis in the limb mesoderm.
FIGURE 10.
Silencing Tgif1 up-regulates the expression of chondrogenic markers. qPCR analysis of the expression of Tgif1, Sox9, and Scleraxis in 4-day-old micromass cultures of mouse limb mesodermal cells transfected with small interference RNA for Tgif1 gene. Note that for Tgif1 silencing of 40% up-regulation of Sox9 attains significant levels while down-regulation of Scleraxis remains below significant levels. *, p < 0.05.
DISCUSSION
In a very recent report Pryce et al. (34) provide genetic evidence in the mouse for an essential role of TGFβs in the formation of the tendons. This study extends their findings to the avian embryos and provides novel insights to understand the mechanism by which TGFβ signaling regulates the formation of the different skeletal connective tissues. We have employed micromass cultures of embryonic limb mesenchyme as an in vitro assay that replicates the chondrogenic events occurring in vivo (40). Using this assay, different studies have reported a chondrogenic promoting influence of exogenous TGFβs added to the medium of cultures of undifferentiated limb mesenchyme (18–23) and other cell lineages (24, 25). However, other studies have shown that TGFβs inhibit chondrogenesis in this culture system (13, 26–28). This dual effect of TGFβs on chondrogenesis has been related with the stage of differentiation of the cultured cells at the time of treatment (17, 21, 46), but the molecular and cellular basis of such opposite effects remains unknown. TGFβs are also known to exert stage-specific opposite effects in other physiological processes (47), and genetic analysis in mice revealed the existence of cartilages in the face dependent (condilar, coronoid, and angular cartilages) and independent (nasal septum and Merckel's cartilage) of TGFβ signaling (33). Here we show that treatment of the micromass cultures with TGFβs at the initial stages of cartilage differentiation transforms the cultures into a fibrous-like tissue lamina. Taking into account that, in the developing limb, tendon and cartilage progenitors have the same origin in the lateral plate mesoderm (48), our findings indicate that cells in the initial stages of chondrocyte differentiation retain plasticity to be reprogrammed toward the fibroblastic lineage. The conversion of chondrocytes into fibroblastic-like cells is a phenomenon observed during culture passages to propagate primary cultures of chondrocytes (49).
Cartilage and tendons constitute two specialized forms of connective tissue, sharing molecular mechanisms at initial stages of differentiation (42, 50–52). Thus, several chondrogenic markers such as fibronectin, tenascin, and neural cell adhesion molecule (53) are also characteristic markers of the fibrous connective tissues (54). It is therefore likely that some molecular and/or cellular events promoted by TGFβ signaling may be also common for both pathways of connective tissue differentiation. Here we have detected that latent TGFβ-binding protein 1, a matrix component implicated in storing and targeting TGFβs in the extracellular matrix, is specifically distributed around the prechondrogenic aggregates, and p-Smad3 immunolabeling is concentrated in cells at the earliest stages of prechondrogenic aggregation and in the cells occupying the contour of the differentiating cartilage nodules. This finding is consistent with the functional role of TGFβ signaling in the modulation of the pattern of appendicular chondrogenesis proposed by Newman and others (18, 55). In a first step, TGFβs may promote cell aggregation, which is a cellular event required both for chondrogenesis and fibrogenesis (21, 50, 56). In a second step, TGFβs would limit the expansion of the cartilage aggregates in a fashion consistent with the reactor-diffusion model for cartilage morphogenesis proposed by the work of Newman and Bhat (55). Our findings indicate that this last effect may be associated with the differentiation of the mesenchymal tissue located around the cartilages toward fibrosis, to form the perichondrium, and eventually the tendons and the ligaments.
The changes in gene expression detected in the treated cultures are important to understand the function of TGFβs in skeletal tissue differentiation. We have observed that the antichondrogenic effect of TGFβs is accompanied by intense up-regulation of Scleraxis, and Tenomodulin and by down-regulation of Aggrecan and Sox9. Furthermore, treatments designed to block Smad signaling with SB431542 caused opposite effects on gene regulation and restored the chondrogenic outcome of the cultures treated with TGFβs. This pattern of gene regulation is again in support of a role of TGFβ signaling in the establishment of the fibrous components of the musculoskeletal system. The time course of gene regulation in the treated cultures suggests that changes in the expression of Tenomodulin and Aggrecan are secondary events rather than primary determinants of the cell fate.
To gain insight into the molecular basis accounting for fibrogenesis versus chondrogenesis induced by TGFβs we have compared changes in gene expression using two experimental model systems in which TGFβs induce opposite effects in cells of the same origin. As we have shown here, in mesodermal micromass cultures TGFβ treatments promote fibrogenesis, whereas local application of TGFβs into the interdigital mesoderm induces ectopic chondrogenesis (57). Our findings reveal that differentiation toward fibrogenesis or chondrogenesis in each system is preceded by the differential regulation of Sox9 and Scleraxis. Scleraxis encodes for a basic-helix-loop-helix transcription factor required for the formation of force-transmitting tendons (58, 59), which regulates the expression of Tenomodulin and Collagen type I genes in tendon fibroblasts (60, 61). Furthermore, expression of Scleraxis during the formation of the masticatory apparatus is positively regulated by TGFβs (33, 62). Here we have found the TGFβ treatments up-regulate Scleraxis preceding both fibrogenesis in the micromass cultures and cartilage differentiation during interdigital ectopic chondrogenesis. In contrast Sox9 is down-regulated in the profibrogenic culture model, whereas it is up-regulated preceding interdigital ectopic chondrogenesis. Sox9 is a precocious marker of chondrogenic differentiation (43), which directly regulates the expression of cartilage-specific genes (63), including Aggrecan (64). Sox9 has been shown to be up-regulated by TGFβs in other experimental systems in which this pathway promotes chondrogenesis (33, 43, 65), and miss-expression of Sox9 in the developing limb is followed by the formation of ectopic cartilages (66, 67). In sum, the differential regulation of Sox9 appears to constitute as a central event to divert the prochondrogenic from the profibrogenic effects of TGFβ signaling. According to our findings there are two non-excluding mechanisms by which TGFβs modulate negatively the expression of Sox9 in the profibrogenic experimental conditions. Firstly, the intense up-regulation of Sox9 observed in our experiments after inhibition of protein synthesis suggest that down-regulation of Sox-9 is caused by a parallel activation of TGFβ-signaling repressors. Secondly, the up-regulation of Sox9 after double treatments with TGFβ and the Smad inhibitor SB431542 might reflect the existence of a still uncharacterized prochondrogenic intracellular pathway activated by TGFβ in absence of Smad activation.
There is emerging data showing that TGFβ signaling is modulated in a cell context manner by a variety of cofactors that direct the response of target genes (68, 69). Here we have detected that addition of TGFβ into the culture medium is quickly followed by an intense up-regulation of two TGFβ-signaling repressors, Tgif1 and SnoN. Furthermore we have observed that during digit development both genes are expressed in the joints, tendons, and digit tip, which are zones where cells coming from the progress zone must select between fibrogenic (tendon, joint capsule, and ligaments) or chondrogenic (phalanxes) differentiation. These factors are good candidates to modulate the molecular response to TGFβs in our system (70). Tgif1 is a member of the TALE (three amino acid loop extension) superfamily of homeodomain proteins, which interacts with Smad2 and -3 acting as a transcriptional co-repressor of genes regulated by TGFβs (44). SnoN is an avian representative of the Sno family of proto-oncogenes, which associate with Smad proteins blocking their ability to activate the expression of many target genes through a variety of mechanisms (71). Interestingly, up-regulation of Tgif1 is delayed in the interdigital model of TGFβ-mediated chondrogenesis with respect with that observed in the micromass cultures. Moreover overexpression of this gene in limb mesodermal cells prior to their culture at high density is followed by reduced chondrogenesis and intensification of fibrogenesis, while chondrogenesis was increased when the function Tgif1 was reduced by small interference RNA treatments. Together, these findings are indicative for a role of Tgif1 to direct the differentiation of mesodermal cells subjected to the influence of TGFβ signaling toward fibrogenesis instead of following chondrogenic differentiation. However, it is unlikely that this was the only mechanism modulating fibrogenesis versus chondrogenesis in response to TGFβs, because mice deficient for Tgif1 gene lack skeletal or tendinous phenotypes (72). In addition we have observed that chondrogenic markers are also activated by TGFβ treatments when Smad signaling is blocked with SB431542, suggesting the existence of an alternative intracellular signaling cascade associated with the prochondrogenic influence of TGFβs. Moreover Tgif1 was not the only co-repressor induced by TGFβs in limb mesoderm. We have detected up-regulation of SnoN but not of Smad7 or Tgif2 in the micromasses treated with TGFβs. The functional significance of SnoN was not addressed in this study, however, its expression pattern in the developing joints is suggestive for an additional role of this repressor in the selection of cell fates associated with the formation of joints.
Acknowledgments
We thank Montse Fernandez Calderon and Sonia Perez Mantecon for excellent technical assistance. We are grateful to Dr. S. Newman and Dr. A. Villar for comments and suggestions to this study and to Dr. D. Wotton for kindly gift the Tgif constructs. The monoclonal antibody JB3 developed by Dr D. M. Fambrough was obtained from the Developmental Studies Hybridoma Bank (University of Iowa).
This work was supported by the Sciences and Innovation Ministry (Grant BFU2008-03930 to J. M. H.).
- TGFβ
- transforming growth factor β
- MAPK
- mitogen-activated protein kinase
- HH
- Hamburger and Hamilton stages
- MEK
- mitogen-activated protein kinase/extracellular signal-regulated kinase kinase
- TRITC
- tetramethylrhodamine isothiocyanate
- qPCR
- quantitative PCR.
REFERENCES
- 1.Halper J., Burt D. W., Romanov M. N. (2004) Growth Factors 22, 121–122 [DOI] [PubMed] [Google Scholar]
- 2.Verrecchia F., Mauviel A. (2002) J. Invest. Dermatol. 118, 211–215 [DOI] [PubMed] [Google Scholar]
- 3.Tuli R., Tuli S., Nandi S., Huang X., Manner P. A., Hozack W. J., Danielson K. G., Hall D. J., Tuan R. S. (2003) J. Biol. Chem. 278, 41227–41236 [DOI] [PubMed] [Google Scholar]
- 4.Thorp B. H., Anderson I., Jakowlew S. B. (1992) Development 114, 907–911 [DOI] [PubMed] [Google Scholar]
- 5.Baffi M. O., Slattery E., Sohn P., Moses H. L., Chytil A., Serra R. (2004) Dev. Biol. 276, 124–142 [DOI] [PubMed] [Google Scholar]
- 6.Minina E., Schneider S., Rosowski M., Lauster R., Vortkamp A. (2005) Gene Expr. Patterns 6, 102–109 [DOI] [PubMed] [Google Scholar]
- 7.Spagnoli A., O'Rear L., Chandler R. L., Granero-Molto F., Mortlock D. P., Gorska A. E., Weis J. A., Longobardi L., Chytil A., Shimer K., Moses H. L. (2007) J. Cell Biol. 177, 1105–1117 [DOI] [PMC free article] [PubMed] [Google Scholar]
- 8.Millan F. A., Denhez F., Kondaiah P., Akhurst R. J. (1991) Development 111, 131–143 [DOI] [PubMed] [Google Scholar]
- 9.Merino R., Gañan Y., Macias D., Economides A. N., Sampath K. T., Hurle J. M. (1998) Dev. Biol. 200, 35–45 [DOI] [PubMed] [Google Scholar]
- 10.Yamagishi T., Nakajima Y., Nakamura H. (1999) Cell Tissue Res. 298, 85–93 [DOI] [PubMed] [Google Scholar]
- 11.Sanford L. P., Ormsby I., Gittenberger-de Groot A. C., Sariola H., Friedman R., Boivin G. P., Cardell E. L., Doetschman T. (1997) Development 124, 2659–2670 [DOI] [PMC free article] [PubMed] [Google Scholar]
- 12.Dünker N., Krieglstein K. (2002) Anat. Embryol. 206, 73–83 [DOI] [PubMed] [Google Scholar]
- 13.Seo H. S., Serra R. (2007) Dev. Biol. 310, 304–316 [DOI] [PMC free article] [PubMed] [Google Scholar]
- 14.Gañan Y., Macias D., Duterque-Coquillaud M., Ros M. A., Hurle J. M. (1996) Development 122, 2349–2357 [DOI] [PubMed] [Google Scholar]
- 15.Hayamizu T. F., Sessions S. K., Wanek N., Bryant S. V. (1991) Dev. Biol. 145, 164–173 [DOI] [PubMed] [Google Scholar]
- 16.Ferguson C. M., Schwarz E. M., Puzas J. E., Zuscik M. J., Drissi H., O'Keefe R. J. (2004) J. Orthop. Res. 22, 687–696 [DOI] [PubMed] [Google Scholar]
- 17.Roark E. F., Greer K. (1994) Dev. Dyn. 200, 103–116 [DOI] [PubMed] [Google Scholar]
- 18.Miura T., Shiota K. (2000) Dev. Dyn. 217, 241–249 [DOI] [PubMed] [Google Scholar]
- 19.Kulyk W. M., Rodgers B. J., Greer K., Kosher R. A. (1989) Dev. Biol. 135, 424–430 [DOI] [PubMed] [Google Scholar]
- 20.Schofield J. N., Wolpert L. (1990) Exp. Cell Res. 191, 144–148 [DOI] [PubMed] [Google Scholar]
- 21.Leonard C. M., Fuld H. M., Frenz D. A., Downie S. A., Massagué J., Newman S. A. (1991) Dev. Biol. 145, 99–109 [DOI] [PubMed] [Google Scholar]
- 22.Chimal-Monroy J., Díaz de León L. (1997) Int. J. Dev. Biol. 41, 91–102 [PubMed] [Google Scholar]
- 23.Zhang X., Ziran N., Goater J. J., Schwarz E. M., Puzas J. E., Rosier R. N., Zuscik M., Drissi H., O'Keefe R. J. (2004) Bone 34, 809–817 [DOI] [PubMed] [Google Scholar]
- 24.Denker A. E., Nicoll S. B., Tuan R. S. (1995) Differentiation 59, 25–34 [DOI] [PubMed] [Google Scholar]
- 25.Johnstone B., Hering T. M., Caplan A. I., Goldberg V. M., Yoo J. U. (1998) Exp. Cell Res. 238, 265–272 [DOI] [PubMed] [Google Scholar]
- 26.Chen P., Carrington J. L., Hammonds R. G., Reddi A. H. (1991) Exp. Cell Res. 195, 509–515 [DOI] [PubMed] [Google Scholar]
- 27.Tsuiki H., Fukiishi Y., Kishi K. (1996) Teratology 54, 191–197 [DOI] [PubMed] [Google Scholar]
- 28.Jin E. J., Lee S. Y., Jung J. C., Bang O. S., Kang S. S. (2008) J. Cell. Physiol. 214, 345–353 [DOI] [PubMed] [Google Scholar]
- 29.Verrecchia F., Mauviel A. (2007) World J. Gastroenterol. 13, 3056–3062 [DOI] [PMC free article] [PubMed] [Google Scholar]
- 30.Wynn T. A. (2007) J. Clin. Invest. 117, 524–529 [DOI] [PMC free article] [PubMed] [Google Scholar]
- 31.Kuo C. K., Petersen B. C., Tuan R. S. (2008) Dev. Dyn. 237, 1477–1489 [DOI] [PMC free article] [PubMed] [Google Scholar]
- 32.Bandyopadhyay A., Kubilus J. K., Crochiere M. L., Linsenmayer T. F., Tabin C. J. (2008) Dev. Biol. 321, 162–174 [DOI] [PMC free article] [PubMed] [Google Scholar]
- 33.Oka K., Oka S., Hosokawa R., Bringas P., Jr., Brockhoff H. C., 2nd, Nonaka K., Chai Y. (2008) Dev. Biol. 321, 303–309 [DOI] [PMC free article] [PubMed] [Google Scholar]
- 34.Pryce B. A., Watson S. S., Murchison N. D., Staverosky J. A., Dünker N., Schweitzer R. (2009) Development 136, 1351–1361 [DOI] [PMC free article] [PubMed] [Google Scholar]
- 35.Newman S. A., Pautou M. P., Kieny M. (1981) Dev. Biol. 84, 440–448 [DOI] [PubMed] [Google Scholar]
- 36.Brand B., Christ B., Jacob H. J. (1985) Am. J. Anat. 173, 321–340 [DOI] [PubMed] [Google Scholar]
- 37.Montero J. A., Lorda-Diez C. I., Gañan Y., Macias D., Hurle J. M. (2008) Dev. Biol. 321, 343–356 [DOI] [PubMed] [Google Scholar]
- 38.Knepper J. L., James A. C., Ming J. E. (2006) Dev. Dyn. 235, 1482–1490 [DOI] [PubMed] [Google Scholar]
- 39.Livak K. J., Schmittgen T. D. (2001) Methods 25, 402–408 [DOI] [PubMed] [Google Scholar]
- 40.Ahrens P. B., Solursh M., Reiter R. S. (1977) Dev. Biol. 60, 69–82 [DOI] [PubMed] [Google Scholar]
- 41.Rifkin D. B. (2005) J. Biol. Chem. 280, 7409–7412 [DOI] [PubMed] [Google Scholar]
- 42.Asou Y., Nifuji A., Tsuji K., Shinomiya K., Olson E. N., Koopman P., Noda M. (2002) J. Orthop. Res. 20, 827–833 [DOI] [PubMed] [Google Scholar]
- 43.Chimal-Monroy J., Rodriguez-Leon J., Montero J. A., Gañan Y., Macias D., Merino R., Hurle J. M. (2003) Dev. Biol. 257, 292–301 [DOI] [PubMed] [Google Scholar]
- 44.Wotton D., Lo R. S., Lee S., Massagué J. (1999) Cell 97, 29–39 [DOI] [PubMed] [Google Scholar]
- 45.Stroschein S. L., Wang W., Zhou S., Zhou Q., Luo K. (1999) Science 286, 771–774 [DOI] [PubMed] [Google Scholar]
- 46.Carrington J. L., Reddi A. H. (1990) Exp. Cell Res. 186, 368–373 [DOI] [PubMed] [Google Scholar]
- 47.Dong Y. F., Soung do Y., Chang Y., Enomoto-Iwamoto M., Paris M., O'Keefe R. J., Schwarz E. M., Drissi H. (2007) Mol. Endocrinol. 21, 2805–2820 [DOI] [PubMed] [Google Scholar]
- 48.Kieny M., Chevallier A. (1979) J. Embryol. Exp. Morphol. 49, 153–165 [PubMed] [Google Scholar]
- 49.Benya P. D., Shaffer J. D. (1982) Cell 30, 215–224 [DOI] [PubMed] [Google Scholar]
- 50.Ros M. A., Rivero F. B., Hinchliffe J. R., Hurle J. M. (1995) Anat. Embryol. 192, 483–496 [DOI] [PubMed] [Google Scholar]
- 51.Salingcarnboriboon R., Yoshitake H., Tsuji K., Obinata M., Amagasa T., Nifuji A., Noda M. (2003) Exp. Cell Res. 287, 289–300 [DOI] [PubMed] [Google Scholar]
- 52.Lincoln J., Lange A. W., Yutzey K. E. (2006) Dev. Biol. 294, 292–302 [DOI] [PubMed] [Google Scholar]
- 53.Chimal-Monroy J., Díaz de León L. (1999) Int. J. Dev. Biol. 43, 59–67 [PubMed] [Google Scholar]
- 54.Chuong C. M., Chen H. M. (1991) Am. J. Pathol. 138, 427–440 [PMC free article] [PubMed] [Google Scholar]
- 55.Newman S. A., Bhat R. (2007) Birth Defects Res. C. Embryo. Today 81, 305–319 [DOI] [PubMed] [Google Scholar]
- 56.Song J. J., Aswad R., Kanaan R. A., Rico M. C., Owen T. A., Barbe M. F., Safadi F. F., Popoff S. N. (2007) J. Cell. Physiol. 210, 398–410 [DOI] [PubMed] [Google Scholar]
- 57.Hurle J. M., Gañan Y. (1986) J. Embryol. Exp. Morphol. 94, 231–244 [PubMed] [Google Scholar]
- 58.Murchison N. D., Price B. A., Conner D. A., Keene D. R., Olson E. N., Tabin C. J., Schweitzer R. (2007) Development 134, 2697–2708 [DOI] [PubMed] [Google Scholar]
- 59.Schweitzer R., Chyung J. H., Murtaugh L. C., Brent A. E., Rosen V., Olson E. N., Lassar A., Tabin C. J. (2001) Development 128, 3855–3866 [DOI] [PubMed] [Google Scholar]
- 60.Shukunami C., Takimoto A., Oro M., Hiraki Y. (2006) Dev. Biol. 298, 234–247 [DOI] [PubMed] [Google Scholar]
- 61.Léjard V., Brideau G., Blais F., Salingcarnboriboon R., Wagner G., Roehrl M. H., Noda M., Duprez D., Houillier P., Rossert J. (2007) J. Biol. Chem. 282, 17665–17675 [DOI] [PubMed] [Google Scholar]
- 62.Anthwal N., Chai Y., Tucker A. S. (2008) Dev. Dyn. 237, 1604–1613 [DOI] [PubMed] [Google Scholar]
- 63.Lefebvre V., Huang W., Harley V. R., Goodfellow P. N., de Crombrugghe B. (1997) Mol. Cell. Biol. 17, 2336–2346 [DOI] [PMC free article] [PubMed] [Google Scholar]
- 64.Sekiya I., Tsuji K., Koopman P., Watanabe H., Yamada Y., Shinomiya K., Nifuji A., Noda M. (2000) J. Biol. Chem. 275, 10738–10744 [DOI] [PubMed] [Google Scholar]
- 65.Furumatsu T., Ozaki T., Asahara H. (2009) Int. J. Biochem. Cell Biol. 41, 1198–1204 [DOI] [PMC free article] [PubMed] [Google Scholar]
- 66.Healy C., Uwanogho D., Sharpe P. T. (1999) Dev. Dyn. 215, 69–78 [DOI] [PubMed] [Google Scholar]
- 67.Akiyama H., Stadler H. S., Martin J. F., Ishii T. M., Beachy P. A., Nakamura T., de Crombrugghe B. (2007) Matrix Biol. 26, 224–233 [DOI] [PubMed] [Google Scholar]
- 68.Wotton D., Massagué J. (2001) Curr. Top. Microbiol. Immunol. 254, 145–164 [PubMed] [Google Scholar]
- 69.Inoue Y., Imamura T. (2008) Cancer. Sci. 99, 2107–2112 [DOI] [PMC free article] [PubMed] [Google Scholar]
- 70.Dai C., Liu Y. (2004) J. Am. Soc. Nephrol. 15, 1402–1412 [DOI] [PubMed] [Google Scholar]
- 71.Luo K. (2004) Curr. Opin. Genet. Dev. 14, 65–70 [DOI] [PubMed] [Google Scholar]
- 72.Bartholin L., Powers S. E., Melhuish T. A., Lasse S., Weinstein M., Wotton D. (2006) Mol. Cell. Biol. 26, 990–1001 [DOI] [PMC free article] [PubMed] [Google Scholar]
- 73.Hamburger V., Hamilton H. L. (1951) J. Morphol. 88, 49–92 [PubMed] [Google Scholar]


