

Abstract
The present study tests the hypothesis that the structure of extracellular domain Loop 2 can markedly affect ethanol sensitivity in glycine receptors (GlyRs) and γ-aminobutyric acid type A receptors (GABAARs). To test this, we mutated Loop 2 in the α1 subunit of GlyRs and in the γ subunit of α1β2γ2GABAARs and measured the sensitivity of wild type and mutant receptors expressed in Xenopus oocytes to agonist, ethanol, and other agents using two-electrode voltage clamp. Replacing Loop 2 of α1GlyR subunits with Loop 2 from the δGABAAR (δL2), but not the γGABAAR subunit, reduced ethanol threshold and increased the degree of ethanol potentiation without altering general receptor function. Similarly, replacing Loop 2 of the γ subunit of GABAARs with δL2 shifted the ethanol threshold from 50 mm in WT to 1 mm in the GABAA γ-δL2 mutant. These findings indicate that the structure of Loop 2 can profoundly affect ethanol sensitivity in GlyRs and GABAARs. The δL2 mutations did not affect GlyR or GABAAR sensitivity, respectively, to Zn2+ or diazepam, which suggests that these δL2-induced changes in ethanol sensitivity do not extend to all allosteric modulators and may be specific for ethanol or ethanol-like agents. To explore molecular mechanisms underlying these results, we threaded the WT and δL2 GlyR sequences onto the x-ray structure of the bacterial Gloeobacter violaceus pentameric ligand-gated ion channel homologue (GLIC). In addition to being the first GlyR model threaded on GLIC, the juxtaposition of the two structures led to a possible mechanistic explanation for the effects of ethanol on GlyR-based on changes in Loop 2 structure.
Alcohol abuse and dependence are significant problems in our society, with ∼14 million people in the United States being affected (1, 2). Alcohol causes over 100,000 deaths in the United States, and alcohol-related issues are estimated to cost nearly 200 billion dollars annually (2). To address this, considerable attention has focused on the development of medications to prevent and treat alcohol-related problems (3–5). The development of such medications would be aided by a clear understanding of the molecular structures on which ethanol acts and how these structures influence receptor sensitivity to ethanol.
Ligand-gated ion channels (LGICs)2 have received substantial attention as putative sites of ethanol action that cause its behavioral effects (6–12). Research in this area has focused on investigating the effects of ethanol on two large superfamilies of LGICs: 1) the Cys-loop superfamily of LGICs (13, 14), whose members include nicotinic acetylcholine, 5-hydroxytryptamine3, γ-aminobutyric acid type A (GABAA), γ-aminobutyric acid type C, and glycine receptors (GlyRs) (10, 11, 15–20) and 2) the glutamate superfamily, including N-methyl d-aspartate, α-amino-3-hydroxyisoxazolepropionic acid, and kainate receptors (21, 22). Recent studies have also begun investigating ethanol action in the ATP-gated P2X superfamily of LGICs (23–25).
A series of studies that employed chimeric and mutagenic strategies combined with sulfhydryl-specific labeling identified key regions within Cys-loop receptors that appear to be initial targets for ethanol action that also can determine the sensitivity of the receptors to ethanol (7–12, 18, 19, 26–30). This work provides several lines of evidence that position 267 and possibly other sites in the transmembrane (TM) domain of GlyRs and homologous sites in GABAARs are targets for ethanol action and that mutations at these sites can influence ethanol sensitivity (8, 9, 26, 31).
Growing evidence from GlyRs indicates that ethanol also acts on the extracellular domain. The initial findings came from studies demonstrating that α1GlyRs are more sensitive to ethanol than are α2GlyRs despite the high (∼78%) sequence homology between α1GlyRs and α2GlyRs (32). Further work found that an alanine to serine exchange at position 52 (A52S) in Loop 2 can eliminate the difference in ethanol sensitivity between α1GlyRs and α2GlyRs (18, 20, 33). These studies also demonstrated that mutations at position 52 in α1GlyRS and the homologous position 59 in α2GlyRs controlled the sensitivity of these receptors to a novel mechanistic ethanol antagonist (20). Collectively, these studies suggest that there are multiple sites of ethanol action in α1GlyRs, with one site located in the TM domain (e.g. position 267) and another in the extracellular domain (e.g. position 52).
Subsequent studies revealed that the polarity of the residue at position 52 plays a key role in determining the sensitivity of GlyRs to ethanol (20). The findings with polarity in the extracellular domain contrast with the findings at position 267 in the TM domain, where molecular volume, but not polarity, significantly affected ethanol sensitivity (9). Taken together, these findings indicate that the physical-chemical parameters of residues at positions in the extracellular and TM domains that modulate ethanol effects and/or initiate ethanol action in GlyRs are not uniform. Thus, knowledge regarding the physical-chemical properties that control agonist and ethanol sensitivity is key for understanding the relationship between the structure and the actions of ethanol in LGICs (19, 31, 34–40).
GlyRs and GABAARs, which differ significantly in their sensitivities to ethanol, offer a potential method for identifying the structures that control ethanol sensitivity. For example, α1GlyRs do not reliably respond to ethanol concentrations less than 10 mm (32, 33, 41). Similarly, γ subunit-containing GABAARs (e.g. α1β2γ2), the most predominantly expressed GABAARs in the central nervous system, are insensitive to ethanol concentrations less than 50 mm (42, 43). In contrast, δ subunit-containing GABAARs (e.g. α4β3δ) have been shown to be sensitive to ethanol concentrations as low as 1–3 mm (44–51). Sequence alignment of α1GlyR, γGABAAR, and δGABAAR revealed differences between the Loop 2 regions of these receptor subunits. Since prior studies found that mutations of Loop 2 residues can affect ethanol sensitivity (19, 20, 39), the non-conserved residues in Loop 2 of GlyR and GABAAR subunits could provide the physical-chemical and structural bases underlying the differences in ethanol sensitivity between these receptors.
The present study tested the hypothesis that the structure of Loop 2 can markedly affect the ethanol sensitivity of GlyRs and GABAARs. To accomplish this, we performed multiple mutations that replaced the Loop 2 region of the α1 subunit in α1GlyRs and the Loop 2 region of the γ subunit of α1β2γ2 GABAARs with corresponding non-conserved residues from the δ subunit of GABAAR and tested the sensitivity of these receptors to ethanol. As predicted, replacing Loop 2 of WT α1GlyRs with the homologous residues from the δGABAAR subunit (δL2), but not the γGABAAR subunit (γL2), markedly increased the sensitivity of the receptor to ethanol. Similarly, replacing the non-conserved residues of the γ subunit of α1β2γ2 GABAARs with δL2 also markedly increased ethanol sensitivity of GABAARs. These findings support the hypothesis and suggest that Loop 2 may play a role in controlling ethanol sensitivity across the Cys-loop superfamily of receptors. The findings also provide the basis for suggesting structure-function relationships in a new molecular model of the GlyR based on the bacterial Gloeobacter violaceus pentameric LGIC homologue (GLIC).
EXPERIMENTAL PROCEDURES
Materials
Adult female Xenopus laevis frogs were purchased from Nasco (Fort Atkinson, WI). Gentamicin, 3-aminobenzoic acid ethyl ester, glycine, GABA, ethanol, zinc chloride, strychnine, picrotoxin, diazepam, and collagenase were purchased from Sigma. All other chemicals used were of reagent grade. Glycine, GABA, and strychnine stock solutions were prepared from powder. Stock solutions of picrotoxin and diazepam were prepared in DMSO and then diluted to an appropriate concentration with the extracellular solution just before use. To avoid adverse effects from DMSO exposure, the final concentration (v/v) of DMSO was not higher than 0.5%. Picrotoxin stocks and solutions were wrapped in foil to avoid UV exposure.
Expression in Oocytes
The amino acid sequences for α1GlyR and δ- and γGABAAR subunits were aligned, and the Loop 2 regions were compared (Table 1). Individual point mutations in the α1GlyR or γGABAAR subunit cDNA were created so that the resulting Loop 2 region matched that of the δGABAAR or the γGABAAR subunits. Xenopus oocytes were isolated and injected with human GlyR cDNAs (1 ng/32 nl) or GABAAR cDNAs (1:1:10 ratio for a total volume of 1 ng of α1β2γ2) cloned into the mammalian expression vector pCIS2 or pBKCMV, as described previously (33), and verified by partial sequencing (DNA Core Facility, University of Southern California). After injection, oocytes were stored in incubation medium (modified Barth's saline supplemented with 2 mm sodium pyruvate, 0.5 mm theophylline, and 50 mg/liter gentamycin) in Petri dishes (VWR, San Dimas, CA). All solutions were sterilized by passage through 0.22-μm filters. Oocytes, stored at 18 °C, usually expressed GlyRs the day after injection and GABAARs 3–4 days after injection. Oocytes were used in experiments for up to 7 days after injection.
TABLE 1.
Loop 2 sequence alignment for the α1GlyR subunit, δ− and γGABAAR subunits, α1nAChR subunit, and GLIC
| Subunit | Position | Sequence |
|---|---|---|
| Human GlyR α1 | 50 | SIAETTMDYR |
| Human GABAAR δ | 43 | HISEANMEYT |
| Human GABAAR γ2 | 64 | PVNAINMEYT |
| Human nAChR α1 | 42 | NVDEVNQIVE |
| GLIC | 29 | SLDDKAETFK |
Native δ-containing GABAARs (α4β2/3δ and α6β2/3δ) have been shown to be sensitive to low ethanol concentrations (1–3 mm) in a variety of preparations (44–51) However, these receptors are difficult to express in oocytes. This topic has been the subject of several reviews (52–54). The goal of the present study was to test the hypothesis that the structure of Loop 2 can markedly affect the ethanol sensitivity of GlyRs and GABAARs. We used the δ Loop 2 as a vehicle for testing this hypothesis. In this context, and given the difficulties described above, we did not include WT δ-containing GABAARs in the current paper.
Whole Cell Two-electrode Voltage Clamp Recordings
Two-electrode voltage clamp recording was performed using techniques similar to those previously reported (33). Briefly, electrodes pulled (P-30; Sutter Instruments, Novato, CA) from borosilicate glass (1.2-mm thick walled filamented glass capillaries (WPI, Sarasota, FL)) were back-filled with 3 m KCl to yield resistances of 0.5–3 megaohms. All electrophysiological recordings were conducted within a chamber that contains a vibration-resistant platform that supports an oocyte bath, two micro positioners (WPI (Sarasota, FL) or Narishige International USA, Inc. (East Meadow, NY)), and bath clamp (33). Oocytes were perfused in a 100-μl oocyte bath with modified Barth's saline with or without drugs via a custom high pressure drug delivery system (Alcott Chromatography, Norcross, GA) at 2 ml/min using OD high pressure PEEK tubing (Upchurch Scientific, Oak Harbor, WA). Oocytes were voltage-clamped at a membrane potential of −70 mV using a Warner Instruments model OC-725C (Hamden, CT) oocyte clamp. A chart recorder (Barnstead/Thermolyne, Dubuque, IA) continuously plotted the clamped currents. The peak currents were measured and used in data analysis. All experiments were performed at room temperature (20–23 °C).
Application of Agonist
For agonist concentration response experiments, WT or mutant GlyRs or GABAARs were exposed to 1 μm to 3 mm glycine or 1 μm to 10 mm GABA for 60 s, using 5–15-min washouts between applications to ensure complete receptor resensitization.
Application of Ethanol
We used a concentration of glycine or GABA producing 10 ± 2% of the maximal effect (EC10). Agonist EC10 was applied as a control pre- and post-ethanol treatment. When testing ethanol potentiation, the oocytes were preincubated with ethanol for 60 s prior to co-application of ethanol and agonist for 60 s (18). Washout periods (5–15 min) were allowed between agonist and drug applications to ensure complete resensitization of receptors. WT and mutant α1GlyR responses were measured across an ethanol concentration range of 1–30 mm. GABAAR responses were measured across an ethanol concentration range of 1–50 mm. Ethanol, in the absence of glycine or GABA, did not significantly affect the holding currents of the GlyRs and GABAARs tested.
Application of Antagonists and Modulators
Zinc Chloride
Oocytes expressing WT, δL2, and γL2 GlyRs were tested for response to low (10 μm) and high (100 μm) concentrations of zinc chloride (ZnCl2), a bimodal allosteric modulator of the GlyR. Glycine EC10 was applied for 60 s. Oocytes were preincubated with ZnCl2 for 60 s, followed by co-application with glycine EC10 for 60 s. Wash-out periods (5–15 min) were allowed between drug applications to ensure complete resensitization of receptors.
Strychnine and Picrotoxin
Oocytes expressing WT, δL2, and γL2 GlyRs were tested for response to the competitive GlyR antagonist strychnine or the noncompetitive GlyR antagonist picrotoxin. Glycine EC10 was applied for 60 s. Oocytes were preincubated with strychnine (50 nm) or picrotoxin (100 μm) for 60 s, followed by co-application with glycine EC10 for 60 s. Washout periods (5–15 min) were allowed between drug applications to ensure complete resensitization of receptors.
Diazepam
Oocytes expressing WT and δL2 GABAARs were tested for response to the benzodiazepine agonist diazepam. GABA EC10 was applied for 60 s. Oocytes were preincubated with diazepam (1 μm) for 60 s, followed by co-application with GABA EC10 for 60 s. Washout periods (5–15 min) were allowed between drug applications to ensure complete resensitization of receptors.
Cell Surface Biotinylation and Immunoblotting
Biotinylation of surface-expressed proteins was modified from a previous protocol published by Chen et al. (55). Four days after cDNA injections, oocytes (15 oocytes/group) were incubated with 1.5 mg/ml membrane-impermeable sulfosuccinimidyl 2-(biotinamido)-ethyl-1,3-dithiopropionate (Pierce) for 30 min at room temperature. After washing once with 25 mm Tris (pH 8.0) and twice with phosphate-buffered saline, oocytes were homogenized in 500 μl of lysis buffer (40 mm Tris (pH 7.5), 110 mm NaCl, 4 mm EDTA, 0.08% Triton X-100, 1% protease inhibitor mixture (Vector Laboratories, Burlingame, CA)). The yolk and cellular debris were removed by centrifugation at 3600 × g for 10 min. Aliquots of the supernatant were mixed with 2× SDS loading buffer and stored at −20 °C to assess total receptor fraction. The remaining supernatant was incubated with streptavidin beads (Pierce) overnight at 4 °C. Beads were washed three times with lysis buffer, and the biotinylated proteins were eluted by heating at 95 °C for 10 min in SDS loading buffer. The surface and total proteins were separated using SDS-PAGE and transferred to polyvinylidene fluoride membranes. The membranes were incubated overnight with rabbit anti-GlyR antibody (1:500 dilution; Chemicon International, Temecula, CA), followed by incubation with the appropriate horseradish peroxidase-conjugated secondary antibody. Protein bands were visualized using enhanced chemiluminescence (Pierce). The blots were then scanned and analyzed to obtain images.
Molecular Modeling
Models of the WT and δL2 mutant GlyRs were built using Discovery Studio 2.1 (Accelrys, San Diego, CA). The GlyR and the mutant sequence with the δGABA Loop 2 were aligned with the “Align multiple sequences” module, a derivative of ClustalW. To ensure compatibility with the literature, a two-step procedure was used to test the alignments. First, we used the alignment of α1GlyR with α1nAChR suggested by Sixma and co-workers (56). Second, we used the alignment of α1nAChR with GLIC suggested by Changeux and co-workers (57, 58). The resulting alignment of GlyR with GLIC proved to be correct (Table 1). We then submitted the two alignments to the “Modeler” module with the restriction that the Cys-loop cysteine disulfide bond (Cys138–Cys152) should be preserved. For each alignment, 10 initial models were produced, and then each of these was subjected to loop refinement to yield a total of 50 models for WT and mutant receptors. The “best” model for each alignment was selected based on total force field PDF energy (a calculated value called the probability density function, which is derived from spatial restraints when building the initial models and can be used to identify high energy regions of the structure). Then each model was further refined with the “Loop refinement” module. At this point, a harmonic restraint of 10 kcal/(mol A2) was applied to all backbone atoms of the homopentamers, and this restraint was maintained for all of the following steps. Both models were optimized to a gradient of 0.0001 kcal/Å in Discovery Studio with a conjugate gradient algorithm using the Accelrys version of the CHARMm force field and the default spherical nonbond cut-off of 14 Å. Then the models were relaxed with 50,000 1-fs steps of molecular dynamics at 300 K. Finally, the models were optimized again as described above. The WT and mutated models had final potential energies of −88,054 and −88,487, respectively. These values indicate that the models are stable. However, due to the extensive changes in amino acids, the energies of the models cannot be compared to determine which is more stable. In both models, intersubunit and intrasubunit interactions of residues in Loop 2 were detected with two methods. First, the hydrogen bond detection module was enabled. Second, all residues within 5 Å of any atom in Loop 2 were selected and manually examined.
Data Analysis
Data for each experiment were obtained from 4–8 oocytes from at least two different frogs. n refers to the number of oocytes tested. Results are expressed as mean ± S.E. Where no error bars are shown, they are smaller than the symbols. We used Prism (GraphPAD Software, San Diego, CA) to perform curve fitting and statistical analyses. Agonist concentration response data were analyzed using non-linear regression analysis (I = Imax [A]nH/([A]nH + EC50nH), where I is the peak current recorded following application of a range of agonist concentrations, [A]; Imax is the estimated maximum current; EC50 is the glycine concentration required for a half-maximal response, and nH is the Hill slope). Data were subjected to Student's t tests, one- or two-way analysis of variance (ANOVA) with Dunnett's multiple comparison or Bonferroni post-tests when warranted. To determine the threshold concentration at which a significant effect of ethanol was first detected in WT and mutant receptors, we compared the absolute values of agonist-induced chloride currents in the presence and absence of ethanol across ethanol concentrations using two-way ANOVA, followed by Bonferroni post-tests. Statistical significance was defined as p < 0.05.
RESULTS
Agonist Concentration Response
GlyRs
Glycine produced inward Cl− currents in WT and mutant GlyRs in a concentration-dependent manner (Fig. 1). There were no significant differences between WT and mutant GlyRs in glycine Imax or Hill slope (Table 2). The δL2 mutation in α1GlyRs caused a significant reduction in EC50 in these receptors compared with WT α1GlyRs. In contrast, the γL2 GlyRs did not differ significantly from WT in terms of EC50. Cell surface biotinylation followed by immunoblotting analysis did not show a significant difference between cell surface biotinylated fraction or total expression of GlyR protein between WT and any of the mutant GlyRs tested (Fig. 2). This suggests that the differences in EC50 of WT versus δL2 GlyRs do not reflect differences in surface expression levels due to receptor internalization.
FIGURE 1.

Concentration-response curves for glycine (1–3000 μm)-activated chloride currents in Xenopus oocytes expressing WT, δL2, and γL2 α1GlyR subunits. Glycine-induced chloride currents were normalized to the maximal current activated by a saturating concentration of glycine (300 μm to 3 mm). The curves represent non-linear regression analysis of the glycine concentration responses in the Loop 2 mutant GlyRs compared with WT α1GlyRs. Details of EC50, Imax, and Hill slope are provided in Table 2. Each data point represents the mean ± S.E.
TABLE 2.
Summary of non-linear regression analysis results for glycine concentration responses in WT, δL2, and γL2 mutant α1GlyRs
Glycine EC50, Hill slope (nH), and maximal current amplitude (Imax) are presented as mean ± S.E. One-way ANOVA revealed no significant differences between WT and δL2 GlyRs in Imax or Hill slope. EC50 in the δL2 GlyRs was significantly reduced compared with α1WT GlyRs.
| Receptor | Imax | Hill slope (nH) | EC50 |
|---|---|---|---|
| nA | μm | ||
| α1WT | 9000 ± 1620 | 1.735 ± 0.5 | 171.962 ± 58 |
| α1δL2 | 8612 ± 2314 | 2.685 ± 0.6 | 14.615 ± 4* |
| α1γL2 | 8795 ± 2600 | 1.405 ± 0.1 | 196.2 ± 18 |
FIGURE 2.

Western blot analysis of total and cell surface protein from Xenopus oocytes expressing WT, δL2, and γL2 α1GlyR subunits. Western blot analysis revealed no differences between WT and mutant GlyRs with respect to total cell lysates and cell surface biotinylated fractions. Results shown are for 1 ng of WT or mutant GlyR cDNA injected into each oocyte. Immunoprecipitates were run on SDS-polyacrylamide gel and then transferred to polyvinylidene difluoride membrane. Blots were then probed with rabbit antibody against the α1 subunit of the human GlyR.
GABAARs
GABA produced inward Cl− currents in WT and mutant GABAARs in a concentration-dependent manner (Fig. 3). The α1β2γ2(δL2) GABAAR mutation caused a non-significant left shift in EC50. There were no significant differences in Imax or Hill slope between WT and mutant GABAARs (Table 3).
FIGURE 3.

Concentration-response curves for GABA (1–10,000 μm)-activated chloride currents in Xenopus oocytes expressing WT and mutant δL2 GABAAR subunits. GABA-induced chloride currents were normalized to the maximal current activated by a saturating concentration of GABA (10 mm). The curves represent non-linear regression analysis of the GABA concentration responses in the α1β2γ2(δL2) GABAARs compared with WT α1β2γ2 GABAARs. Details of EC50, Imax, and Hill slope are provided in Table 3. Each data point represents the mean ± S.E.
TABLE 3.
Summary of non-linear regression analysis results for GABA concentration responses in WT and mutant GABAARs
GABA EC50, Hill slope (nH), and maximal current amplitude (Imax) are presented as mean ± S.E. Student's t test revealed no significant differences between WT and mutant GABAARs in Imax, EC50, or Hill slope.
| Receptor | Imax | Hill slope (nH) | EC50 |
|---|---|---|---|
| nA | μm | ||
| WT α1β2γ2 | 5978 ± 2669 | 1.404 ± 0.2 | 267.76 ± 63 |
| α1β2γ2(δL2) | 3730 ± 1672 | 1.194 ± 0.2 | 234.35 ± 54 |
Ethanol Concentration Response
GlyRs
We predicted that mutating the Loop 2 region in α1GlyRs to the homologous residues from the δGABAAR subunit would increase ethanol sensitivity of α1GlyRs. As predicted, the Loop 2 substitution in WT α1GlyRs reduced the threshold for ethanol sensitivity from 30 mm in WT GlyRs to 1 mm in the δL2 mutant and increased the degree of ethanol potentiation at all concentrations tested (Fig. 4). On the other hand, mutating the Loop 2 region in α1GlyRs to the homologous residues from γGABAAR did not significantly affect ethanol sensitivity compared with WT GlyRs. Therefore, changes in ethanol sensitivity caused by mutating Loop 2 of the α1GlyR to the Loop 2 sequence found in δ- and γGABAAR subunits, respectively, parallel the relative ethanol sensitivities of the GABAARs from which the Loop 2 sequence was taken. Overall, these findings support the notion that the structure of Loop 2 plays a key role in determining ethanol sensitivity in GlyRs.
FIGURE 4.

The δL2 GlyR mutation decreased the threshold for ethanol sensitivity and increased the degree of ethanol potentiation. Mean ± S.E. percentage for ethanol potentiation in WT, δL2, and γL2 GlyRs. Two-way ANOVA followed by Bonferroni post-tests revealed that the δL2 mutation reduced the threshold for ethanol sensitivity from 30 mm in WT α1GlyRs (glycine mean currents = 1013 ± 83 nA versus ethanol mean currents = 1179 ± 121) to 1 mm in δL2 GlyRs (glycine mean currents = 1050 ± 132 nA versus ethanol 1 mm mean currents = 1351 ± 153 nA) and markedly increased the magnitude of the response to ethanol compared with WT GlyRs. The γL2 mutation did not significantly affect receptor response compared with WT GlyRs.
GABAARs
If Loop 2 plays a key role in the ethanol sensitivity of GABAARs, then mutating Loop 2 of the γ subunit of α1β2γ2 GABAARs to the homologous sequence in the δGABAAR subunit should increase ethanol sensitivity of α1β2γ2 GABAARs. As predicted, the δL2 mutation in the γ subunit of GABAARs shifted the threshold for ethanol sensitivity from 50 mm in WT, to 1 mM in the GABAA γ-δL2 mutant receptor and markedly increased the magnitude of the ethanol response compared with WT GABAARs (Fig. 5). Overall, the results support the notion that the structure of Loop 2 plays a key role in determining the ethanol sensitivity of GABAARs.
FIGURE 5.

The δL2 GABAAR mutation decreased the threshold for ethanol sensitivity and increased ethanol potentiation in GABAARs. Mean ± S.E. percentage for ethanol potentiation in WT and mutant GABAARs. Two-way ANOVA followed by Bonferroni post-tests revealed that the δL2 mutation in the γ subunit of native GABAARs shifted the threshold for ethanol sensitivity from 50 mm (GABA mean current = 632.5 ± 11.8 nA versus ethanol mean current = 744 ± 42.6 nA) in WT to 1 mm (GABA mean current = 499 ± 31.4 nA versus ethanol mean current = 622 ± 19.38 nA) in the GABAA γ-δL2 mutant receptor and markedly increased the magnitude of the ethanol response compared with WT GABAARs.
Additional Tests of Receptor Function
Zinc Chloride
Zinc is an allosteric modulator of the GlyR that modulates the receptor in a bimodal manner. Submicromolar to micromolar concentrations of ZnCl2 enhance GlyR function by acting at a high affinity Zn2+ binding site, whereas micromolar concentrations of ZnCl2 ≥100 μm cause inhibition of GlyR function at a low affinity Zn2+ binding site (59, 60). In agreement with previous work, low concentrations of ZnCl2 (10 μm) enhanced EC10 glycine-activated currents, whereas higher concentrations of ZnCl2 (100 μm) inhibited glycine-activated currents in WT GlyRs (Fig. 6). The δL2 mutation did not significantly alter the effects of ZnCl2 at either concentration tested. 100 μm ZnCl2 caused a significantly greater inhibition of glycine-activated currents in the γL2 mutant receptor (Fig. 6).
FIGURE 6.

The δL2 GlyR mutation did not affect biphasic modulation by Zn2+ in GlyRs. Zn2+ allosterically modulated WT, δL2, and γL2 GlyRs in a bimodal manner. 10 μm ZnCl2 caused enhancement of glycine-activated currents, whereas 100 μm ZnCl2 caused inhibition in both WT and mutant GlyRs. One-way ANOVA followed by Dunnett's post-tests revealed no significant differences between WT and δL2 GlyRs with respect to modulation by Zn2+ at either concentration. The response to 10 μm ZnCl2 of γL2 GlyRs did not differ significantly from WT, but the response to 100 μm ZnCl2 was significantly reduced in these receptors. Data are shown as mean ± S.E. percentage of control (where the EC10 control response is 100%).
Strychnine
Strychnine is a competitive antagonist of the glycine binding site in α1GlyRs (61). In order to test if Loop 2 mutations interfered with strychnine binding, oocytes expressing WT and Loop 2 mutant GlyRs were tested for response to 50 nm strychnine. In agreement with previous work (33), strychnine inhibited glycine-activated currents in WT α1GlyRs (Fig. 7). The δL2 mutation did not alter the effects of strychnine on these mutant α1GlyRs. There was a significant increase in strychnine inhibition of glycine-activated currents in the γL2 mutant receptor.
FIGURE 7.
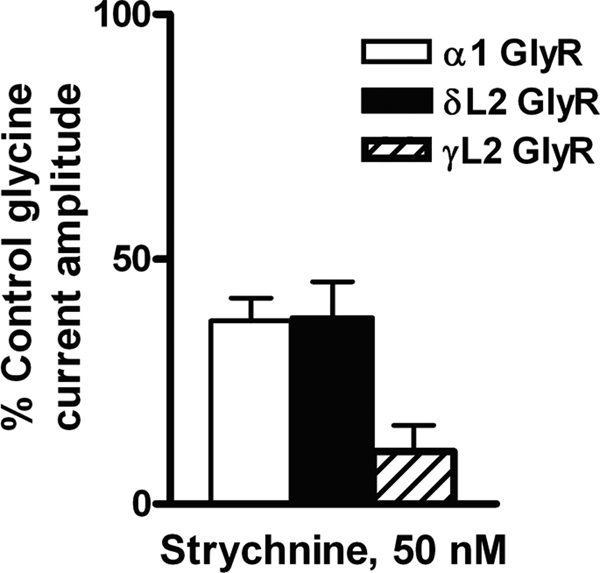
The δL2 GlyR mutation did not affect inhibition by strychnine in GlyRs. 50 nm strychnine inhibited WT, δL2, and γL2 α1GlyRs. One-way ANOVA followed by Dunnett's post-tests showed no significant difference in the degree of strychnine inhibition between WT and δL2 mutant GlyRs. In contrast, strychnine inhibited γL2 GlyRs significantly more than WT GlyRs. Data are shown as mean ± S.E. percentage of control (where the EC10 control response is 100%).
Picrotoxin
Picrotoxin is a plant alkaloid convulsant that inhibits homomeric α1GlyRs with a high potency by blocking the channel pore (62). In order to test if Loop 2 mutations interfered with the effects of picrotoxin, oocytes expressing WT and Loop 2 mutant GlyRs were tested for response to 100 μm picrotoxin. Picrotoxin inhibited glycine-activated currents in WT α1GlyRs (Fig. 8). The δL2 and γL2 mutations did not alter the effects of picrotoxin in α1GlyRs.
FIGURE 8.
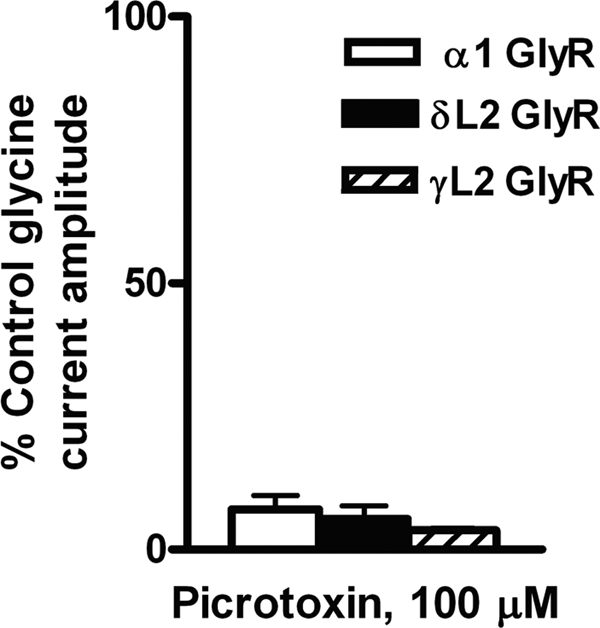
The δL2 GlyR mutation did not affect inhibition by picrotoxin. Exposure to 100 μm picrotoxin inhibited EC10 glycine-activated currents in WT, δL2, and γL2 α1GlyRs. One-way ANOVA showed no significant effect of mutation on picrotoxin. Data are shown as mean ± S.E. percentage of control (where the EC10 control response is 100%).
Diazepam
Diazepam is the prototypical benzodiazepine agonist and potentiates the GABA responses through binding to an allosteric modulatory site on the receptor (63). In order to test if mutations to the γ subunit of the GABAAR interfered with the effects of diazepam, oocytes expressing WT and δL2 mutant GABAARs were tested for response to 1 μm diazepam. Diazepam potentiated GABA-activated currents in WT α1β2γ2 GABAARs (Fig. 9). The δL2 mutation did not significantly alter the effects of diazepam on the receptor.
FIGURE 9.
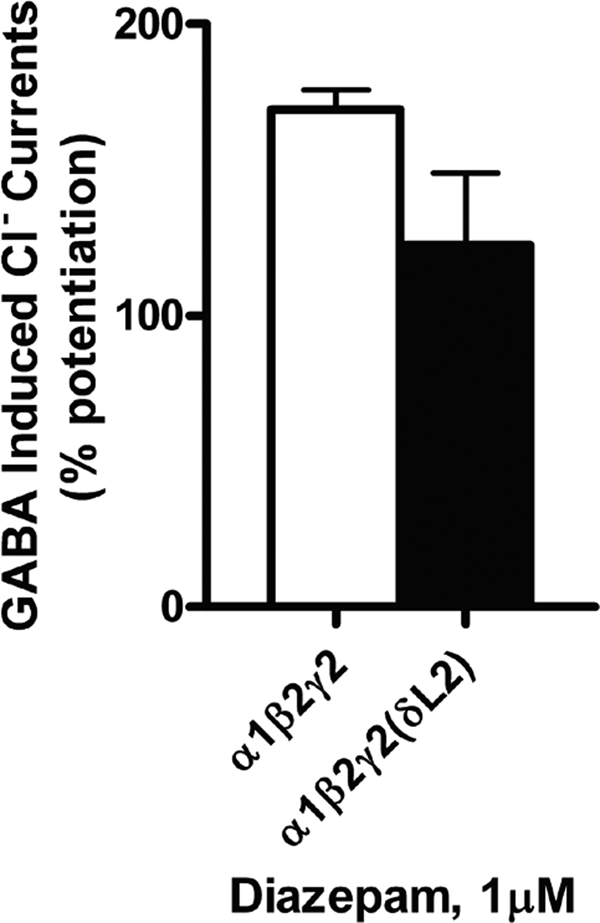
The δL2 GABAAR mutation did not affect sensitivity to diazepam in GABAARs. Diazepam potentiated EC10 GABA-activated currents in WT and δL2 mutant GABAARs. Student's t test showed no significant difference between WT and mutant GABAARs in potentiation by diazepam. Data are shown as mean ± S.E. percentage for diazepam potentiation.
Collectively, these findings in GlyR and GABAAR suggest that replacement of non-conserved residues in Loop 2 with those of δGABA increase ethanol sensitivity and that these changes in ethanol sensitivity cannot be explained by changes in the basic receptor function. Interestingly, the δL2 mutations did not affect allosteric modulation by Zn2+ in GlyRs or by diazepam in GABAARs, which indicates that the changes in ethanol sensitivity produced by this mutation do not extend to all allosteric modulators.
Molecular Modeling of WT Versus δL2 GlyR
The model of the α1GlyR based on the template of the prokaryotic LGIC GLIC (Protein Data Bank code 3EAM) showed that Loop 2 is a tight β turn (Fig 10A). This is an important point in that the previous best x-ray structure we used as a template for the ligand-binding domain had a more rounded structure for Loop 2. This template was the acetylcholine-binding protein (Protein Data Bank code 1I9B), and the differences in Loop structure are probably due to the acetylcholine-binding protein being a water-soluble protein with Loop 2 facing the aqueous environment, whereas Loop 2 in GlyR is at the relatively hydrophobic interface of two domains. Another notable feature of this GlyR model is that Lys276 extends out from the TM2-TM3 linker and makes a salt bridge with Glu53 in Loop 2 of the adjacent subunit. It is noteworthy that this salt bridge now extends directly across the intersubunit cavity.
FIGURE 10.

Molecular models of WT and δL2 α1GlyRs threaded on GLIC. A, view of three GlyR WT subunits from the center of the ion pore. The forward two subunits are not shown for clarity. B, enlarged view of Loop 2 in a single GlyR WT subunit. Residues interacting with Loop 2 are rendered as colored stick models: Lys104 (blue), Leu136 (yellow), Arg218 (pink), and Lys276 (green). C, enlarged view of the mutated δ Loop 2 in a single GlyR subunit. Residues interacting with Loop 2 are rendered as colored stick models as in B.
Three GlyR subunits are shown (Fig. 10A) in order to emphasize the intersubunit interactions that are possible, whereas specific interactions within Loop 2 are shown in an expanded view of the WT α1GlyR (Fig. 10B). Here we consider interactions of GlyR residues 50–59 with other residues within Loop 2 and in the β strands surrounding them. Ser50 interacts directly across the top of Loop 2 and forms a hydrogen bond with Arg59. Ile51 points toward the β sheet below, whereas Ala52 points more toward the ion pore. In addition, Ala52 is approximately in the “i” position of a β turn (39) and Glu53 points away from the center of the turn and forms a salt bridge with Arg218 in the Pre-TM1 segment of its subunit and with Lys276 of the neighboring subunit. Thr54 forms a hydrogen bond with Ser273 in the TM2-TM3 linker and interacts with Phe187. Thr55 interacts across Loop 2, whereas Met56 points away from Loop 2. Asp57 forms a salt bridge with Lys104. The backbone nitrogen and oxygen atoms of Tyr58 form reciprocal hydrogen bonds with the backbone atoms of Leu136. Arg59 interacts with Ser50 and Pro185.
Although only 4 of the 10 residues in Loop 2 are conserved in the mutated construct that we made, the global structure of the backbone of Loop 2 is essentially identical in the GlyR WT (Fig. 10B) and the δL2 mutant construct (Fig. 10C). This is remarkable, because each of the two sequences was independently used by the Modeler module of Discovery Studio to build the models. The best of 50 models was selected based on potential energy in the CHARMm force field, and then side chain positions were adjusted with the autorotomer module, a short molecular dynamics run was made, and then the two final structures were reoptimized. The positions of other residues that interact with those in Loop 2 were also conserved, especially Lys104 and Leu136. Lys276 still projects away from the TM2-TM3 linker and forms a salt bridge with Glu53 in the adjacent subunit. The most notable changes are how Arg218 interacts with Glu53 with a much different form of salt bridge. This change resulted in a small distortion of the pre-TM1 segment compared with the WT GlyR. As expected, the substitution of Asp57 with glutamate resulted in a shift of the salt bridge with Lys104 to compensate for the increased length of the glutamate side chain.
DISCUSSION
The present study tests the hypothesis that the structure of extracellular domain Loop 2 can markedly affect ethanol sensitivity in both GlyRs and GABAARs. We found that replacing Loop 2 of the α1GlyR subunit with that of the δGABAAR subunit, but not the γGABAAR subunit, reduced the threshold for ethanol sensitivity and increased the degree of ethanol potentiation without altering the general function of the receptor. Similarly, replacing the Loop 2 region of the γ subunit of GABAARs with the Loop 2 region of δGABAAR shifted the threshold for ethanol sensitivity from 50 mm in WT to 1 mm in the GABAAR γ-δL2 mutant. These results indicate that manipulations of Loop 2 structure can have profound effects on ethanol sensitivity of these receptors. Given the relatively high structural homology between the Cys-loop superfamily of receptors (36, 38, 56, 64), these findings in GlyR and GABAAR could extend to nAChRs and 5-hydroxytryptamine3 receptors.
As presented, the δL2 mutations increased ethanol sensitivity without altering sensitivity of GlyR and GABAAR, respectively, to allosteric modulation by Zn2+ and diazepam. Further work is necessary to test other allosteric modulators of GlyRs and GABAARs, particularly other general anesthetics like isoflurane, halothane, and propofol (65–67). Nonetheless, the lack of change in sensitivity of δL2 mutant GlyRs and GABAARs to the allosteric modulators tested suggests that the changes in ethanol sensitivity by this mutation do not extend to other allosteric modulators and may be specific for ethanol or ethanol-like agents.
The mechanism by which mutation of Loop 2 alters ethanol sensitivity in GlyRs and GABAARs is unknown. However, the current and previous studies provide some insights. With one exception, a left shift in glycine EC50 in the δL2 GlyR, Loop 2 mutations that increased ethanol sensitivity did not alter receptor EC50, Imax, or Hill slope. Similarly, the δL2 GABAAR mutation resulted in increased ethanol sensitivity without a significant change in GABA sensitivity. Prior studies also found that mutation of position 52 in Loop 2 could alter ethanol sensitivity in GlyRs without changing EC50 (19, 20). Moreover, the δL2 mutation in GlyRs did not significantly affect the response of the receptors to strychnine or picrotoxin. Together, these findings indicate that the increase in ethanol sensitivity in δL2 mutants cannot be explained by changes in receptor conformation that alter basic receptor function.
Interestingly, prior studies indicate that ethanol sensitivity in recombinant α1β2δ GABAARs expressed in Xenopus oocytes is not increased. Rather, the ethanol sensitivity of this subunit combination is similar to that seen in WT α1β2γ2 GABAARs (51). Further studies are necessary to ensure incorporation of the δ subunit in this work. Nonetheless, these findings suggest that there is an important interaction between α and δ subunits that is involved in making WT α4β2/3δ and α6β2/3δ GABAARs highly sensitive to ethanol. Taken in conjunction with the present results, these findings in α1β2δ GABAARs also support the conclusion that the structure of Loop 2 plays a critical role in producing high ethanol sensitivity in the δL2 mutant GABAARs and probably also the δL2 mutant GlyRs, tested in the present study.
Mutations of Loop 2 structure could alter ethanol sensitivity by changing the physical-chemical characteristics of the amino acids at key locations and their interactions within Loop 2 and/or with the TM domain. This notion is supported by several lines of evidence and by the models described below. Prior studies provide evidence that position 52 in Loop 2 of the extracellular domain and position 267 in the TM domain of α1 GlyRs are sites of ethanol action (8, 18–20, 31, 32) and that ethanol causes qualitatively different (position-specific) effects when acting on these targets (19). Further studies used cysteine mutations at these positions in combination with propyl methanethiosulfonate to suggest that these sites were part of the same ethanol pocket (19). Given that this pocket contains multiple sites that are capable of producing ethanol effects, we describe the pocket as an ethanol “action pocket” to distinguish it from classical high affinity binding sites. Molecular modeling revealed a cavity that extends ∼28 Å from the Cα atoms of Ala52 to Ser267 that could function as this alcohol action pocket (19). As proposed by these authors, this pocket would be large enough to hold several ethanol molecules. The estimated 28-Å distance between positions 52 and 267 precludes action by one ethanol molecule on both sites simultaneously. Hence, the probability that ethanol molecule(s) will be acting on one or more of these sites at a given moment increases as the ethanol concentration increases. The net response to ethanol on receptor function will represent the summation of the actions of ethanol on these potentially independent targets.
Interestingly, further study found that the polarity of the residue at position 52 plays a key role in determining the sensitivity of GlyRs to ethanol (20). The findings with polarity contrast with the findings at position 267 in the TM domain, where others found that molecular volume, but not polarity, significantly affects ethanol sensitivity (9). Taken together, these findings indicate that the physical-chemical parameters at positions in the extracellular and TM domains that modulate ethanol effects and/or initiate ethanol action in GlyRs are not uniform and may respond to different concentrations of ethanol.
GABAARs have not been investigated extensively in this respect, but parallel studies that implicate the homologous positions in GABAARs as targets for ethanol action and modulation, combined with the structural homology between GlyRs and GABAARs (8, 38, 56, 64), suggest that the same factors may apply for GABAARs. Knowledge regarding the physical-chemical properties that control ethanol sensitivity is key for understanding the relationship between structure and the actions of ethanol in receptors and for building molecular models of the ethanol sites of action.
Several molecular models of LGICs have been developed that have begun to describe possible pairwise ionic interactions between critical residues in the extracellular and TM domains that may contribute to agonist action (36, 38, 39, 64, 68, 69). These studies employed techniques such as charge reversal and cysteine cross-linking to identify conformational changes in receptor proteins, including GlyRs and GABAARs that may be involved in agonist activation or transduction. Molecular models have been developed that identify putative sites of ethanol action in GlyRs (19, 26, 40). However, these models have not addressed possible molecular mechanisms that initiate, transduce, or modulate the actions of ethanol.
Here, we present a molecular model of the GlyR threaded on the x-ray structure of GLIC. In addition to being the first GlyR model threaded on GLIC, it is the first model that offers a mechanistic explanation for the effects of ethanol on the GlyR based on changes in Loop 2 structure. The latter are revealed by juxtaposing the models derived from threading the WT versus the δL2 GlyR sequences onto GLIC. The change in conformation as a result of the δL2 substitution in mutant GlyRs changes the manner in which Arg218 (pre-TM1) interacts with Glu53 (Loop 2) with a much different form of salt bridge. The delocalized charge of the three partially positive nitrogen atoms (N-H+ groups) at the guanidinium end of the arginine side chain allows it to form a salt bridge with the glutamate carboxyl group either straight-on (the longest net distance) or at either side of the arginine side chain (shorter net distance and not linear). The result of the δ Loop 2 mutation is to form the more distorted side-on salt bridge in our modeling. This change causes a small distortion of the pre-TM1 segment compared with the WT GlyR. Moreover, the δL2 mutant GlyR has an aspartic acid residue at position 57 in place of the glutamic acid found in WT. As expected, the substitution of Asp57 with glutamate results in a shift of the salt bridge with Lys104 to compensate for the increased length of the glutamate side chain. However, it is unlikely that these are just static changes. Rather, they would change the ensemble of conformations that may occur during gating and may be affected by the presence of alcohol molecules, which could alter ethanol sensitivity. If valid, this suggests that these dynamic movements are involved in causing and/or transducing the action of ethanol in Loop 2.
Despite the low homology between Loop 2 residues in α1GlyR and δGABAAR, the global structure of the β turn is conserved in the chimera, illustrating the importance of structural homology across the Cys-loop superfamily. This suggests that insights provided by the current model may generalize to GABAARs and other members of the superfamily. Two notable differences in the model in Fig. 10 stand out. First, the side chain of Lys276 extends out from the TM2–3 linker to make contact with the conserved Glu53 in Loop 2, forming an intersubunit salt bridge. This intersubunit salt bridge has not been observed in previous x-ray or cryoelectron microscopy structures and is not present in the GLIC template used for modeling. It is possible that the solvation/desolvation of this salt bridge is important for the structural rearrangements that accompany the gating transition (70). Second, the salt bridge between Arg218 and Glu53 has a different conformation in the δL2 mutant GlyR. The altered length of this salt bridge may contribute to the differences in sensitivity to glycine and ethanol. In addition, it should be noted that the partial negative charges on Glu53, at the tip of the β turn in Loop 2, are shared between Arg218 and Lys276. These complicated electrostatic and steric interactions might be especially sensitive to the presence of ethanol molecules in the adjacent cavity. These findings exploring the role of Loop 2 and the δ GABA sequence exemplify how increasing our knowledge regarding the structures that can modulate ethanol sensitivity can increase our understanding of the targets for ethanol and structure-function relationships.
GlyRs and GABAARs are widely held to represent initial targets for ethanol action that underlie a broad spectrum of ethanol-induced acute and chronic behavioral effects. Behavioral effects in humans can be detected at blood ethanol concentrations beginning at ∼0.03% (w/v) (7 mm) (71). The legal limits for alcohol consumption while driving are 0.05% (w/v) (11 mm) in most European Union countries and 0.08% (w/v) (17 mm) in the United States (72). A blood alcohol concentration of 0.40% (w/v) (88 mm) is lethal in 50% of the population (73). Therefore, the present studies in recombinant receptors, which identify Loop 2 as a structure that can modulate ethanol sensitivity across this broad range of behaviorally and toxicologically relevant concentrations, could provide insight into the structural basis for individual differences in ethanol sensitivity.
The findings also suggest the exciting possibility that structural modifications of Loop 2 in GlyR and GABAAR might be used to markedly increase the ethanol sensitivity in target receptor populations (e.g. specific receptor subtypes or brain regional populations) in transgenic animals. This approach could result in new tools for measuring the effects of ethanol on sensitized receptors in which overexpression of high ethanol sensitivity mutant receptors in neurons will enable us see the effects of ethanol on these receptors at very low concentrations (∼1 mm) that should not elicit responses from endogenous receptors. Hence, we should be able to detect this effect of ethanol on the neuron without interference from its action on endogenous receptors. If valid, this would provide an alternative strategy that could be used to map the specific behavioral effects of ethanol caused by its actions on respective receptor populations. Increased knowledge regarding the initial sites for ethanol action and the structures that affect sensitivity to ethanol also could provide new targets for the development of therapeutic agents to prevent or help treat alcohol-related disorders.
Acknowledgments
We thank Miriam Fine, Rachel Kelly, and Drs. Edward Bertaccini and Kaixun Li for technical assistance and scientific input.
This work was supported, in whole or in part, by National Institutes of Health (NIH), NIAAA, Grants AA017569 (to D. I. P), AA03972 (to R. L. A.), AA013890 and AA013922 (to D. L. D.), AA017293 (to L. A.), and AA013378 (to J. R. T.) and NIH, NIGMS, Grant G64371 (to J. R. T.). This work was also supported by the USC School of Pharmacy. This work was conducted as partial fulfillment of the requirements for the Ph.D. degree in Molecular Pharmacology and Toxicology, University of Southern California (D. I. P.).
- LGIC
- ligand-gated ion channel
- GLIC
- G. violaceus pentameric ligand-gated ion channel homologue
- GlyR
- glycine receptor
- GABAA
- γ-aminobutyric acid type A
- GABAAR
- GABAA receptor
- nAChR
- nicotinic acetylcholine receptor
- TM
- transmembrane
- WT
- wild type
- ANOVA
- analysis of variance.
REFERENCES
- 1.McGinnis J. M., Foege W. H. (1999) Proc. Assoc. Am. Physicians 111, 109–118 [DOI] [PubMed] [Google Scholar]
- 2.Volpicelli J. R. (2001) J. Clin. Psychiatry 62, 4–10 [PubMed] [Google Scholar]
- 3.Heilig M., Egli M. (2006) Pharmacol. Ther. 111, 855–876 [DOI] [PubMed] [Google Scholar]
- 4.Steensland P., Simms J. A., Holgate J., Richards J. K., Bartlett S. E. (2007) Proc. Natl. Acad. Sci. U.S.A. 104, 12518–12523 [DOI] [PMC free article] [PubMed] [Google Scholar]
- 5.Johnson B. A., Rosenthal N., Capece J. A., Wiegand F., Mao L., Beyers K., McKay A., Ait-Daoud N., Anton R. F., Ciraulo D. A., Kranzler H. R., Mann K., O'Malley S. S., Swift R. M. (2007) JAMA 298, 1641–1651 [DOI] [PubMed] [Google Scholar]
- 6.Deitrich R. A., Dunwiddie T. V., Harris R. A., Erwin V. G. (1989) Pharmacol. Rev. 41, 489–537 [PubMed] [Google Scholar]
- 7.Harris R. A. (1999) Alcohol. Clin. Exp. Res. 23, 1563–1570 [PubMed] [Google Scholar]
- 8.Mihic S. J., Ye Q., Wick M. J., Koltchine V. V., Krasowski M. D., Finn S. E., Mascia M. P., Valenzuela C. F., Hanson K. K., Greenblatt E. P., Harris R. A., Harrison N. L. (1997) Nature 389, 385–389 [DOI] [PubMed] [Google Scholar]
- 9.Ye Q., Koltchine V. V., Mihic S. J., Mascia M. P., Wick M. J., Finn S. E., Harrison N. L., Harris R. A. (1998) J. Biol. Chem. 273, 3314–3319 [DOI] [PubMed] [Google Scholar]
- 10.Zhou Q., Lovinger D. M. (1996) J. Pharmacol. Exp. Ther. 278, 732–740 [PubMed] [Google Scholar]
- 11.Cardoso R. A., Brozowski S. J., Chavez-Noriega L. E., Harpold M., Valenzuela C. F., Harris R. A. (1999) J. Pharmacol. Exp. Ther. 289, 774–780 [PubMed] [Google Scholar]
- 12.Davies D. L., Alkana R. L. (2001) Alcohol. Clin. Exp. Res. 25, 1098–1106 [PubMed] [Google Scholar]
- 13.Ortells M. O., Lunt G. G. (1995) Trends Neurosci. 18, 121–127 [DOI] [PubMed] [Google Scholar]
- 14.Karlin A. (2002) Nat. Rev. Neurosci. 3, 102–114 [DOI] [PubMed] [Google Scholar]
- 15.Mihic S. J., Harris R. A. (1996) J. Pharmacol. Exp. Ther. 277, 411–416 [PubMed] [Google Scholar]
- 16.Grant K. A. (1995) Drug Alcohol Depend. 38, 155–171 [DOI] [PubMed] [Google Scholar]
- 17.Davies D. L., Machu T. K., Guo Y., Alkana R. L. (2002) Alcohol. Clin. Exp. Res. 26, 773–778 [PubMed] [Google Scholar]
- 18.Davies D. L., Crawford D. K., Trudell J. R., Mihic S. J., Alkana R. L. (2004) J. Neurochem. 89, 1175–1185 [DOI] [PubMed] [Google Scholar]
- 19.Crawford D. K., Trudell J. R., Bertaccini E. J., Li K., Davies D. L., Alkana R. L. (2007) J. Neurochem. 102, 2097–2109 [DOI] [PubMed] [Google Scholar]
- 20.Perkins D. I., Trudell J. R., Crawford D. K., Alkana R. L., Davies D. L. (2008) J. Neurochem. 106, 1337–1349 [DOI] [PMC free article] [PubMed] [Google Scholar]
- 21.Monaghan D. T., Bridges R. J., Cotman C. W. (1989) Annu. Rev. Pharmacol. Toxicol. 29, 365–402 [DOI] [PubMed] [Google Scholar]
- 22.Sommer B., Seeburg P. H. (1992) Trends Pharmacol. Sci. 13, 291–296 [DOI] [PubMed] [Google Scholar]
- 23.Weight F. F., Li C., Peoples R. W. (1999) Neurochem. Int. 35, 143–152 [DOI] [PubMed] [Google Scholar]
- 24.Davies D. L., Kochegarov A. A., Kuo S. T., Kulkarni A. A., Woodward J. J., King B. F., Alkana R. L. (2005) Neuropharmacology 49, 243–253 [DOI] [PubMed] [Google Scholar]
- 25.Asatryan L., Popova M., Woodward J. J., King B. F., Alkana R. L., Davies D. L. (2008) Neuropharmacology 55, 835–843 [DOI] [PMC free article] [PubMed] [Google Scholar]
- 26.Lobo I. A., Harris R. A., Trudell J. R. (2008) J. Neurochem. 104, 1649–1662 [DOI] [PMC free article] [PubMed] [Google Scholar]
- 27.Mascia M. P., Machu T. K., Harris R. A. (1996) Br. J. Pharmacol. 119, 1331–1336 [DOI] [PMC free article] [PubMed] [Google Scholar]
- 28.Valenzuela C. F., Cardoso R. A., Wick M. J., Weiner J. L., Dunwiddie T. V., Harris R. A. (1998) Alcohol. Clin. Exp. Res. 22, 1132–1136 [PubMed] [Google Scholar]
- 29.Ye J. H., Tao L., Zhu L., Krnjević K., McArdle J. J. (2002) Neuropharmacology 43, 788–798 [DOI] [PubMed] [Google Scholar]
- 30.Yevenes G. E., Moraga-Cid G., Guzmán L., Haeger S., Oliveira L., Olate J., Schmalzing G., Aguayo L. G. (2006) J. Biol. Chem. 281, 39300–39307 [DOI] [PubMed] [Google Scholar]
- 31.Mascia M. P., Trudell J. R., Harris R. A. (2000) Proc. Natl. Acad. Sci. U.S.A. 97, 9305–9310 [DOI] [PMC free article] [PubMed] [Google Scholar]
- 32.Mascia M. P., Mihic S. J., Valenzuela C. F., Schofield P. R., Harris R. A. (1996) Mol. Pharmacol. 50, 402–406 [PubMed] [Google Scholar]
- 33.Davies D. L., Trudell J. R., Mihic S. J., Crawford D. K., Alkana R. L. (2003) Alcohol. Clin. Exp. Res. 27, 743–755 [DOI] [PubMed] [Google Scholar]
- 34.Kash T. L., Jenkins A., Kelley J. C., Trudell J. R., Harrison N. L. (2003) Nature 421, 272–275 [DOI] [PubMed] [Google Scholar]
- 35.O'Mara M., Barry P. H., Chung S. H. (2003) Proc. Natl. Acad. Sci. U.S.A. 100, 4310–4315 [DOI] [PMC free article] [PubMed] [Google Scholar]
- 36.Castaldo P., Stefanoni P., Miceli F., Coppola G., Del Giudice E. M., Bellini G., Pascotto A., Trudell J. R., Harrison N. L., Annunziato L., Taglialatela M. (2004) J. Biol. Chem. 279, 25598–25604 [DOI] [PubMed] [Google Scholar]
- 37.O'Mara M., Cromer B., Parker M., Chung S. H. (2005) Biophys. J. 88, 3286–3299 [DOI] [PMC free article] [PubMed] [Google Scholar]
- 38.Wang J., Lester H. A., Dougherty D. A. (2007) J. Biol. Chem. 282, 26210–26216 [DOI] [PubMed] [Google Scholar]
- 39.Crawford D. K., Perkins D. I., Trudell J. R., Bertaccini E. J., Davies D. L., Alkana R. L. (2008) J. Biol. Chem. 283, 27698–27706 [DOI] [PMC free article] [PubMed] [Google Scholar]
- 40.Cheng M. H., Coalson R. D., Cascio M. (2007) Proteins 71, 972–981 [DOI] [PubMed] [Google Scholar]
- 41.Woodward J. J., Nowak M., Davies D. L. (2004) Mol. Brain Res. 125, 86–95 [DOI] [PubMed] [Google Scholar]
- 42.White G., Lovinger D. M., Weight F. F. (1990) Brain Res. 507, 332–336 [DOI] [PubMed] [Google Scholar]
- 43.Weiner J. L., Gu C., Dunwiddie T. V. (1997) J. Neurophys. 77, 1306–1312 [DOI] [PubMed] [Google Scholar]
- 44.Wei W., Faria L. C., Mody I. (2004) J. Neurosci. 24, 8379–8382 [DOI] [PMC free article] [PubMed] [Google Scholar]
- 45.Hanchar H. J., Dodson P. D., Olsen R. W., Otis T. S., Wallner M. (2005) Nat. Neurosci. 8, 339–345 [DOI] [PMC free article] [PubMed] [Google Scholar]
- 46.Hanchar H. J., Chutsrinopkun P., Meera P., Supavilai P., Sieghart W., Wallner M., Olsen R. W. (2006) Proc. Natl. Acad. Sci. U.S.A. 103, 8546–8551 [DOI] [PMC free article] [PubMed] [Google Scholar]
- 47.Liang J., Zhang N., Cagetti E., Houser C. R., Olsen R. W., Spigelman I. (2006) J. Neurosci. 26, 1749–1758 [DOI] [PMC free article] [PubMed] [Google Scholar]
- 48.Fleming R. L., Wilson W. A., Swartzwelder H. S. (2007) J. Neurophysiol. 97, 3806–3811 [DOI] [PubMed] [Google Scholar]
- 49.Glykys J., Peng Z., Chandra D., Homanics G. E., Houser C. R., Mody I. (2007) Nat. Neurosci. 10, 40–48 [DOI] [PubMed] [Google Scholar]
- 50.Santhakumar V., Wallner M., Otis T. S. (2007) Alcohol 41, 211–221 [DOI] [PMC free article] [PubMed] [Google Scholar]
- 51.Sundstrom-Poromaa I., Smith D. H., Gong Q. H., Sabado T. N., Li X., Light A., Wiedmann M., Williams K., Smith S. S. (2002) Nat. Neurosci. 5, 721–722 [DOI] [PMC free article] [PubMed] [Google Scholar]
- 52.Olsen R. W., Hanchar H. J., Meera P., Wallner M. (2007) Alcohol 41, 201–209 [DOI] [PMC free article] [PubMed] [Google Scholar]
- 53.Borghese C. M., Harris R. A. (2007) Alcohol 41, 155–162 [DOI] [PMC free article] [PubMed] [Google Scholar]
- 54.Mody I., Glykys J., Wei W. (2007) Alcohol 41, 145–153 [DOI] [PMC free article] [PubMed] [Google Scholar]
- 55.Chen Z. W., Chang C. S., Leil T. A., Olcese R., Olsen R. W. (2005) Mol. Pharmacol. 68, 152–159 [DOI] [PubMed] [Google Scholar]
- 56.Brejc K., van Dijk W. J., Klaassen R. V., Schuurmans M., van Der Oost J., Smit A. B., Sixma T. K. (2001) Nature 411, 269–276 [DOI] [PubMed] [Google Scholar]
- 57.Bocquet N., Prado de Carvalho L., Cartaud J., Neyton J., Le Poupon C., Taly A., Grutter T., Changeux J. P., Corringer P. J. (2007) Nature 445, 116–119 [DOI] [PubMed] [Google Scholar]
- 58.Bocquet N., Nury H., Baaden M., Le Poupon C., Changeux J. P., Delarue M., Corringer P. J. (2009) Nature 457, 111–114 [DOI] [PubMed] [Google Scholar]
- 59.Bloomenthal A. B., Goldwater E., Pritchett D. B., Harrison N. L. (1994) Mol. Pharmacol. 46, 1156–1159 [PubMed] [Google Scholar]
- 60.Laube B., Kuhse J., Rundström N., Kirsch J., Schmieden V., Betz H. (1995) J. Physiol. 483, 613–619 [DOI] [PMC free article] [PubMed] [Google Scholar]
- 61.Betz H. (1991) TINS 14, 458–461 [DOI] [PubMed] [Google Scholar]
- 62.Lynch J. W., Rajendra S., Barry P. H., Schofield P. R. (1995) J. Biol. Chem. 270, 13799–13806 [DOI] [PubMed] [Google Scholar]
- 63.Macdonald R. L., Olsen R. W. (1994) Annu. Rev. Neurosci. 17, 569–602 [DOI] [PubMed] [Google Scholar]
- 64.Price K. L., Millen K. S., Lummis S. C. (2007) J. Biol. Chem. 282, 25623–25630 [DOI] [PubMed] [Google Scholar]
- 65.Krasowski M. D., Harrison N. L. (1999) Cell Mol. Life Sci. 55, 1278–1303 [DOI] [PMC free article] [PubMed] [Google Scholar]
- 66.Krasowski M. D., Harrison N. L. (2000) Br. J. Pharmacol. 129, 731–743 [DOI] [PMC free article] [PubMed] [Google Scholar]
- 67.Jenkins A., Greenblatt E. P., Faulkner H. J., Bertaccini E., Light A., Lin A., Andreasen A., Viner A., Trudell J. R., Harrison N. L. (2001) J. Neurosci. 21, RC136. [DOI] [PMC free article] [PubMed] [Google Scholar]
- 68.Kash T. L., Kim T., Trudell J. R., Harrison N. L. (2004) Neurosci. Lett. 371, 230–234 [DOI] [PubMed] [Google Scholar]
- 69.Dellisanti C. D., Yao Y., Stroud J. C., Wang Z. Z., Chen L. (2007) Nat. Neurosci. 10, 953–962 [DOI] [PubMed] [Google Scholar]
- 70.Honig B. H., Hubbell W. L. (1984) Proc. Natl. Acad. Sci. U.S.A. 81, 5412–5416 [DOI] [PMC free article] [PubMed] [Google Scholar]
- 71.Ogden E. J., Moskowitz H. (2004) Traffic Inj. Prev. 5, 185–198 [DOI] [PubMed] [Google Scholar]
- 72.Wallner M., Hanchar H. J., Olsen R. W. (2003) Proc. Natl. Acad. Sci. U.S.A. 100, 15218–15223 [DOI] [PMC free article] [PubMed] [Google Scholar]
- 73.Koski A., Ojanperä I., Vuori E. (2002) Alcohol. Clin. Exp. Res. 26, 956–959 [DOI] [PubMed] [Google Scholar]