Abstract
The Arcuate Fasciculus (AF) is a bundle of white matter traditionally thought to be responsible for language function. However, its role in music is not known. Here we investigate the connectivity of the AF using Diffusion Tensor Imaging (DTI) and show that musically tone-deaf individuals, who show impairments in pitch discrimination, have reduced connectivity in the AF relative to musically normal-functioning control subjects. Results were robust to variations in imaging parameters and emphasize the importance of brain connectivity in para-linguistic processes such as music.
Keywords: musical disorders, Diffusion Tensor Imaging (DTI), Arcuate Fasciculus, language, pitch perception
Introduction
Brain areas do not function in isolation; rather, the disparate areas of the human brain function together to enable complex human behaviors such as speaking, singing, and music making. While grey matter in the brain contains cell bodies that primarily perform the necessary computations to drive human behavior, white matter is required to enable cross-talk between grey matter areas to function in concert. How these white matter bundles of neural connectivity enable behavior can be studied using Diffusion Tensor Imaging (DTI). Diffusion imaging makes use of diffusion properties of water to infer information about connectivity in biological tissue(1). By correlating musical behavior with tracts identified from diffusion weighted images, especially in populations with suspected disconnection syndromes, DTI can be especially useful for understanding the role of brain connectivity in human behavior(2).
One of the major fiber bundles in the human brain that has long been mapped to behavioral function is the Arcuate Fasciculus (AF), a bundle of fibers connecting the classical Broca’s and Wernicke’s areas in the frontal and temporal lobes respectively(3). As patients with disrupted connections in the AF, known as conduction aphasics, have difficulty with aspects of linguistic functions, the AF is widely believed to be responsible for language(4–6). In addition to language function, the classical Broca’s and Wernicke’s areas, anatomically localized to the inferior frontal gyrus and posterior superior temporal region respectively(7, 8), are shown in functional neuroimaging studies to be especially active in musicians(9–11) and to have abnormal morphometry in both left (12) and right (13) hemispheres among individuals with musical disorders or tone-deafness, also known as congenital amusia (12, 13). This suggests a considerable overlap in neural resources subserving language and music(14); however, the role of white matter in these shared neural networks has only recently received attention(15). Here we compare the AF using different DTI parameters in musically intact and impaired individuals, in order to investigate the functional importance of variability in white matter connectivity and its dependence on technical considerations.
Methods
Subjects
Twelve right-handed subjects (tone-deaf n = 6; control n = 6) participated in this neuroimaging study. Subjects were recruited from advertisements in the greater Boston area. Tone-deaf subjects were identified by self-report and confirmed using the Montreal Battery of Evaluation of Amusia(16) as well as a psychophysical pitch discrimination task. In the pitch discrimination task, a three-up-one-down staircase procedure was employed at the center frequency of 500 Hz, a fundamental frequency shown to be within the optimal range for musical melodies. Subjects whose pitch-discrimination thresholds were larger than one semitone (100 cents) were labeled as tone-deaf. The control sample was matched to the tone-deaf group in age, gender, and degree of musical training.
Procedure
Structural MRI with DTI was performed using a 3-Tesla General Electric scanner. Anatomic images were acquired using a T1-weighted, three-dimensional, magnetization-prepared, rapid-acquisition, gradient-echo (MPRAGE) volume acquisition with a voxel resolution of 0.93×0.93×1.5mm. Diffusion weighted images were acquired using a single-shot, spin-echo, echo-planar imaging sequence (TE1=86.9ms, TR=10000ms, FOV=240mm, matrix size=128×128 voxels, slice thickness=5.0mm, no skip, NEX=1, axial acquisition, 25 noncollinear directions with b-value=1000s/mm2, 1 image with b-value=0s/mm2). To investigate the effects of different diffusion imaging parameters, an additional set of diffusion-weighted images was obtained with a higher resolution using the thinner slice thickness of 2.6mm and matrix size 96×96 voxels, giving an isotropic voxel size (2.6mm3), and with an increased number of 30 noncollinear directions with b-value=1000s/mm2 and 6 images with b-value=0s/mm2. For each set of diffusion-weighted images, fractional anisotropy (FA) values, a measure of directional preference of water diffusion, were calculated within each voxel.
Data analysis
Tractography was applied to DTI data to reconstruct white matter tracts by successively following the path of preferred direction of water diffusion. Using MedINRIA software v.1.5.3(17) diffusion tensors were calculated from all voxels and fiber tracts were calculated by connecting adjacent voxels with similar principal eigenvectors, using a threshold FA value of 0.2 and a smoothness factor (a parameter ranging from 0 to 1 corresponding to the straightness of each fiber(17)) of 0.2 for continuous fiber reconstruction. Fibers were limited to lengths of >10 mm. To constrain bundles of fiber tracts and to determine regional FA values, seed regions of interest (ROIs) were drawn bilaterally on each brain by a single coder, who was blind to the status of the participants, on sagittal slices of FA-weighted images over the posterior superior temporal gyrus (pSTG), posterior middle temporal gyrus (pMTG), and posterior inferior frontal gyrus (pIFG). These regions of interest were defined according to published DTI atlases(18, 19). As the AF has been identified as a large fiber tract connecting the posterior inferior frontal gyrus (pIFG) to both the posterior superior temporal gyrus (pSTG) and middle temporal gyrus (pMTG)(20, 21), we labeled the connection between the pIFG and pSTG as the superior arcuate fasciculus (superior AF), and the connection between pIFG and pMTG as the inferior arcuate fasciculus (inferior AF). A mean FA value was calculated for each ROI of each subject by averaging FA in all voxels. The identified tract volume statistics were extracted and compared offline after applying tractography.
Results
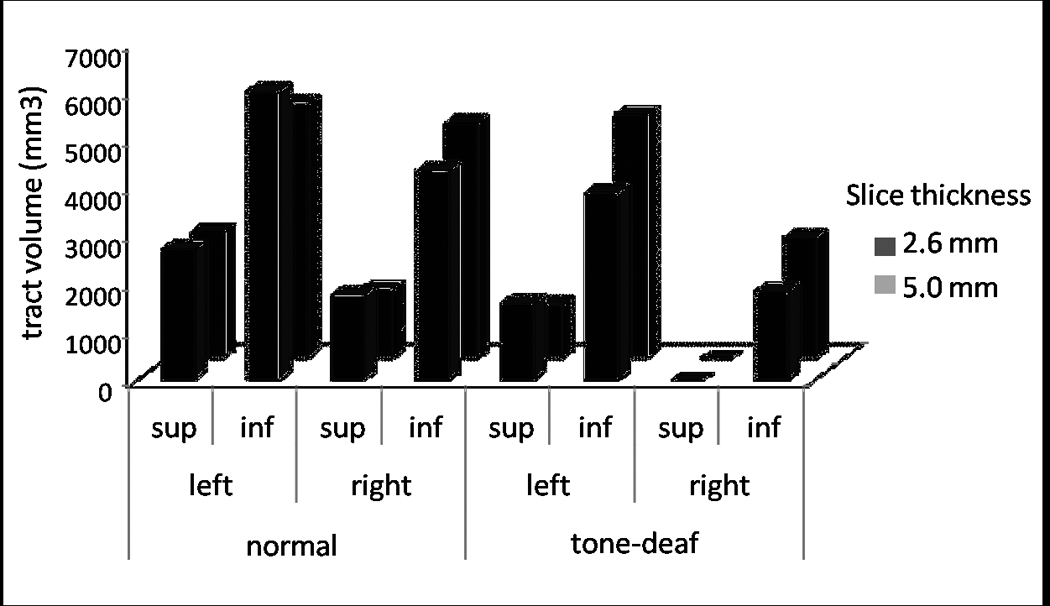
Fiber volume was significantly smaller in the tone-deaf group than in the normal group. This between-group difference in tract volume was confirmed by a significant effect of group in a two-way ANOVA with factors of group (normal vs. tone-deaf) and AF tract (left superior, left inferior, right superior, right inferior) on the dependent variables of tract volume in both the high-resolution imaging parameters (2.6mm slice thickness): F(1,40)=14.5, p<0.001 and the low-resolution imaging parameters (5.0mm slices): F(1,40)=8.1, p<0.01.
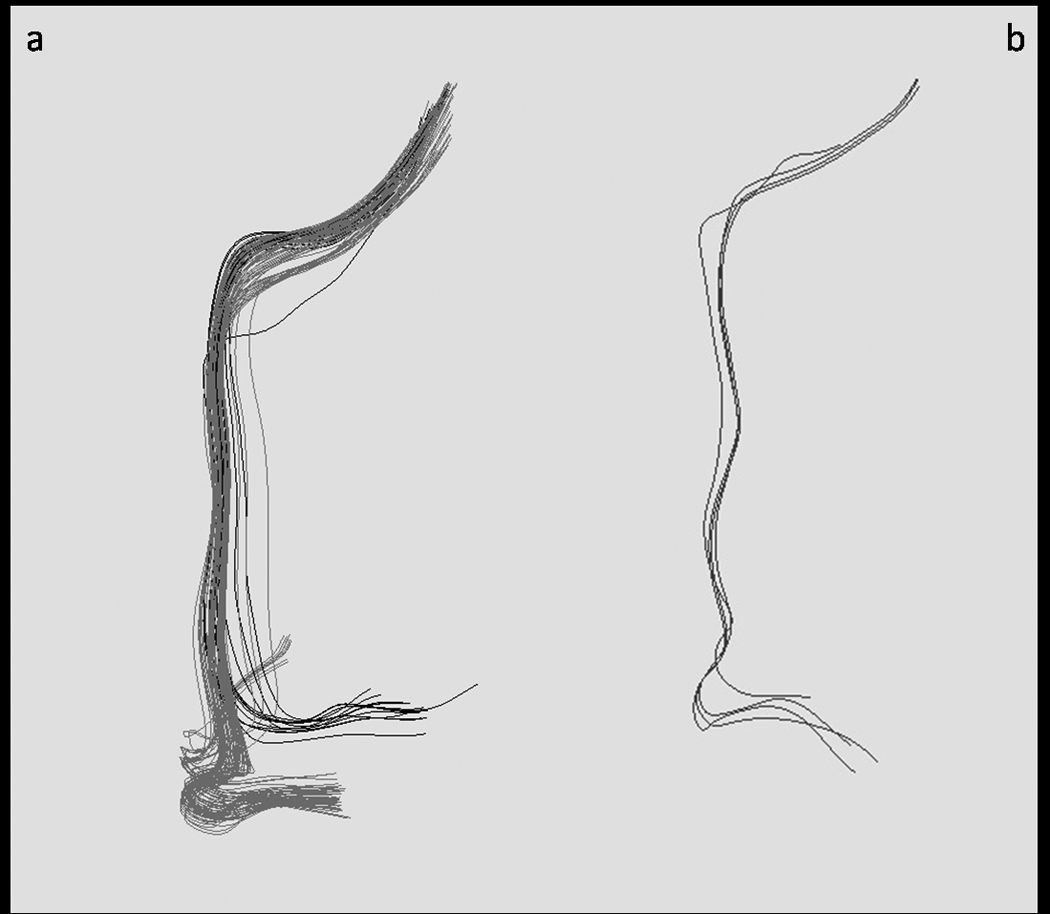
A comparison between two sets of imaging parameters replicated our main findings in the identification of all four AF fiber tracts in non-tone-deaf individuals but only three of the four tracts in tone-deaf individuals. The right superior AF was not detected in all tone-deaf individuals but was identified in all non-tone-deaf controls. While fiber volume of differed slightly between the scans, this difference was not significant (F(1,40)=0.62, p=0.60). A two-way ANOVA on fiber volumes with factors of scan (2.6mm vs. 5.0mm slices) and group (tone-deaf vs. control) revealed a highly significant effect of subject group (F(1,20)= 4.8, p<0.001) but no significant difference between scans (F(1,20)=0.04, p=0.83) and, importantly, no interaction between scans and subject group (F(1,20)=0.33, p=0.57), confirming that the observed differences between tone-deaf and control groups were robust to different voxel resolutions and number of diffusion directions. Changing the imaging parameters did not affect the pattern of results.
Conclusions
Using the novel technique of diffusion tensor tractography, we show that musically tone-deaf individuals have disrupted connectivity in the AF. This difference in volume of traceable fibers is observed in both hemispheres, but effects are more robust on the right, with the superior branch of the AF being undetectable amongst the tone-deaf individuals. This observation is the first documentation of differences in the AF affecting non-linguistic behavior, thus highlighting the role of white matter connectivity between sound perception and production brain areas in neural functions other than language.
The observed differences between musically normal and disordered individuals do not interact with the chosen set of voxel resolutions and number of diffusion directions. This pattern of results confirms that differences in brain connectivity between individuals with normal and abnormal musical abilities are robust to differences in imaging parameters. Nevertheless, to maximize the number of traceable fibers in diffusion imaging, it remains advisable to employ the highest-resolution imaging parameters while catering to constraints of field of view and overall scan time, two of the limitations that often dictate choices of imaging parameters especially when dealing with special populations who may pose increased demands on time and resources.
Results converge with existing research in showing abnormalities in grey and white matter in frontal and temporal regions among the tone-deaf (12, 13, 15). Future work should focus on psychophysical differences between musically intact and disordered individuals and attempt to identify neural connections that predict perceptual behavior.
Figure 1.

A comparison of right AF tracts identified in a representative normal and tone-deaf subject at the voxel size of 2.6mm3. a) Right AF tracts in a normal subject, showing superior (dark grey) and inferior (light grey) branches. b) Right AF tracts identified in a tone-deaf subject, showing inferior tracts only. The superior branch was undetected among tone-deaf subjects in the present sample.
Figure 2.

Average fiber volume of each tract of the Arcuate Fasciculus (left superior, left inferior, right superior, right inferior) in 6 tone-deaf and 6 control subjects, comparing the two diffusion scanning protocols (light grey = 5.0mm×1.94mm×1.94mm voxel size, 25 noncollinear directions, 1 b0 acquisition; dark grey = 2.6mm3 voxel size, 30 noncollinear directions, 6 b0 acquisitions).
References
- 1.Jones DK. Cortex. 2008;44:936–952. doi: 10.1016/j.cortex.2008.05.002. [DOI] [PubMed] [Google Scholar]
- 2.Basser PJ, Jones DK. NMR Biomed. 2002;15:456–467. doi: 10.1002/nbm.783. [DOI] [PubMed] [Google Scholar]
- 3.Catani M, Mesulam M. Cortex. 2008;44:953–961. doi: 10.1016/j.cortex.2008.04.002. [DOI] [PMC free article] [PubMed] [Google Scholar]
- 4.Geldmacher DS, Quigg M, Elias WJ. Neurology. 2007;69:321. doi: 10.1212/01.wnl.0000275278.38229.7b. author reply 321–322. [DOI] [PubMed] [Google Scholar]
- 5.Glasser MF, Rilling JK. Cereb Cortex. 2008 doi: 10.1093/cercor/bhn011. [DOI] [PubMed] [Google Scholar]
- 6.Vernooij MW, Smits M, Wielopolski PA, Houston GC, Krestin GP, van der Lugt A. Neuroimage. 2007;35:1064–1076. doi: 10.1016/j.neuroimage.2006.12.041. [DOI] [PubMed] [Google Scholar]
- 7.Catani M, Jones DK, ffytche DH. Ann Neurol. 2005;57:8–16. doi: 10.1002/ana.20319. [DOI] [PubMed] [Google Scholar]
- 8.Friederici AD, Ruschemeyer SA, Hahne A, Fiebach CJ. Cereb Cortex. 2003;13:170–177. doi: 10.1093/cercor/13.2.170. [DOI] [PubMed] [Google Scholar]
- 9.Sluming V, Brooks J, Howard M, Downes JJ, Roberts N. J Neurosci. 2007;27:3799–3806. doi: 10.1523/JNEUROSCI.0147-07.2007. [DOI] [PMC free article] [PubMed] [Google Scholar]
- 10.Levitin DJ, Menon V. NeuroImage. 2003;20:2142–2152. doi: 10.1016/j.neuroimage.2003.08.016. [DOI] [PubMed] [Google Scholar]
- 11.Maess B, Koelsch S, Gunter TC, Friederici AD. Nat Neurosci. 2001;4:540–545. doi: 10.1038/87502. [DOI] [PubMed] [Google Scholar]
- 12.Mandell J, Schulze K, Schlaug G. Restorative Neurology and Neuroscience. 2007;25:323–334. [PubMed] [Google Scholar]
- 13.Hyde KL, Lerch JP, Zatorre RJ, Griffiths TD, Evans AC, Peretz I. J Neurosci. 2007;27:13028–13032. doi: 10.1523/JNEUROSCI.3039-07.2007. [DOI] [PMC free article] [PubMed] [Google Scholar]
- 14.Patel A. Nature Neuroscience. 2003;6:674–681. doi: 10.1038/nn1082. [DOI] [PubMed] [Google Scholar]
- 15.Hyde KL, Zatorre RJ, Griffiths TD, Lerch JP, Peretz I. Brain. 2006;129:2562–2570. doi: 10.1093/brain/awl204. [DOI] [PubMed] [Google Scholar]
- 16.Peretz I, Champod AS, Hyde K. Ann N Y Acad Sci. 2003;999:58–75. doi: 10.1196/annals.1284.006. [DOI] [PubMed] [Google Scholar]
- 17.Fillard P, Toussaint N, Pennec X. Similar NoE Tensor Workshop. Las Palmas: 2006. [Google Scholar]
- 18.Lawes INC, Barrick TR, Murugam V, Spierings N, Evans DR, Song M, Clark CA. NeuroImage. 2008;39:62–79. doi: 10.1016/j.neuroimage.2007.06.041. [DOI] [PubMed] [Google Scholar]
- 19.Wakana S, Jiang H, Nagae-Poetscher LM, van Zijl PCM, Mori S. Radiology. 2004;230:77–87. doi: 10.1148/radiol.2301021640. [DOI] [PubMed] [Google Scholar]
- 20.Sundaram SK, Sivaswamy L, Makki MI, Behen ME, Chugani HT. J Pediatr. 2008;152:250–255. doi: 10.1016/j.jpeds.2007.06.037. [DOI] [PubMed] [Google Scholar]
- 21.Hickok G, Poeppel D. Cognition. 2004;92:67–99. doi: 10.1016/j.cognition.2003.10.011. [DOI] [PubMed] [Google Scholar]


