Abstract
Imaging the structure and correlating it with the biochemical content of the retina holds promise for fundamental research and for clinical applications. Optical coherence tomography (OCT) is commonly used to image the 3D structure of the retina and while the added functionality of biochemical analysis afforded by Raman scattering could provide critical molecular signatures for clinicians and researchers, there are many technical challenges to combine these imaging modalities. We describe an OCT microscope for ex-vivo imaging combined with Raman spectroscopy capable of collecting morphological and molecular information about a sample simultaneously. We present our first results and discuss the challenges to further development of this dual-mode instrument and limitations for future in-vivo retinal imaging.
Keywords: optical coherence tomography, Raman spectroscopy, retinal imaging
1. Introduction
Optical coherence tomography is a powerful volumetric imaging modality that has proven to be successful for in-vivo imaging of the retina. It is commonly used by clinicians and researchers both to diagnose and monitor eye diseases and for improving our understanding of the structure of healthy eyes. Often functional tests (e.g., visual fields) can be correlated with changing structures in the eye, which are imaged with OCT, for a more complete understanding of eye function and disease. Raman spectroscopy is a spectroscopic method based on inelastic scattering of photons that allows the intrinsic biochemical composition of a sample to be identified. The combination of OCT and Raman spectroscopy could provide new insights into the retina. Here we describe a combined instrument for ex-vivo measurement of the retina.
OCT is an imaging modality that allows high volumetric resolution (few μm) mapping of the scattering intensity from the sample. OCT is similar to ultrasound techniques, but the intensity of backscattered light rather than sound waves is measured as a function of depth (in the tissue). The speed of light makes direct measurements of the time-of-flight, as in ultrasound, prohibitively difficult and expensive. Instead, a low-coherence light source (or swept laser) and an interferometer with a sample arm and a mirror in the reference arm have to be implemented to reconstruct the depth position of each backscattered photon. OCT in the time domain has become an essential tool in the diagnosis and treatment monitoring of human retinal disease [1]. In this method the position of the reference mirror varies allowing the axial shift of the coherence gate (zero path-length difference position in the sample). Because of the coherent detection scheme only photons from within the coherence gate can be detected. Thus, by moving the reference mirror at a constant speed, a backscattering intensity profile from the sample can be recorded as a function of time. Fourier-domain OCT (FD-OCT) [2-4] is an alternative to time-domain OCT where no scanning reference mirror is necessary and the whole depth scattering profile can be reconstructed by Fourier transformation of spectral fringes recorded by a spectrometer for a single reference mirror position. This parallel detection (whole depth profile is measured from one spectral fringe) offers a significant advantage in sensitivity and acquisition speed over the standard time-domain OCT technique [5]. The high speed of Fourier-domain OCT permits the 3D imaging of in-vivo retinal structures. More recent attempts to acquire functional data (beyond scalar scattering profiles) have also been demonstrated with Doppler FD-OCT (flow measurements) [6], polarization-sensitive FD-OCT (birefringence measurements) [7] as well as multifunctional systems [8]. Development of OCT systems for ophthalmic applications including adaptive optics OCT are a major thrust of the research in the Vision Science and Advanced Retinal Imaging Laboratory at UC Davis [9].
The Raman-scattering process, which was first discovered by C.V. Raman in 1928, involves the inelastic scattering of photons by interaction with molecular bonds [10]. When a material is illuminated by monochromatic light at an arbitrary wavelength, a small fraction of the photons will be scattered with a frequency shift that is directly related to the vibrational or rotational states of the molecular bonds in the material. Therefore, Raman spectroscopy is a powerful optical method for molecular detection and characterization that is applicable to a wide variety of disciplines (e.g., physics, biology, chemistry, and material science). In biology and biomedicine, Raman spectroscopy is particularly attractive because it provides molecular-level information without the need to use exogenous fluorescent labels or to perturb the sample using stains or chemical fixatives, and offers potential for in-vivo interrogation. The unique molecular signatures provided by a Raman spectrum allow biologists and clinicians to gain insight into disease progression at both the tissue and cellular levels [11]. The application of Raman spectroscopy in ophthalmology offers the potential for acquiring real-time, in-vivo chemical and functional information not easily obtained by other methods [12]. However, implementing Raman spectroscopy for in-vivo detection is challenging, because of the high laser-excitation intensities required to obtain a sufficient signal-to-noise ratio spectrum, which can easily damage delicate eye tissues. Resonance Raman spectroscopy could be used to circumvent this issue by allowing for the use of low-exposure conditions [13], however, it is molecule specific and requires prior knowledge about the sample. For a broader characterization of the entire molecular composition of the tissue (e.g., proteins, fatty-acid-based lipids, DNA, saccharides, cytochromes/hemes), spontaneous Raman spectroscopy is a more suitable method, but encounters the potential damage issues mentioned above. The advances in sophisticated optical design in conjunction with sensors with high quantum detection efficiency make ex-vivo or even in-vivo applications of Raman spectroscopy worth exploring. Previously, Beattie et al. [14] have systematically studied the retina ex vivo with confocal Raman microscopy under different excitation wavelengths and obtained significantly different Raman spectra from different layers of retina, which shows the potential of Raman spectroscopy as a clinical diagnostic tool for retinal and related neurological diseases.
In this paper, we report on the development and characterization of a Raman spectroscopy system in combination with OCT to obtain simultaneous chemical and structural information. This system will be used to characterize, ex vivo, the Raman spectra of retinal tissue and to determine the feasibility of in vivo retinal Raman/OCT imaging. A similar instrument for OCT-guided Raman was built by Patil et al. [15]. In that instrument, an individual Raman spectrum is collected based on a previously completed OCT B-scan. Their instrument was designed for skin tissues and has correspondingly higher power levels. In comparison, our instrument will focus on retinal tissue and allows for the simultaneous acquisition of Raman and OCT signals. Collecting a Raman spectrum at each OCT location introduces challenges for the instrument, but also allows a mapping of the Raman signature of different molecules to be correlated to the structure of the sample as measured by OCT. We present data collected from a nonbiological sample and ex-vivo human and porcine retinal samples to demonstrate that the instrument is functional. We also report on the challenges of combining these imaging modalities for retinal imaging and implications for in-vivo imaging.
2. Instrument description
As with many standard OCT systems we used a Michelson interferometer configuration with a reference and a sample arm. Both are shown in Figure 1. The sample arm is effectively a confocal microscope with OCT detection allowing reconstruction of back-scattering intensity depth profiles within the depth of field of the confocal beam.
Figure 1.
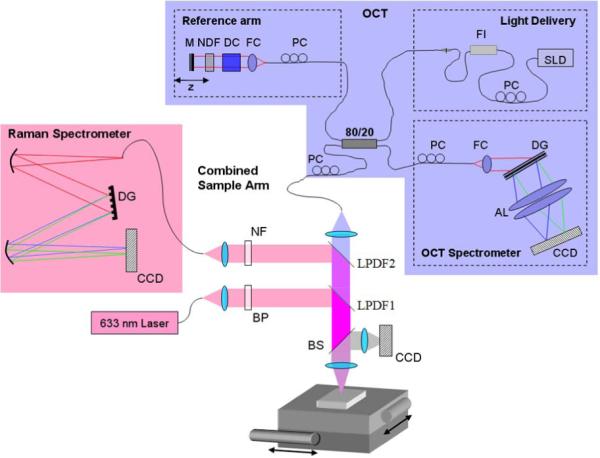
(online color at: www.biophotonics-journal.org) Layout of the combined OCT microscope and Raman spectrometer. AL: achromatic lens, BP: bandpass filter, BS: beamsplitter, DC: dispersion compensation, DG: diffraction grating, FC: fiber coupler, FI: fiber isolator, LPDF: longpass dichroic filter, M: mirror, NDF: neutral-density filter, NF: notch filter, PC: polarization control, SLD: superluminescent diode. The CCD in the sample arm is used as a viewfinder.
The initial focus position is adjusted by axially shifting the whole sample arm using an attached adjustable translation stage. Lateral scanning is achieved by an automated x-y translation stage (two VP-25XA Series Linear Stages, 25 mm travel, DC Servo w/Tach, 0.1 μm resolution; Newport) on which the sample is placed. OCT axial resolution depends on the light source used for imaging and in our case was of the order of 4.5 μm (λ0 = 855 nm; Δλ = 75 nm). More details about our OCT system can be found in our previous publication [9]. Lateral resolution (similar to standard confocal microscopy) is set by the imaging optics and mode field diameter (MFD) for the single-mode fiber. Thus, since two lenses (collimating f = 9 mm, and focusing f = 30 mm) offer magnification of 3.3 times, and MFD is about 5.4 μm, the lateral resolution is of the order of 18 μm. OCT single-line exposure time is usually set to 50 μs. Typically, 8 line scans are averaged for each position in the sample to improve system sensitivity. During scanning the Raman subsystem requires a significantly longer exposure time and the exposure times noted in the rest of the paper refer to the Raman exposure, while the OCTexposure time remains the same.
To the original OCT sample arm, a separate excitation and collection channel has been added for a Raman spectrometer. The combined system (including both OCT and Raman-detection spectrometers) is on a 3 foot by 2 foot optical table that can be wheeled through doorways for some portability. The CCD in the sample arm is used as a viewfinder for the system. Figure 2 is a photograph of the combined system.
Figure 2.
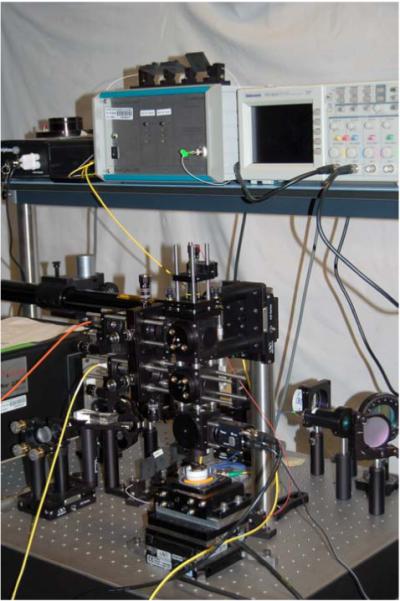
(online color at: www.biophotonics-journal.org) Picture of combined Raman-OCT system.
The Raman spectrometer subsystem has a fiber optic confocal configuration to reduce stray out-of-focus background light. The excitation light source of the system is a single-mode fiber coupled to a 632.8 nm He-Ne laser. This is collimated by an objective and the laser line of the collimated beam is spectrally shaped by a narrow bandpass filter to remove the plasma lines from the He-Ne laser. The laser beam is then reflected by a longpass dichroic filter (LPDF) and focused on the sample through an achromat. The focal shift between Raman and OCT wavelength introduced by the achromat (Thorlabs: AC254-030-B) is of the order of 100–150 μm. To correct for that, the axial position of the Raman light-delivery fiber was adjusted to achieve maximum intensity from uniformly scattering thin film placed at the focal point of the OCT beam. In the current set up approximately 4 mW of He-Ne laser light and 450 μW of OCT light is delivered to the sample. This is in contrast to the system of Patil et al. [15], which delivered 40 mW to the sample. The lower light level of our system corresponds more closely to the conditions needed for in-vivo retinal imaging, where light levels are likely to be of the order of 1 mW or less, depending on exposure time, wavelength and beam size at the retina [16]. The emitted Raman signal is collected by the same achromat and transmitted through the first (lower) LPDF1 and is reflected by a second (higher) LPDF2. LPDF1 is a dichroic longpass filter (Omega Optical) with a cut-on wavelength at ~640 nm and LPDF2 is a CVI Melles Griot: long-wave pass dichroic beamsplitter (LWP-45-RU670-TU800-PW-1025-C). The first LPDF reflects the input Raman signal and transmits everything above that wavelength while the second transmits the OCT signal and reflects the Raman signal.
The reflected Raman signal passes through a notch filter (633 nm Holographic Notch Filter, Kaiser Optical Systems) to remove the Rayleigh scattering from the sample and is focused into a multimode fiber coupled spectrometer. The multimode fiber has a 50 μm core and helps to reject the out-of-focus back-ground light. We estimate the spot size and depth of focus of the Raman excitation light at 15 μm and 2 mm, respectively. For Raman signal detection we estimate NA and spot size at 0.2 and 25 μm, respectively. The spectral resolution of our confocal micro-Raman setup is estimated to be ~6 cm−1, based on the spectrometer and camera specifications provided by the manufacturer.
3. Results and discussion
The combined OCT-Raman instrument collects an OCT and Raman signal from each point on a grid over the sample. Each OCT sample is a depth scan (A-scan) and each Raman signal is one spectrum. The size and sampling of the scan are limited by the data-acquisition time. Obtaining Raman spectra requires significantly longer integration time than required to acquire an OCT A-scan. Obtaining an OCT volume and the corresponding Raman map can therefore take many hours, causing degradation of the sample (primarily drying). The OCT data are processed and rendered into a volume in the same way that in-vivo data are processed. This method is described in previous works including Zawadzki et al. [17]. The data can be viewed as a volume (see Figure 6) or in cross section (see Figure 5). A Raman spectrum is collected for each A-scan but because of poor signal-to-noise ratio the spectra are generally averaged over neighboring samples. This, of course, reduces lateral resolution of the Raman maps depending on the number of averaged spectra. The spectra have a background polynomial fit subtracted to remove fluorescence, following the technique of Vickers et al. [18].
Figure 6.
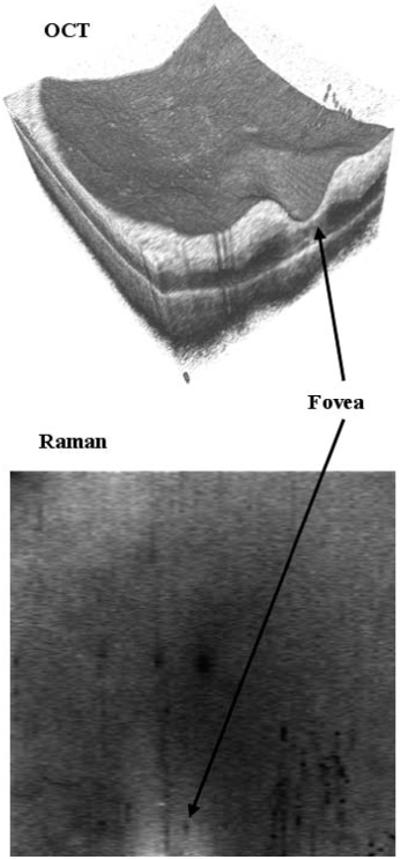
OCT image and Raman spectral map of human retina sample acquired over a 4 × 4 mm area with 400 × 80 sampling points. The Raman map is the average intensity of the Raman spectra over the range 1500 to 1630 cm−1. Each spectrum had an integration time of 0.2 s and the total time to image the sample was about 2 h.
Figure 5.
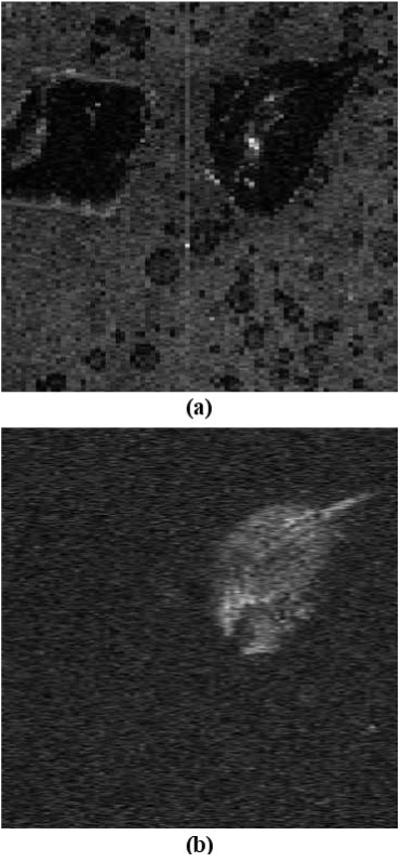
(a) OCT reconstructed C-scan compared to (b) Raman map at polystyrene peak. This data were acquired over 4 × 4 mm area with 400 × 80 lateral sampling locations. In the OCT image both samples are visible, but in the Raman map the polystyrene is clearly distinguished from the other polymer sample. The Raman map is averaged over 10 points from the Raman spectrum centered at the brightest peak of the polystyrene (1000 cm−1).
3.1 Nonbiological phantom
For testing the combined Raman-OCT system a non-biological phantom was constructed of two samples (polystyrene and another polymer that generates much weaker Raman signals) imbedded into a stable gel matrix for several hours (in air). The gel matrix does degrade over time as it dries, putting an outer limit on total measurement times.
The goal of this test was to demonstrate that two structures that could not be distinguished by OCT alone could be distinguished by the combined instrument. The Raman spectrum of each sample (outside the gel matrix) was measured with a 5 s exposure and the two spectra are compared in Figure 3.
Figure 3.
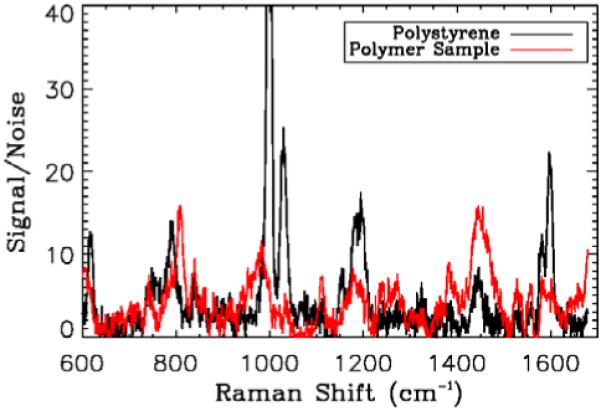
(online color at: www.biophotonics-journal.org) Comparison of Raman spectra from the polystyrene and second polymer sample when not imbedded in the gel sample. The integration time for these samples was 5 s, much longer than the integration time during combined OCT-Raman acquisition. The two polymers have different Raman signals. Signals are divided by the standard deviation of a region in the spectrum with no peak and a background polynomial fit is removed.
The signal from the second polymer sample is dominated by fluorescence (not shown on Fig 3), which has been removed by the polynomial fit, and the remaining spectrum is weaker than the polystyrene signal. As a metric of system performance the intensity is normalized as signal-to-noise ratio (the signal is divided by the standard deviation of a region of the spectrum with no peaks).
A shorter integration time is necessary in the scanning mode of the instrument to avoid an overly long total imaging time during which the sample can dry out. An OCT volume and corresponding Raman map were acquired for the sample with a 0.2 s integration time. We chose this integration time arbitrarily as a compromise between Raman signal intensity and total acquisition time. Shorter than 0.2 s exposure times would reduce Raman signal below the noise level. An average spectrum (of 100 Raman spectra) from the polystyrene sample (polystyrene embedded in gel) collected during combined OCT and Raman acquisition is compared to the signal obtained with the 5 s integration time from the sample alone in Figure 4.
Figure 4.
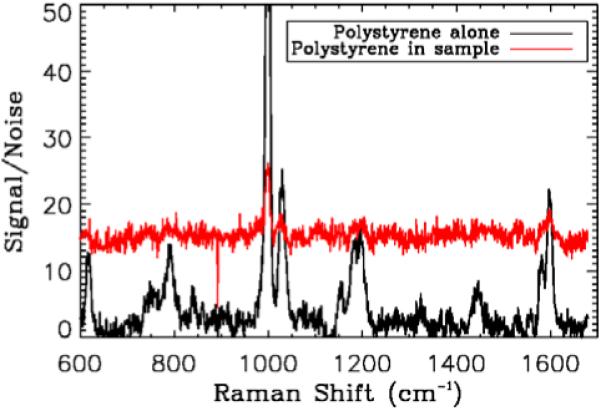
(online color at: www.biophotonics-journal.org) Comparison of Raman spectra from the polystyrene alone collected with the long integration time and from an average over 10 × 10 samples collected during combined Raman and OCT acquisitions from polystyrene sample. Signals are divided by the standard deviation of a region in the spectrum with no peak. While the signal-to-noise ratio is clearly smaller (and the background comprises more of the signal), characteristic peaks identified in the longer integration time are still visible.
The Raman signal of the second polymer sample is not visible with the short (200 ms) integration time. Capturing an individual Raman spectrum from the sample with a longer integration time does yield higher signal-to-noise ratio than the average of shorter exposure times (with total integration time longer). However the advantage of acquiring a Raman spectrum at each A-scan of the OCT data is the ability to generate Raman maps that correspond to OCT volumes. This result also suggests that for short exposure times our Raman measurements are detector-noise limited.
Figure 5 shows a comparison of an OCT cross section (virtual C-scan) (a) and the corresponding Raman map (b). This sample was not ideal for OCT as it is relatively transparent, but the basic structure of the phantom and the placement of the two crystals are quite visible (there are also some air bubbles in the sample and a few artifacts from multiple reflections).
A Raman map can be generated showing the signal for a particular Raman shift for each lateral location in the sample. These spectra are processed in the same way as the individual spectra shown above (i.e. the polynomial fit is removed before the map is generated). The Raman map in Figure 5 was generated by drawing the intensity of the polystyrene peak at about 1000 cm−1 at the corresponding lateral position on the sample. To enhance the contrast and to account for variations caused by the imaging optics the map was normalized over the field of view (divided by the average map from a region in the spectrum with no peaks). The other sample is not visible in any of the frames.
3.2 Retina sample
We wish to investigate the potential of Raman spectroscopy for characterizing the molecular content of retinal tissue. To this end, several ex-vivo retinal samples were measured with the instrument. A human sample and several fresh porcine samples, which were prepared in house, were used. The human sample had been preserved in glutaraldehyde for several months. Fresh porcine eyes were kept for several hours to a couple of days in a refrigerator. At the time of experiment the eyes were transected at the equator of the globe and placed on a dish. The porcine eye samples were disposed after imaging. We encountered great difficulty in preparing the fresh samples for imaging in the system. In particular for OCT imaging the structure of the retina should not be damaged, and removing the vitreous humor without damaging the retina proved challenging. This was further complicated by the young age of the donor animal. Porcine retinas have been already extensively characterized with great care taken in sample preparation and preservation to highlight individual cell types of the retina [14]. While histological samples are often prepared with these measures it is not representative of the conditions of in-vivo retinal imaging. We attempted to image bulk samples of tissue that were both larger and thicker than the samples described in previous literature [14]. The Raman signal from the fresh sample was substantially weaker than from the preserved sample and required longer integration times. The human sample used 0.2 s Raman integration times and the porcine sample was measured with 10 s integration times. Because of the long Raman integration time the combined measurement of Raman and OCT requires many hours, during which there is some degradation of the fresh sample due to dehydration.
Figure 6 is the OCT volume and a corresponding Raman map obtained for the human retina sample acquired over a 4 × 4 mm area with 400 × 80 sampling points. The layers of the retina are still visible although slightly degraded by age in the OCT volume. The foveal pit is labeled. There is some variation in the Raman intensity map across the sample. In general, the spectra are brighter in the foveal region, as seen in the Raman map of Figure 6. This is purely an intensity change, the structure of the Raman spectrum remains the same across the sample and an average over the foveal region is plotted in Figure 7.
Figure 7.
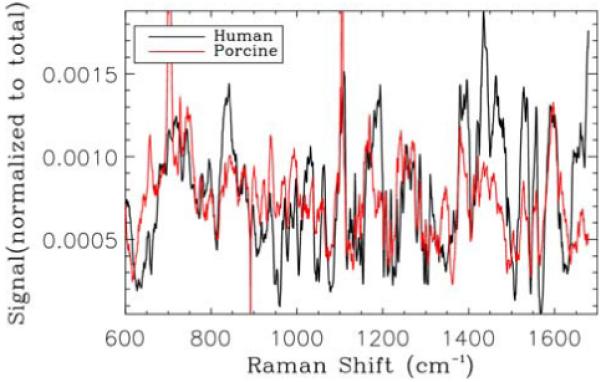
(online color at: www.biophotonics-journal.org) Normalized Raman spectra from the foveal region of the human sample (similar peaks are observed to the work of Beattie et al. [14]) compared with an average Raman spectrum obtained from a single B-scan of porcine retinal sample.
The corresponding Raman map of Figure 6 is over the wave number range of 1500 to 1630 cm−1, a band identified as corresponding to Cytochrome c (associated with mitochondria and playing a role in apoptosis) when 633-nm excitation is used [14] (note the three peaks in this region in Figure 7). This band was chosen to illustrate the similarity to the spectra obtained by others [14] and to show the variation in intensity observed with the Raman map. Differences between our spectra and those previously published are likely caused by the difference in sample preparation and Raman sampling volume. The bulk samples that we have imaged here and the increased size of the sampling volume (3 orders of magnitude) of our system make the spectra a summation of Raman and scattering signals from many different tissue types. While these spectra are more representative of the types of spectra likely to be obtained for in-vivo retinal imaging they are more difficult to interpret for retinal characterization purposes.
To confirm the reproducibility of the instrument and ensure that sample preservation did not alter the Raman spectra obtained for the retinal sample we also attempted to image fresh porcine retinal samples. In general, the intensity of the Raman signal from the fresh samples was weaker, requiring longer integration times of the order of 1 min per spectrum. To obtain a volume sample similar to the human retina shown above would require >15 h.
As already pointed out, due to sample drying the retina may be no longer at the focus of the instrument and both OCT signal and Raman signals are lost. This makes it difficult to acquire Raman data over more than a couple of B-scans. The lack of OCT and Raman signal as the focus shifts indicates that the measured signals are from the sample and the OCT and Raman beams are relatively well aligned axially. Raman spectra obtained corresponding to a single B-scan of the sample (red line) are averaged and compared to the human retina spectrum (black line) in Figure 7. The similarity in structure indicates the reproducibility of the Raman data and help confirms the performance of the instrument.
The differences between the human and porcine Raman spectra are probably caused by differences in the sample preparation, including the preservative added to the human sample.
4. Conclusions and future work
We have demonstrated a combined OCT-Raman microscope capable of collecting OCT volumetric data and biochemical Raman spectral maps simultaneously. As has been observed by other groups [15] the addition of Raman spectroscopy to OCT allows similar physical structures in the sample to be distinguished based on their chemical composition. We have collected several data sets using an ex-vivo human and porcine retinal samples to demonstrate the functionality of the instrument. The major challenges to future development are the weakness of the Raman signal and difficulty of obtaining good samples for testing. Longer integration times would improve signal-to-noise ratio, but would require a method of sustaining the sample over the long acquisition process. Placing a fresh sample inside a closed container may keep the retinas from drying allowing longer integration times and will be tested in the future. Wavelength selection for the Raman and OCT systems, such as using longer-wavelength Raman excitation light (e.g. 785 nm), or more advanced time-gating methods to separate the Raman signal from the autofluorescence can also be investigated to improve the signal from the retina samples.
The results obtained from the human and porcine sample are difficult to interpret and have low signal-to-noise ratio, however, they are likely representative of the challenges with in-vivo Raman spectroscopy. The light levels used here, while low for Raman spectroscopy are still too high for in-vivo retinal imaging. Thus, performing in-vivo Raman spectroscopy with high signal-to-noise ratio, in a clinically relevant time frame and with appropriately low laser exposure levels would require a different Raman detection scheme. For example, in-vivo Raman spectroscopy may be possible if specific peaks are identified in higher-power ex vivo imaging, but this type of characterization is better suited to resonant Raman spectroscopy, as done by Sharifzaden et al. [13]. The current instrument can be useful for ex-vivo studies, but optimization of the opto-mechanical system and a higher powered laser or more sensitive Raman spectrometers are probably required to make imaging more efficient. Changing the laser light source based on the chemical characterization of Beattie et al. could test the feasibility of stimulated Raman spectroscopy for in-vivo retinal imaging. The combined sample arm may also be useful for testing other spectroscopic techniques, such as autofluorescence, combined with OCT imaging.
Acknowledgements
The authors would like to thank Susan Garcia, Mark Greiner and Suman Pilli for their help in sample preparation. This research was supported by the National Eye Institute (grant EY 014743) and the National Institute on Aging (grant AG04058). This work was supported by funding from the National Science Foundation. The Center for Biophotonics, an NSF Science and Technology Center, is managed by the University of California, Davis, under Cooperative Agreement No. PHY 0120999. This work was performed under the auspices of the U.S. Department of Energy by Lawrence Livermore National Laboratory under Contract DE-AC52-07NA27344.
Biography

Julia W. Evans received her BS in Applied Physics from Stevens Institute of Technology in 2001. She completed her Ph.D. from University of California, Davis in 2006. Her thesis research was conducted under the Student Employee Graduate Research Fellowship at Lawrence Livermore National Laboratory and was in the area of adaptive optics for astronomical instrumentation. She is currently a Post-Doctoral Scholar with LLNL collaborating with the Vision Science and Advanced Retinal Imaging Laboratory and the NSF Center for Biophotonics working in the area of retinal imaging instrumentation and adaptive optics.

Robert J Zawadzki graduated from the Nicolaus Copernicus University in Torun, Poland and obtained his B.Sc. in Experimental Physics in 1998. In 2000 he obtained his M.Sc. in Medical Physics from the same university. He completed his Ph.D. program in Natural Sciences at the Technical University of Vienna, Austria in 2003. His Ph.D. research was performed at the Institute of Medical Physics, University of Vienna, Austria. In 2004 he started his post-doctoral position in Prof. John S. Werner’s Vision Science and Advanced Retinal Imaging Laboratory at Department of Ophthalmology & Vision Science, University of California Davis, Sacramento, CA where he has remained until now as an Assistant Research Professor.

Rui Liu received his B.S. degree in electrical engineering from Nanjing University, P.R. China, in 2003, and his M.E. degree in optical engineering from Shanghai Institute of Optics and Fine Mechanics, Chinese Academy of Sciences, P.R. China, in 2006. He is currently working towards his Ph.D. degree at NSF center for Biophotonics Science and Technology, UC Davis. He is mainly interested in biological applications of Raman spectroscopy & fluorescence spectroscopy, laser tweezer and optofluidics.

James Chan received his Ph.D. in chemical engineering from the University of California at Davis in 2002, where his research involved using Raman and fluorescence spectroscopy to study the modification of optical materials by ultrashort laser pulses. From 2003 to 2005, he was a postdoctoral researcher at Lawrence Livermore National Laboratory. There he worked on the development of laser tweezers, Raman spectroscopy, and CARS imaging to study single, biological particles and cells. Since 2005, he has been a staff scientist at Lawrence Livermore National Laboratory and a researcher at the NSF Center for Biophotonics Science and Technology, where his research has focused on the use and development of vibrational spectroscopy techniques involving, e.g. Raman, CARS, IR, and SERS for both medical and chemical sensing applications.

Stephen M. Lane is an Adjunct Professor in the UC Davis Department of Neurological Surgery and a visiting senior scientist in the Advanced Physics and Biophysics Division at Lawrence Livermore National Laboratory. He is currently the Chief Scientific Officer of the NSF/ UCD Center for Biophotonics. Dr. Lane received his Ph.D. in Applied Science Engineering from UC Davis in 1978. His research current interests include Raman spectroscopy and imaging, advanced optical microscopy, and computer simulations of light transport in tissue.

John S. Werner is a professor in the Department of Ophthalmology & Vision Science and in the Department of Neurobiology, Physiology & Behavior at the University of California, Davis. He received his Ph.D. in Psychology from Brown University in 1979. He has received the Humboldt Prize for Senior Scientists in the Natural Sciences (Bonn Germany).
References
- [1].Huang D, Swanson E, Lin C, Schuman J, Stinson W, Chang W, Hee M, Flotte T, Gregory K, Puliafito C, Fujimoto JG. Science. 1991;254:1178. doi: 10.1126/science.1957169. [DOI] [PMC free article] [PubMed] [Google Scholar]
- [2].Fercher A, Hitzenberger C, Kamp G, El-Zaiat S. Opt. Commun. 1995;117:43. [Google Scholar]
- [3].Wojtkowski M, Leitgeb R, Kowalczyk A, Bajraszewski T, Fercher A. J Biomed. Opt. 2002;7:457. doi: 10.1117/1.1482379. [DOI] [PubMed] [Google Scholar]
- [4].Nassif N, Cense B, Park B, Pierce M, Yun S, Bouma B, Tearney G, Chen T, de Boer J. Opt. Exp. 2004;12:367. doi: 10.1364/opex.12.000367. [DOI] [PubMed] [Google Scholar]
- [5].Leitgeb R, Hitzenberger CK, Fercher AF. Opt. Exp. 2003;11:889. doi: 10.1364/oe.11.000889. [DOI] [PubMed] [Google Scholar]
- [6].Leitgeb R, Schmetterer L, Drexler W, Fercher A, Zawadzki R, Bajraszewski T. Opt. Exp. 2003;11:3116. doi: 10.1364/oe.11.003116. [DOI] [PubMed] [Google Scholar]
- [7].Yasuno Y, Makita S, Sutoh Y, Itoh M, Yatagai T. Opt. Lett. 2002;27:1803. doi: 10.1364/ol.27.001803. [DOI] [PubMed] [Google Scholar]
- [8].Park B, Pierce M, Cense B, Yun S, Mujat M, Tearney G, Bouma B, de Boer J. Opt. Exp. 2005;13:3931. doi: 10.1364/opex.13.003931. [DOI] [PubMed] [Google Scholar]
- [9].Zawadzki RJ, Choi SS, Fuller AR, Evans JW, Hamann B, Werner JS. Opt. Exp. 2009;17:4084. doi: 10.1364/oe.17.004084. [DOI] [PMC free article] [PubMed] [Google Scholar]
- [10].Raman C, Krishnan K. Nature. 1928;121:501. [Google Scholar]
- [11].Hanlon E, Manoharan R, Koo T, Shafer K, Motz J, Fitzmaurice M, Kramer J, Itzkan I, Dasari R, Feld M. Phys. Med. Biol. 2000;45:1. doi: 10.1088/0031-9155/45/2/201. [DOI] [PubMed] [Google Scholar]
- [12].Erckens R, Jongsma F, Wicksted J, Hendrikse F, March W, Motamedi M. Lasers Med. Sci. 2001;16:236. doi: 10.1007/pl00011360. [DOI] [PubMed] [Google Scholar]
- [13].Sharifzadeh M, Zhao D, Bernstein P, Gellermann W. J. Opt. Soc. Am. A. 2008;25:947. doi: 10.1364/josaa.25.000947. [DOI] [PMC free article] [PubMed] [Google Scholar]
- [14].Beattie J, Brockbank S, McGarvey J, Curry W. Mol. Vis. 2007;13:1106. [PMC free article] [PubMed] [Google Scholar]
- [15].Patil C, Bosschaart N, Keller M, van Leeuwen T, Mahadevan-Jansen A. Opt. Lett. 2008;33:1135. doi: 10.1364/ol.33.001135. [DOI] [PMC free article] [PubMed] [Google Scholar]
- [16].Delori FC, Webb RH, Sliney DH. J. Opt. Soc. Am. A. 2007;24:1250. doi: 10.1364/josaa.24.001250. [DOI] [PubMed] [Google Scholar]
- [17].Zawadzki R, Choi S, Jones S, Oliver S, Werner J. J. Opt. Soc. Am. A. 2007;24:1373. doi: 10.1364/josaa.24.001373. [DOI] [PMC free article] [PubMed] [Google Scholar]
- [18].Vickers T, Wambles R, Jr., Mann C. Appl. Spectrosc. 2001;55:389. [Google Scholar]


