Abstract
The Nuclear Factor kappa B (NF-κB) transcription factor regulates cellular stress responses and the immune response to infection. NF-κB activation results in oscillations in nuclear NF-κB abundance. To define the function of these oscillations, we treated cells with repeated short pulses of tumor necrosis factor alpha (TNFα) at various intervals to mimic pulsatile inflammatory signals. At all pulse intervals analyzed, we observed synchronous cycles of NF-κB nuclear translocation. Lower frequency stimulations gave repeated full-amplitude translocations, whereas higher frequency pulses, gave reduced translocation, indicating a failure to reset. Deterministic and stochastic mathematical models predicted how negative feedback loops regulate both the resetting of the system and cellular heterogeneity. Altering the stimulation intervals gave different patterns of NF-κB-dependent gene expression, supporting a functional role for oscillation frequency.
Eukaryotic cells interpret multiple signals to coordinate the activity of transcription factors, which modulate the expression of target genes. NF-κB signaling in many mammalian cell types regulates responses to pathogens and stresses (1). NF-κB, most commonly comprising a dimer of RelA and p50, is bound in the cytoplasm of unstimulated cells by inhibitor kappa B (IκB) proteins. Stimulation by cytokines such as TNFα activates the inhibitor kappa B kinase (IKK) complex that phosphorylates IκB proteins, leading to IκB degradation and NF-κB translocation into the nucleus. Activated NF-κB regulates transcription from promoter regions of approximately 300 genes, including those encoding cytokines and several NF-κB family members which can feedback to regulate the system (2). Signaling through NF-κB can regulate diverse cellular outcomes including cell death or division (3). How such a diversity of responses is generated has remained unclear.
Real-time fluorescence imaging and mathematical modeling have shown that the activity of the NF-κB system can be oscillatory (4). This raised the possibility that, as with calcium (5), this signaling pathway might use oscillation frequency as one component of the cellular signal that controls innate immunity and cell fate. After stimulation with TNFα, target gene expression can be regulated by negative feedback loops that modulate cytoplasmic-nuclear translocation of NF-κB (4). One of these feedbacks is mediated by IκBα, which upon binding to NF-κB in the nucleus, shuttles the NF-κB protein complex back to the cytoplasm. These oscillations have been observed in single cells expressing the fluorescently labeled NF-κB subunit RelA and IκBα (4, 6, 7) and also through bulk cell electrophoretic mobility shift assay (EMSA) analysis in IκBε and IκBε-IκBβ knock-out mouse embryonic fibroblasts (MEFs) (8, 9).
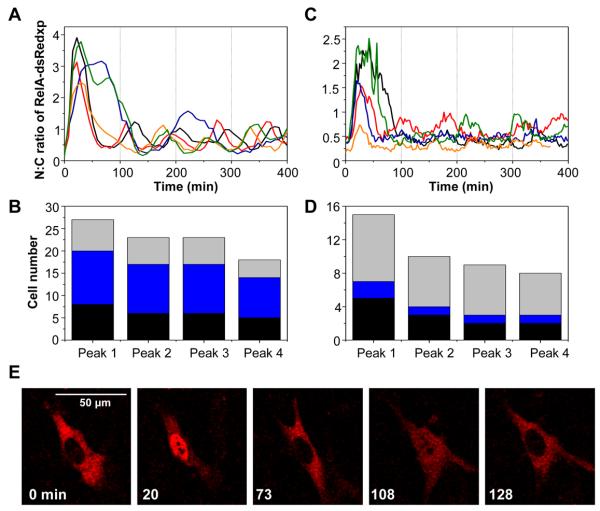
Single live cell fluorescent imaging has demonstrated NF-κB oscillations in various cell types (4, 6). SK-N-AS neuroblastoma cells showed particularly robust oscillations in response to TNFα simulation after transient (4) or stable transfection with a vector expressing RelA fused to the Discosoma sp. red fluorescent protein dsRed-Express (RelA-dsRedxp) (Fig. 1, A and B). Oscillations were unlikely to be the result of RelA over-expression, because stably transfected cells expressed nearly physiological amounts of the fusion protein (relative level of 0.91 ±0.04 (SD, n=6) compared to endogenous protein in untransfected control, (7)). In contrast to the conclusions of other reports (9, 10), we observed oscillations in the translocation of RelA-dsRedxp fusion protein in single transiently transfected MEFs (Fig. 1, C, D and E). These data (as well as bulk cell chromatin immunoprecipitation (ChIP) assays, Fig. S1), suggest that oscillations are a normal response to TNFα stimulation.
Fig. 1. RelA oscillations at the single cell level.
(A & C) Time-course of the ratio of nuclear to cytoplasmic localization (N:C) of RelA-dsRedxp in (A) SK-N-AS (stably transfected) and (C) MEF (transiently transfected) cells. Single cell dynamics are shown by different colored lines. (B & D) The number of cells (separate experiments represented by different colors) showing RelA-dsRedxp translocations in (B) stably transfected SK-N-AS (imaged for at least 350-min; 0 cells failed to respond) and (D) transiently transfected MEF cells (imaged for at least 250 min; 1 cell failed to respond). (E) Time-lapse confocal images of a typical RelA-dsRedxp-transfected MEF cell following TNFα stimulation.
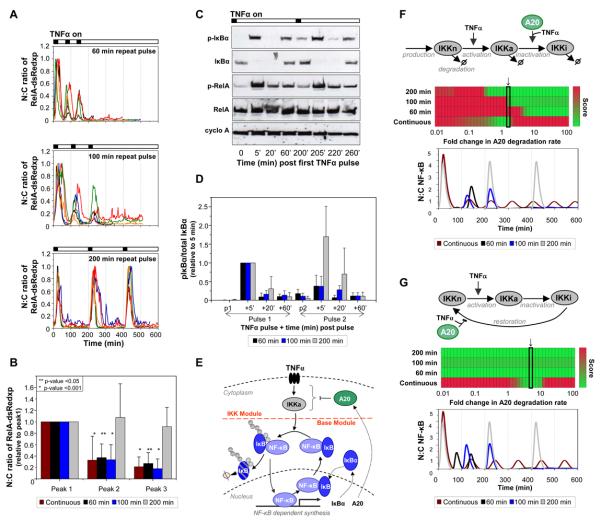
In an inflammatory tissue, cells receive pulsatile signals such as TNFα from neighboring cells (11, 12). To mimic this, we exposed cells to 5 min pulses of TNFα at various intervals, followed by wash-off. When stimulated at 200-min intervals, RelA-dsRedxp fusion protein expressed in SK-N-AS cells showed synchronous translocations from the cytoplasm to the nucleus and back of equal magnitude in response to each successive pulse (Fig. 2, A and B and fig. S4). In contrast, whereas stimulation at 100 or 60 min intervals also caused synchronous cell responses, there was significant reduction in the magnitude of RelA-dsRedxp fusion protein translocation (Fig. 2, A and B). These data indicate that the system completely resets between 100 and 200 min after each stimulus. Western blot analysis of synchronized cell populations supported the hypothesis that the cycles of RelA-dsRedxp fusion protein translocation were associated with cycles of phosphorylation at Ser32 and degradation of IκBα (Fig. 2C and fig. S5). Analysis of the amounts of Ser32-phospho-IκBα, relative to total IκBα levels, confirmed that the failure to reset was quantitatively reflected by the phosphorylation of IκBα (Fig. 2, C and D and fig. S6). Cycles of phosphorylation and dephosphorylation of RelA at Ser536 were consistent with RelA being phosphorylated in the cytoplasm and dephosphorylated in the nucleus (4).
Fig. 2. Response of SK-N-AS cells to various TNFα pulse frequencies.
(A) Time-course of RelA-dsRedxp N:C ratio in transiently transfected cells pulsed 3 times with TNFα for 5-min at intervals of 60-, 100- or 200-min (5 typical cells shown for each). RelA-dsRedxp N:C ratio was normalized to peak 1 intensity. (B) Amplitude of successive peaks of RelA-dsRedxp localization after pulses or continuous exposure of cells to TNFα. Results were normalized to the amplitude of peak 1 (+SD). Asterisks: p-values for 1-sample Wilcoxon test for mean peak amplitude=1, vs. ≠ alternative. (C) Western blot of Ser32 phospho-IκBα (p-IκBα), IκBα, Ser536 phospho-RelA (p-RelA), RelA, and cyclophilin A (cyclo A) amounts in cells stimulated with TNFα pulses 200-min apart. (D) Ratio of p-IκBα/total IκBα (relative to that recorded at t=5 min) in cells stimulated 60-, 100- and 200-min apart (+SD) (data based on (C), Fig. S4). p1 and p2 indicate time after pulse 1 or 2 for each stimulation protocol. (E) Two-feedback NF-κB signaling pathway showing IKK and Base Module. (F & G) Computational analysis of existing (F) (27) and proposed (G) IKK structures. Heat maps (red-poor to green-good) represent the ability of the model to quantitatively fit the experimental data for a range of selected parameter values (see Table S5). A20 degradation rate (c4) was varied on a logarithmic scale two orders of magnitude above/below 0.0009s−1. The best fit is highlighted, and corresponding simulated N:C ratio shown (F & G, bottom) for all TNFα stimulation conditions, (F) c4=0.00143s−1, or (G) c4=0.0045s−1
The inability of available model structures (7, 8, 13, 14) to provide a single parameter set that could simulate the observed behavior for all the tested TNFα stimulation conditions demonstrated a need for model refinement (Fig 2, E, F and G). We used the experimentally observed limited IκBα phosphorylation, associated with reduced NF-κB translocation level at higher pulse frequencies (Fig. 2, B and D), to constrain simulated IKK activity. The core NF-κB-IκBα network used a similar structure to that of previous models (Fig. 2E), although multiple model parameters were modified based in part on cell specific measurements (Table S1). Model simulations using the existing IKK network structure (14) (Fig. 2F) failed to recapitulate experimental conditions, because the repeated pulse stimulation required sufficient IKK activity to degrade almost all IκBα; however persisting oscillations observed with continual TNFα were sensitive to high IKK activity (Fig. S8 and S9). Using a scoring function to compare model performance to all experimental data (Table S5), we composed a new deterministic model with a modified network structure of IKK and A20 NF-κB inhibitory protein interactions (Fig. 2G and fig. S10). The chosen model represented the simplest structure that included IKK state recycling (15) and was able to use a single parameter set to reproduce all of the experimental data. The A20 feedback loop was assumed to include other related negative feedback inhibitors such as Cezanne (16) and CYLD (17), which together, may limit the reactivation of IKK. The model predicted low stability of A20, which could be compatible with a key regulatory factor being the ubiquitin editing activity of A20, rather than its protein concentration. A20 activity may be linked to processes upstream of IKK (18), or IKK-mediated phosphorylation of A20 may inhibit IKK activity (19).
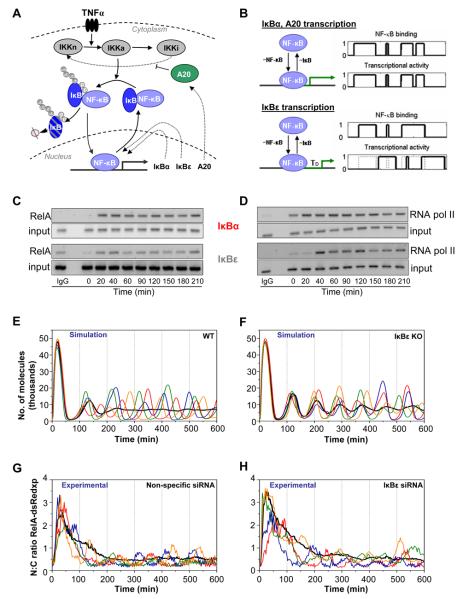
Persistent bulk cell oscillations have been observed following continuous TNFα using EMSA assays of MEFs from IκBε-deficient or combined IκBε-IκBβ-deficient animals (8, 9). Although deterministic simulation was appropriate for the work described above, the heterogeneous nature of single cell responses to continuous TNFα stimulation in wild-type cells cannot be elucidated in this manner. Stochastic models (20, 21) have been used to propose that cell-to-cell heterogeneity arises through intrinsic stochastic transcriptional variability, due to there only being two copies of the IκBα and A20 feedback genes (21). We developed a new hybrid, stochastic three-feedback model on the basis of the deterministic model structure described above, which considered delayed stochastic transcription from the IκBε gene and stochastic transcription of the IκBα and A20 genes (Fig. 3, A and B). ChIP analysis confirmed that RelA binds to the IκBα and IκBε promoters in SK-N-AS cells within 20 min after TNFα stimulation (Fig. 3C). In contrast, RNA Polymerase II was bound to the IκBα promoter before stimulation, whereas binding to the IκBε promoter was delayed (Fig. 3D), perhaps as a result of chromatin remodeling. The three-feedback stochastic model predicted persistent oscillations of similar amplitude in both wild-type (Fig. 3E) and IκBε-deficient cells (Fig. 3F) after stimulation. Furthermore, stochastic variation from delayed IκBε feedback may generate enhanced cell-to-cell heterogeneity in wild-type cells compared to that in IκBε-deficient cells. The lack of IκBε feedback could therefore generate increased cell-to-cell homogeneity, which was predicted to be detectable as oscillations at the average population level (Fig. 3F). Experimental small interfering RNA (siRNA) depletion of IκBε feedback in SK-N-AS cells (Fig. 3H) had no effect on oscillation amplitude (Fig. 3G), contradicting the prediction that IκBε feedback might dampen oscillations in wild-type cells (9). Although IκBε-deficient MEFs showed homogeneous cell-to-cell oscillations, the stochastic three-feedback model predicted that this effect would not occur in cells over-expressing RelA by as little as 2-fold (as in our siRNA knock-down experiments, see Fig. S15). Therefore, the three-feedback stochastic model was able to simulate and predict key aspects of the available experimental data.
Fig. 3. Role of the IκBε feedback loop.
(A) Diagram of NF-κB signaling pathway including three feedback mechansims. (B) Stochastic NF-κB-dependent regulation of IκBα, A20 (upper) and delayed IκBε (lower) genes. (C) RelA and (D) RNA polymerase II DNA binding to the IκBα and IκBε promoters after continuous TNFα stimulation by ChIP analysis. (E & F) Simulations of single cell trajectories and the 100-cell average (black line) for (E) wild-type and (F) IκBε knock-down conditions. (G & H) Time-course of N:C ratio of RelA-dsRedxp in cells transiently transfected with RelA-dsRedxp and either (G) non-specific or (H) IκBε siRNA. The average population (non-specific siRNA n=57, IκBε siRNA n=61) response is shown by a black line.
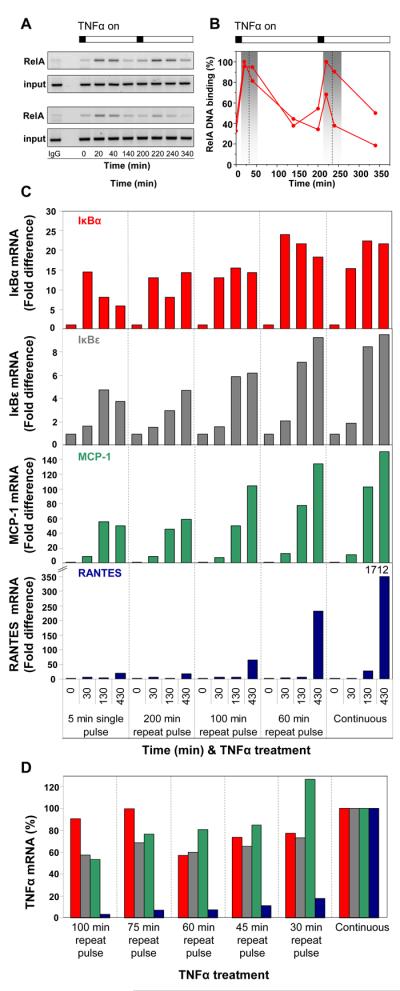
To assess the functional importance of oscillation timing in TNFα-induced NF-κB signaling in single cells, we used quantitative RT-PCR to measure the time-course of transcription from a set of early, middle and late NF-κB-dependent endogenous genes in response to various durations and frequencies of TNFα treatment. ChIP analyses after repeated 100 and 200 min pulses showed cycles of DNA binding (Fig. 4, A and B, and fig. S23). Over a 430-min time-course, we observed successively later peaks in mRNA transcription of four representative genes in response to TNFα stimulation (going from early to late; IκBα, IκBε, MCP-1, RANTES, Fig. 4C) (8, 22). Although IκBα responded equally to a 5-min single pulse of TNFα or to pulses at 200-min intervals, later genes showed reduced responses and the gene encoding the RANTES chemokine exhibited almost no response. There was an increase in late transcript abundance when stimuli were applied at 100 min intervals, which was even more marked when the cells were stimulated at shorter intervals (Fig. 4D). Thus, varying frequencies of NF-κB nuclear entry result in differential regulation of particular downstream genes.
Fig. 4. Stimulation frequency determines differential gene expression.

Cells were exposed to a single 5 min TNFα pulse or repeated pulses at 200-, 100-, or 60-min intervals or continuous treatment. (A) ChIP analysis of RelA-DNA binding at the IκBα promoter after a repeated TNFα pulse every 200 min. (B) Densitometric analysis of data with binding levels normalized to highest intensity. Dashed line represents the average peak 1 and peak 2 times with the grey box showing ± 2 SD (from data in Fig. 2A). (C) qRT-PCR analysis of IκBα, IκBε, MCP-1 and RANTES mRNA abundance in response to various TNFα stimulation frequencies. (D) qRT-PCR analysis of IκBα, IκBε, MCP-1 and RANTES mRNA abundance in response to various frequencies of TNFα treatments. Amounts are expressed as percentages of continuous TNFα stimulation.
In this study, we used combined experimental and computational studies to explain the source of cellular heterogeneity and show that oscillations are an important characteristic of the response of NF-κB to TNFα. Cells in inflammatory tissues may experience varying cytokine stimulation. In response to timed fluctuations in TNFα stimulation, the NF-κB response can become homogeneous and can be driven at differing frequencies. Such varying frequencies in stimulation resulted in altered gene expression profiles, specifically affecting the abundance of late gene transcription. These results therefore support a key functional role for oscillatory dynamics in this important stress response system. The recent observation that the yeast calcium-regulated transcription factor Crz1 also controls gene expression through nuclear translocation frequency (23), suggests that this behavior may be a property of other important signaling pathways, such as p53 (24).
Supplementary Material
Acknowledgments
We thank Neil Perkins for reading the manuscript, Dean Jackson, Marek Kimmel and Tomasz Lipniacki for discussion. The work was supported by: Biotechnology and Biological Sciences Research Council grants BBD0107481, BBF0059381, BBC0082191, BBC0071581; BBSRC studentships to LA and KS (AstraZeneca CASE); Medical Research Council grant G0500346; CH holds a Professor John Glover Memorial Research Fellowship; DR, an EPSRC Senior Fellowship (EP/C544587/1 and GR/S29256/01 and EU (BIOSIM Network Contract 005137)); DK, a Royal Society/Wolfson Merit Award; and VS a BBSRC David Phillips Research Fellowship (BBC5204711). Hamamatsu Photonics and Carl Zeiss provided training and technical support.
References and notes
- 1.Hayden MS, Ghosh S. Cell. 2008;132:344. doi: 10.1016/j.cell.2008.01.020. [DOI] [PubMed] [Google Scholar]
- 2.Hoffmann A, Baltimore D. Immunol Rev. 2006;210:171. doi: 10.1111/j.0105-2896.2006.00375.x. [DOI] [PubMed] [Google Scholar]
- 3.Perkins ND. Nat Rev Mol Cell Biol. 2007;8:49. doi: 10.1038/nrm2083. [DOI] [PubMed] [Google Scholar]
- 4.Nelson DE, et al. Science. 2004;306:704. doi: 10.1126/science.1099962. [DOI] [PubMed] [Google Scholar]
- 5.Berridge MJ, Bootman MD, Roderick HL. Nat Rev Mol Cell Biol. 2003;4:517. doi: 10.1038/nrm1155. [DOI] [PubMed] [Google Scholar]
- 6.Friedrichsen S, et al. Endocrinology. 2006;147:773. doi: 10.1210/en.2005-0967. [DOI] [PMC free article] [PubMed] [Google Scholar]
- 7.Nelson DE, et al. Science. 2005;308:52. [Google Scholar]
- 8.Hoffmann A, Levchenko A, Scott ML, Baltimore D. Science. 2002;298:1241. doi: 10.1126/science.1071914. [DOI] [PubMed] [Google Scholar]
- 9.Kearns JD, Basak S, Werner SL, Huang CS, Hoffmann A. J Cell Biol. 2006;173:659. doi: 10.1083/jcb.200510155. [DOI] [PMC free article] [PubMed] [Google Scholar]
- 10.Barken D, et al. Science. 2005;308:52. author reply 52. [Google Scholar]
- 11.Covert MW, Leung TH, Gaston JE, Baltimore D. Science. 2005;309:1854. doi: 10.1126/science.1112304. [DOI] [PubMed] [Google Scholar]
- 12.Werner SL, Barken D, Hoffmann A. Science. 2005;309:1857. doi: 10.1126/science.1113319. [DOI] [PubMed] [Google Scholar]
- 13.Ihekwaba AE, et al. Syst Biol (Stevenage) 2005;152:153. doi: 10.1049/ip-syb:20050050. [DOI] [PubMed] [Google Scholar]
- 14.Lipniacki T, Paszek P, Brasier AR, Luxon B, Kimmel M. J Theor Biol. 2004;228:195. doi: 10.1016/j.jtbi.2004.01.001. [DOI] [PubMed] [Google Scholar]
- 15.Hacker H, Karin M. Sci STKE. 2006;2006:re13. doi: 10.1126/stke.3572006re13. [DOI] [PubMed] [Google Scholar]
- 16.Enesa K, et al. J Biol Chem. 2008;283:7036. doi: 10.1074/jbc.M708690200. [DOI] [PubMed] [Google Scholar]
- 17.Trompouki E, et al. Nature. 2003;424:793. doi: 10.1038/nature01803. [DOI] [PubMed] [Google Scholar]
- 18.Sun SC. Nat Rev Immunol. 2008;8:501. doi: 10.1038/nri2337. [DOI] [PMC free article] [PubMed] [Google Scholar]
- 19.Hutti JE, et al. Mol Cell Biol. 2007;27:7451. doi: 10.1128/MCB.01101-07. [DOI] [PMC free article] [PubMed] [Google Scholar]
- 20.Hayot F, Jayaprakash C. J Theor Biol. 2006;240:583. doi: 10.1016/j.jtbi.2005.10.018. [DOI] [PubMed] [Google Scholar]
- 21.Lipniacki T, Paszek P, Brasier AR, Luxon BA, Kimmel M. Biophys J. 2006;90:725. doi: 10.1529/biophysj.104.056754. [DOI] [PMC free article] [PubMed] [Google Scholar]
- 22.Tian B, Nowak DE, Brasier AR. BMC Genomics. 2005;6:137. doi: 10.1186/1471-2164-6-137. [DOI] [PMC free article] [PubMed] [Google Scholar]
- 23.Cai L, Dalal CK, Elowitz MB. Nature. 2008;455:485. doi: 10.1038/nature07292. [DOI] [PMC free article] [PubMed] [Google Scholar]
- 24.Lahav G, et al. Nature Genet. 2004;36:147. doi: 10.1038/ng1293. [DOI] [PubMed] [Google Scholar]
Associated Data
This section collects any data citations, data availability statements, or supplementary materials included in this article.


