

Abstract
The information and resources generated from diverse “omics” technologies provide opportunities for producing novel biological knowledge. It is essential to integrate various kinds of biological information and large-scale omics data sets through systematic analysis in order to describe and understand complex biological phenomena. For this purpose, we have developed a Web-based system, Plant MetGenMAP, which can comprehensively integrate and analyze large-scale gene expression and metabolite profile data sets along with diverse biological information. Using this system, significantly altered biochemical pathways and biological processes under given conditions can be retrieved rapidly and efficiently, and transcriptional events and/or metabolic changes in a pathway can be easily visualized. In addition, the system provides a unique function that can identify candidate promoter motifs associated with the regulation of specific biochemical pathways. We demonstrate the functions and application of the system using data sets from Arabidopsis (Arabidopsis thaliana) and tomato (Solanum lycopersicum), respectively. The results obtained by Plant MetGenMAP can aid in a better understanding of the mechanisms that underlie interesting biological phenomena and provide novel insights into the biochemical changes associated with them at the gene and metabolite levels. Plant MetGenMAP is freely available at http://bioinfo.bti.cornell.edu/tool/MetGenMAP.
The rapid proliferation of genome-scale data for plants and other organisms makes it possible to systematically study diverse cellular processes. As heterogeneous high-throughput data sets have been acquired from different technologies in the “omics” fields, such as genomics, transcriptomics, proteomics, and metabolomics, it has become necessary to develop computational tools that can integrate and analyze them efficiently (Yuan et al., 2008). Microarrays and recently emerged RNA-Seq technology have proven to be crucial tools in producing transcriptional data sets by simultaneously detecting the expression of thousands of genes (Wang et al., 2009). These data sets hold useful information for the study of gene functions in diverse biological processes, including stress responses and developmental programs. Meanwhile, metabolomics, which investigates the profiles of all metabolites in an organism under specific conditions using techniques such as gas chromatography-mass spectrometry (GC-MS), has been regarded as an important research field in the postgenomic area, especially for plants due to their significant chemical diversity (Oksman-Caldentey and Saito, 2005).
In recent years, new functional annotations of genes have been added to diverse biological networks, including regulatory networks, protein-protein interaction networks, and metabolic pathways. Despite these advances, dynamic behaviors of genes in specific pathways under specific conditions are still largely unexplored. Thus, in addition to the integration of heterogeneous data sources, analysis of them under the context of pathways is regarded as an essential step for functional studies of a complex biological system. In this type of analysis, transcriptomic data are normally mapped onto specific metabolic pathways to investigate the coordinated behavior of a set of genes. Developing efficient tools for this type of analysis is important in systematically characterizing and understanding the dynamics of biochemical pathways through utilization of multilevel information.
As detailed information of biological pathways has been developed, both experimentally and computationally, more complete and precise pathways have been mapped. Currently, the representative biochemical pathway databases include MetaCyc (http://metacyc.org/) and the Kyoto Encyclopedia of Genes and Genomes (KEGG; http://www.genome.ad.jp/kegg/). MetaCyc contains experimentally verified metabolic pathway and enzyme information curated from the scientific literature as well as computationally predicted metabolic networks for more than 1,600 different organisms (Krieger et al., 2004). KEGG is a knowledge base in terms of the network of genes and molecules resulting from their activities (Ogata et al., 1999; Kanehisa et al., 2008). These databases are the primary resources that can be utilized to understand how genes and molecules are connected in biochemical pathways. Moreover, they can be combined with new resources or technologies for genomic and functional analysis, making it possible to expand previous databases and obtain increased depth and range of functions. For example, the database EGENES was developed to place genomic information, including ESTs of many plant species, into metabolic pathways and was integrated into the KEGG suite of databases (Masoudi-Nejad et al., 2007).
Several analytical tools have been developed to identify patterns of gene expression that are responsible for potent biological effects by integrating large-scale transcriptomic data with diverse biological information such as pathways and associated metabolites. Pathway Processor is a tool for visualizing expression data on metabolic pathways and evaluating which metabolic pathways are affected by transcriptional changes (Grosu et al., 2002). However, the use of this tool is limited to yeast. A similar tool, Pathway Miner, was developed to mine gene associations and networks of biological pathway information within mammalian organisms such as human and mouse (Pandey et al., 2004). Recently, several similar tools have been developed specifically for plant species. The most widely used is MapMan, a user-driven tool that displays large data sets onto diagrams of metabolic pathways or biological processes (Thimm et al., 2004). One of the main functions of MapMan is to classify genes into functional categories called bins. The extended version of MapMan is able to identify statistically overrepresented functional categories (Usadel et al., 2005). Another analysis system for plant species is KaPPA-View, a Web-based tool for displaying quantitative data for individual transcripts and metabolites on plant metabolic pathway maps stored in KEGG (Tokimatsu et al., 2005). The Omics Viewer in the Pathway Tools package allows scientists to visualize large-scale gene expression and metabolomics data sets on metabolic pathways predicted by the Pathway Tools for any organism of interest (Paley and Karp, 2006). However, both KaPPA-View and Omics Viewer provide very limited functions of statistical analysis or project management.
We have developed a Web-based system, Plant MetGenMAP, which can identify significantly altered biochemical pathways and highly affected biological processes and predict functional roles of pathway genes and potential pathway-related regulatory motifs from transcript and metabolite profile data sets. Plant MetGenMAP is an easy-to-use, powerful analysis system that supports many functions of systems biology analyses in the context of biochemical pathways and Gene Ontology (GO) terms. It provides an analytical platform in which highly altered pathways can be explored rapidly and efficiently through intuitive visualization and robust statistical tests. Since it allows for the analysis of transcriptional and metabolic changes simultaneously for each pathway, the association between gene expression and biochemical changes in specific pathways under specific conditions can be easily inferred. Functional analysis of differentially regulated pathways can help to properly define functional roles of genes within pathways. In addition, the system embeds a function that can identify major regulators putatively related to the change of transcripts and metabolites in specific pathways. The functions of Plant MetGenMAP were demonstrated using transcript and/or metabolite profiles from the model plant species Arabidopsis (Arabidopsis thaliana) and tomato (Solanum lycopersicum). We present comprehensive results identified with Plant MetGenMAP, including differentially regulated metabolic pathways, functions of genes associated with pathway changes, putative regulators associated with these genes, and probabilistic associations between genes, metabolites, and phenotypes.
RESULTS AND DISCUSSION
Description of the Plant MetGenMAP System
Plant MetGenMAP is a Web-based system that can comprehensively integrate and analyze large-scale gene expression and metabolite profile data sets along with diverse biological information such as biochemical pathways and GO terms. As shown in Figure 1, the system consists of four data repositories, three functional components, and four analysis modules. All parts are flexibly integrated to perform user-requested tasks.
Figure 1.

Overview of the Plant MetGenMAP system. Plant MetGenMAP contains three functional components (Data Management, Pathway Browser, and Dataset Analyzer), four analysis modules (PathVisualizer, PathFinder, PromAnalyzer, and FunctAnnotator), and four data repositories (Pathway Repository, Sequence Repository, Gene Function Repository, and User Dataset).
The four data repositories in the Plant MetGenMAP system are biochemical pathways from several major plant species (Pathway Repository), promoter and coding sequences of all genes collected in the system (Sequence Repository), functional annotations of all genes, including gene descriptions and associated GO terms (Gene Function Repository), and user-uploaded data sets (User Dataset; Fig. 1). The system maintains the pathway structure information in a flat file format written with the DOT language that can be processed by the Graphviz program (Ellson et al., 2003). Information regarding the relationship between pathways and genes/metabolites, gene annotations and sequences, and the user-uploaded data sets, including project information, are stored in the back-end MySQL database for efficient manipulation.
The three functional components in Plant MetGenMAP are data management, pathway browser, and data set analyzer (Fig. 1). The data management component deals with data uploading and the overall information and management of user-created projects (Fig. 2A). Plant MetGenMAP takes normalized and processed expression and metabolite profile data (mainly ratios/fold changes and P values that are derived from statistical analysis programs) as the input to identify significantly affected biological process and biochemical pathways. The system allows users to upload and analyze gene expression and metabolite profile data separately or simultaneously. A new project is created during each data upload process. The project information contains the project title and description and the corresponding platform and organism information. All projects are managed by a data management component, making it possible to analyze the associated data sets further by setting new values of parameters, such as the cutoff values of fold change and P values that define the up- and down-regulation of genes/metabolites. In addition, the system provides a summary that lists the number of up- and down-regulated genes/metabolites under each condition for each project. The system also allows users to completely remove their projects from the system. To ensure security of user-uploaded data sets and project information, the system is designed such that projects can only be accessed and managed by the users who create them. The pathway browser component is the visualization part that lists metabolic pathways in which transcript or metabolite changes are observed. Plant MetGenMAP retrieves the list of metabolic pathways that are highly correlated to the given expression or metabolite profiles. The list of pathways can be shown in two ways: the tree view and the ranked list. The tree view allows users to navigate all available pathways in a hierarchical structure with the altered pathways highlighted (Fig. 2B). On the other hand, the ranked list only displays altered pathways in the ascending order of P values. Furthermore, this component also shows the detailed information of genes in the altered pathways and provides promoter analysis of coexpressed genes to identify regulatory motifs potentially involved in regulating specific pathways. Finally, the data set analyzer component allows users to identify enriched GO terms (e.g. biological process) under specific experimental conditions as well as to categorize genes into different functional classes. In addition, the keyword search can be performed to identify terms of interest, including metabolites, enzymes, and pathways.
Figure 2.

Screen images of the Plant MetGenMAP system. A, Data management system in Plant MetGenMAP. B, Tree view of all metabolic pathways under a specific experimental condition with altered pathways shown in red. C, Sample output of gene functional classification. D, Visualization of an altered pathway. Changes of gene and metabolite levels as well as the significance of the changes are represented by different background colors.
The analysis modules support the corresponding functional components through different kinds of analyses using the data repositories. They include (1) statistical analysis of pathway changes (PathFinder); (2) identification of regulatory motifs (PromAnalyser); (3) functional analysis of gene annotations (FunctAnnotator); and (4) visualization of individual pathways (PathVisualizer; Fig. 1). PathFinder calculates the significance of pathway changes based on changes in gene expression levels or metabolite content and then rapidly retrieves significantly altered pathways. The raw P values indicating the significance of pathway changes can be further corrected for multiple testing using the false discovery rate (FDR; Benjamini and Hochberg, 1995) or Bonferroni correction. PromAnalyzer retrieves the promoter sequences of coexpressed genes in an altered pathway and identifies enriched regulatory motifs from said promoter sequences. FunctAnnotator analyzes a list of up- and/or down-regulated genes under specific conditions and reports a list of significantly enriched GO terms. FunctAnnotator can also classify a list of genes into different functional categories using a set of plant-specific GO slims, which are a list of high-level GO terms providing a broad overview of the ontology content (http://www.geneontology.org/GO.slims.shtml). A sample output of the functional classification generated by the system is shown in Figure 2C. PathVisualizer provides an intuitive visualization of each individual pathway, with genes and metabolites decorated using different colors reflecting the changes of their respective levels (e.g. ratios) and the significances of the changes (e.g. P values; Fig. 2D). The expression changes of genes from a given family are displayed on the pathway separately for each individual gene. This is a more accurate representation than using average or extreme values, since genes from the same family often behave differently. In addition, tables listing the absolute values of quantitative changes as well as the significance of the changes of all the genes and metabolites in the pathway are provided in the system.
Plant MetGenMAP currently supports different expression profiling platforms for several major plant organisms, including (1) ATH1 genome array and The Arabidopsis Information Resource (TAIR) Arabidopsis Genome Initiative locus number for Arabidopsis; (2) Affymetrix genome array and genome locus number for rice (Oryza sativa); and (3) TOM1 array, TOM2 array, Affymetrix genome array, and Solanaceae Genome Network (SGN) unigenes for tomato. More platforms from additional plant species can be easily added to the system. Plant MetGenMAP operates on a Linux system under an Apache Web server, and the majority of the functions in the system were implemented with Perl/CGI or R scripts.
Mapping Gene Expression Profiles to Metabolic Pathways in Arabidopsis
We first demonstrated the functions of the Plant MetGenMAP system using a publicly available expression data set generated from Arabidopsis seedlings treated with 14 different light conditions, among which seven were treated for 4 h (long-term light treatments) and seven were treated for 45 min (short-term light treatments; Supplemental Table S1). The normalized and processed microarray data set was uploaded into the Plant MetGenMAP system. Genes with fold changes greater than 1.5 and corrected P values (FDR) less than 0.05 were regarded as differentially expressed genes. The system can efficiently map genes onto each biochemical pathway and identify significantly altered pathways under each condition.
The significantly altered pathways under each of the 14 light treatment conditions were retrieved with a P value cutoff of less than 0.05. The list of all significantly altered pathways is provided in Supplemental Table S2. As expected, a number of known light-regulated metabolic pathways were among the list of the most highly altered pathways, including photosynthesis, Calvin cycle, and carotenoid biosynthesis pathways. Significant differences in pathway changes between long-term and short-term light treatments were also observed. Table I lists pathways that were significantly altered only under either long-term or short-term light treatment in at least four out of the seven conditions. Several notable light-regulated pathways, including photosynthesis, photosynthesis (light reaction), and chlorophyllide a biosynthesis, were significantly altered under all seven long-term light treatment conditions, while none of these were significantly altered under short-term conditions. In addition, the Calvin cycle and salicylic acid biosynthesis pathways were also affected specifically by the long-term light treatments (Table I). Our analysis could provide an explanation at the molecular level with relevance to the finding that UV light stimulates the accumulation of salicylic acid in plant leaves (Yalpani et al., 1994).
Table I.
Pathways specifically regulated by long-term or short-term light
| Pathway | Light Treatmenta |
|---|---|
| Photosynthesis | AL, BL, FL, PL, RL, UL, WL |
| Photosynthesis, light reaction | AL, BL, FL, PL, RL, UL, WL |
| Chlorophyllide a biosynthesis | AL, BL, FL, PL, RL, UL, WL |
| Calvin cycle | BL, FL, RL, WL |
| Salicylic acid biosynthesis | BL, FL, RL, UL |
| Anthocyanin biosynthesis | FS, PS, RS, WS |
| Flavonoid biosynthesis | AS, FS, PS, RS |
| Spermidine biosynthesis | AS, BS, PS, WS |
| Spermine biosynthesis | AS, BS, PS, US, WS |
| Stachyose biosynthesis | AS, BS, US, WS |
| Superpathway of polyamine biosynthesis | AS, BS, PS, US, WS |
Treatments under which the pathway was significantly altered. AL, BL, FL, PL, RL, UL, and WL represent long-term (4 h) treatment of UV-A/dark, blue, far-red, red/dark, red, UV-A/B/dark, and white light, respectively; AS, BS, FS, PS, RS, US, and WS represent short-term (40 min) treatment of UV-A/dark, blue, far-red, red/dark, red, UV-A/B/dark, and white light, respectively. A detailed description of each treatment is available in Supplemental Table S1.
As shown in Table I, pathways regulated specifically by short-term light treatments include anthocyanin biosynthesis, flavonoid biosynthesis, spermidine biosynthesis, spermine biosynthesis, stachyose biosynthesis, and polyamine biosynthesis. It is well known that light plays a critical role in the regulation of anthocyanin and flavonoid biosynthesis (Koes et al., 2005; Grotewold, 2006). In addition, through an integrated analysis of gene expression and metabolite profiling, Jumtee et al. (2008) found that the photoreceptor phytochrome A regulated the biosynthesis of polyamines, including spermidine and spermine. However, no previous reports that we are aware of have described the possible participation of light involvement in stachyose biosynthesis.
Several reports have described the biochemical pathways affected by different qualities and quantities of light based on whole genome expression profiling analysis (Ma et al., 2001; Jiao et al., 2005). Our analysis identified a large number of previously described as well as novel light-regulated biochemical pathways from a comprehensive gene expression data set (Supplemental Table S2). The functions implemented in the Plant MetGenMAP system are able to retrieve highly affected pathways efficiently and comprehensively and allow us to visualize the detailed gene expression changes within a pathway intuitively, which facilitates insights into important biological processes that remain to be fully characterized.
Promoter Analysis of Coexpressed Genes in a Specific Pathway
Plants have evolved the ability to synthesize a large variety of metabolites to protect themselves against various attacks and to attract flower pollinators. The regulation of metabolite biosynthesis is coordinated by specific transcription factors (Grotewold, 2005). A notable example is the regulation of the anthocyanin biosynthetic pathway by MYB transcription factors (Gantet and Memelink, 2002). Bioinformatics analysis has indicated that genes within the same pathway, especially those clustered together in the pathway structure, are usually highly coexpressed (Wei et al., 2006). This implies that those genes might be regulated by common transcription factors. Experimental evidence also supports that a subset of genes in the same pathway could be regulated by common transcription factors (Borevitz et al., 2000; Jin et al., 2000; van der Fits and Memelink, 2000). Based on these reports, we implemented a function in Plant MetGenMAP to identify overrepresented motifs from promoter sequences of a set of coexpressed genes in a specific metabolite pathway. These motifs may play an important role in transcriptional regulation of enzymes controlling specific pathways.
To demonstrate the efficiency of this function, we extracted overrepresented motifs in six significantly altered pathways using the microarray data sets generated under long-term UV-A and short-term blue light treatments. The six pathways are photosynthesis, photosynthesis (light reaction), chlorophyllide a biosynthesis, Leu degradation, Val biosynthesis, and spermine biosynthesis. Among a number of overrepresented motifs generated in these pathways, a total of four are known to be related to light-responsive genes (Table II). The motif CACGTGGC was enriched in promoters of up-regulated genes in the photosynthesis (light reaction) pathway. This motif is similar to G-boxes, elements with the core CACGTG that are found repeatedly in light-regulated genes (Terzaghi and Cashmore, 1995). Another similar element, GmCACGTG, was also identified in the photosynthesis pathway. In addition, a motif (GCCACGTG) found in the photosynthesis (light reaction) pathway contains the computationally identified phytochrome A-induced motif, SORLIP 1 (GCCAC), which is overrepresented in light-induced genes (Jiao et al., 2005). The element AGATAAGA was enriched in promoters of coexpressed genes in the Leu degradation pathway. This element consists of an I-box motif (GATAAG) that has been reported to be conserved in the upstream sequences of light-regulated genes (Giuliano et al., 1988; Martinez-Hernandez et al., 2002) and can confer responsiveness to diverse light spectra, including far-red, red, and blue light (Chattopadhyay et al., 1998; Escobar et al., 2004). Similar elements, GATmAGnm, AGATAAGn, and AGATAAGA, were also identified in the Leu degradation pathway under the far-red, red, and blue light treatments, respectively (data not shown). In addition, our analysis identified a number of novel motifs that might have potential roles in regulating specific biochemical pathways under different light treatments. Sequence logos of all the identified known and novel motifs are provided in Supplemental Figure S1. In summary, the motif identification tool provided in the Plant MetGenMAP system can aid us in identifying important candidate transcriptional regulators that coordinately modulate the expression of a subset of genes in a specific metabolic pathway and in further engineering the production of important plant metabolites.
Table II.
Known enriched regulatory motifs from the altered pathways in light treatments
| Consensus | Pathway | Motif Name | P Value of Motif Enrichment | Reference of Known Motif |
|---|---|---|---|---|
| CACGTGGC | Photosynthesis, light reaction | G-box | 2.13e-12 | Terzaghi and Cashmore (1995) |
| GCCACGTG | Photosynthesis, light reaction | SORLIP 1 | 2.13e-12 | Jiao et al. (2005) |
| GmCACGTG | Photosynthesis | G-box | 3.5e-11 | Terzaghi and Cashmore (1995) |
| AGATAAGA | Leu degradation pathway | I-box | 2.03e-4 | Giuliano et al. (1988); Chattopadhyay et al. (1998); Martinez-Hernandez et al. (2002); Escobar et al. (2004) |
Functional Analysis of Gene Expression
Large-scale expression profiling experiments such as microarray and RNA-Seq often produce a list of differentially expressed genes, which could contain hundreds or thousands of genes of interest. Translating such lists of genes into biologically meaningful information is normally required to better understand the underlying biological phenomena. This can be achieved in part by applying GO term enrichment analysis. Through this kind of analysis, a set of overrepresented GO terms, which represent highly affected biological processes, can be extracted from a list of differentially regulated genes. Using the GO term enrichment analysis tool implemented in Plant MetGenMAP, we were able to identify a total of 218 significantly enriched GO terms belonging to the biological process category from lists of up-regulated genes in the 14 light treatment conditions using a cutoff Bonferroni-corrected P value of ≤0.05 (Supplemental Fig. S2). Figure 3A shows the most enriched GO terms (P ≤ 1.0e-10), among which two (response to radiation and response to light stimulus) are highly enriched in all 14 conditions. In addition, a number of GO terms that were highly enriched only in long-term or short-term light treatment conditions were identified (Fig. 3A; Supplemental Fig. S2), which clearly showed the differences in plant responses to different durations of light treatment.
Figure 3.

Functional analysis of gene expression profiles under light treatments in Arabidopsis. A, Significantly enriched GO terms of the biological process category identified from up-regulated genes in each of 14 light treatments with a P value cutoff of less than 1.0e-10 in at least one light treatment. Numbers on the color bar indicate −log(P value), where P value represents the significance of the enrichment. B, Functional classification of genes up-regulated in each of the 14 light treatments. The genes were classified into a set of plant-specific GO slims of the biological process category. Numbers on the color bar represent the percentage of genes classified into a specific GO slim. AL, BL, FL, PL, RL, UL, and WL represent long-term (4 h) treatment of UV-A/dark, blue, far-red, red/dark, red, UV-A/B/dark, and white light, respectively; AS, BS, FS, PS, RS, US, and WS represent short-term (40 min) treatment of UV-A/dark, blue, far-red, red/dark, red, UV-A/B/dark, and white light, respectively. A detailed description of each light treatment is available in Supplemental Table S1.
One of the major tasks in gene expression data analysis is to classify a list of genes of interest into different functional categories. In the Plant MetGenMAP system, we implemented a tool that uses a set of plant-specific GO slims to classify genes. Using this tool, we functionally categorized up-regulated genes in each of the 14 light treatments. As shown in Figure 3B, most of the light-induced genes fall into categories such as response to stress, response to abiotic stimulus, transcription, and metabolic process, indicating that light treatments trigger systems that help plants to fight against light stresses and that light treatments caused significant changes of associated primary and secondary metabolite levels.
Associating Genes, Metabolites, and Phenotypes in Tomato Using Plant MetGenMAP
Tomato has long served as the primary physiological, biochemical, genetic, and molecular model for fleshy fruit development and ripening (Giovannoni, 2001, 2004). A collection of tomato lines harboring single, defined, and overlapping introgressions from the wild species Solanum pennellii was generated (Eshed and Zamir, 1994) and has proved to be a valuable resource for tomato quantitative trait locus mapping and breeding. Substantial line-to-line variations of various different phenotypes (traits) and the levels of transcripts and metabolites have been observed among these introgression lines (Baxter et al., 2005; Schauer et al., 2006; Tieman et al., 2006). Among the many interesting lines in this collection, IL3-2 has the yellow fruit phenotype (Fig. 4A). This line includes the S. pennellii introgression segment containing the R gene (fruit-specific phytoene synthase; Fray and Grierson, 1993) and has very low levels of lycopene (Rousseaux et al., 2005). To systematically understand transcript and metabolite changes in this interesting line, we performed comparative transcriptome and target metabolite analyses on IL3-2 and its cultivated S. lycopersicum parent line M82.
Figure 4.

Changes of the carotenoid biosynthesis pathway in tomato introgression line IL3-2. A, Ripening fruit of IL3-2 and its cultivated S. lycopersicum parent line M82. B, Changes of gene expression levels and metabolite contents of the carotenoid biosynthesis pathway in IL3-2 compared with M82. Genes/metabolites with green background are down-regulated in IL3-2, those with yellow background are not changed, and those with gray background are not measured. Steps after β-carotene in the pathway are not shown since they were not investigated in this study.
Tomato TOM1 cDNA arrays were used to investigate the genome-wide transcript changes between ripening fruit of IL3-2 and the M82 control. The contents of a set of metabolites in the carotenoid biosynthesis pathway, including trans-lycopene, phytoene, phytofluene, cis-lycopene, γ-carotene, β-carotene, α-carotene, δ-carotene, and lutein, were also measured in ripening fruit of IL3-2 and M82. The normalized transcript and metabolite profiles were simultaneously analyzed using the Plant MetGenMAP system. We treated genes and metabolites with changes between IL3-2 and M82 greater than 2-fold as significantly modified genes/metabolites. We were able to identify a number of significantly altered pathways (FDR < 0.05) in IL3-2 (Table III). As expected, the carotenoid biosynthesis pathway was highly altered. Figure 4B, which was generated automatically by the system based on the expression and metabolite levels, provides visualization of the gene and metabolite changes of the carotenoid biosynthesis pathway in IL3-2. It clearly shows that the decreased level of phytoene synthase, an upstream enzyme in the pathway, was associated with significant decreases in all downstream metabolites that were investigated and that is causal of the yellow fruit phenotype of IL3-2.
Table III.
Pathways significantly altered in tomato introgression line IL3-2
| Pathway | P (FDR) |
|---|---|
| Carotenoid biosynthesis | 0.00073 |
| Glu degradation III | 0.00073 |
| Suc degradation I | 0.00135 |
| Arg degradation VII (arginase 3 pathway) | 0.01583 |
| LOX pathway | 0.04162 |
| Jasmonic acid biosynthesis | 0.04162 |
Several other pathways were also significantly altered in IL3-2, including the Suc degradation pathway, lipoxygenase pathway, jasmonic acid biosynthesis, Glu degradation, and Arg degradation. β-Fructofuranosidase (or acid invertase), a major enzyme in the Suc degradation pathway, cleaves Suc and related sugars into hexoses such as Glc and Fru and controls sugar composition. The expression of β-fructofuranosidase is highly induced during tomato fruit ripening (Klann et al., 1993). In IL3-2, we found that the expression of β-fructofuranosidase was significantly repressed. We then further investigated changes of Glc and Fru levels in IL3-2. Consistent with the changes of β-fructofuranosidase, the contents of Glc and Fru were also significantly decreased (Fig. 5). Lipoxygenase (LOX) has been suggested to play a role in wound responses, pathogen attack, potato (Solanum tuberosum) tuber enlargement (Feussner and Wasternack, 2002), and fruit flavor generation (Griffiths et al., 1999). LOX is also an enzyme in the jasmonic acid biosynthesis pathway (León and Sánchez-Serrano, 1999). Several LOX genes have been identified in tomato, among which the expression of TomloxA declines during fruit ripening while TomloxB and TomloxC expression is enhanced (Griffiths et al., 1999). It was reported that TomloxA displays negative correlation with respect to carotenoid accumulation and may provide an essential defense component in unripe fruit (Griffiths et al., 1999). Consistent with this report, we observed that in IL3-2, which accumulates much less carotenoid, the expression of TomloxA was significantly increased. Glu decarboxylase, the key enzyme in the Glu degradation pathway, has been reported to be down-regulated by fruit ripening (Gallego et al., 1995), while the relative content of Glu, the substrate of Glu decarboxylase, increased markedly in red fruit (Boggio et al., 2000; Pratta et al., 2004). In IL3-2, we found that the level of Glu decarboxylase was significantly increased. However, to get a deeper understanding of the changes of the above pathways, further study is required to obtain comprehensive metabolite profiles of these pathways.
Figure 5.

Contents of Glc and Fru in IL3-2 and M82. Ripe fruit (7 d after the onset of ripening) were taken from tomato introgression line IL3-2 and its cultivated S. lycopersicum parent line M82, and the contents of Glc and Fru were determined. Results are means ± se of at least four replicate samples. fw, Fresh weight.
In summary, using the Plant MetGenMAP system, we could efficiently identify significantly altered biochemical pathways in a tomato introgression line, IL3-2. Besides the changes of the expected carotenoid biosynthesis pathway that cause the yellow fruit phenotype of IL3-2, several other ripening-related biochemical pathways were also significantly altered. In addition, the intuitive pathway visualization tool in Plant MetGenMAP allowed for a better understanding of the underlying molecular complexity resulting in the yellow fruit phenotype of IL3-2.
CONCLUSION
During the past decade, the amount of biological data and knowledge has increased immensely thanks to genomics tools and approaches. The explosion of genomic data along with other omics data has put a great responsibility on the bioinformatics community to aid in the management and analyses of such data. There is a need to not only analyze but also to integrate these data with functional information and a priori knowledge. The development of efficient and powerful in silico integrative analysis techniques can allow for higher levels of discovery and knowledge that may not be obtained otherwise. We have developed a Web-based system, Plant MetGenMAP, which can efficiently integrate genomic and functional genomics resources with diverse biological information such as biochemical pathways and GO terms to produce informative results through robust statistical analyses and intuitive visualizations. Plant MetGenMAP has several advantages of complementary approaches in data analysis and visualization. First, the system is platform independent, user friendly, and simple to use. It does not require any additional software except a Web browser or any Web plug-ins for users to run the system. Second, the system keeps previously analyzed projects and allows users to analyze the projects sufficiently and repeatedly using different parameter settings without the need to reupload their data sets. Third, the system returns very reliable results in the analysis of altered pathways and biological processes through several robust statistical tests. The system also provides an intuitive visualization of pathways in which users can obtain details of changes in gene expression and metabolite contents within a pathway. Finally, the system provides a unique function that aids in promoter analysis to identify major potential regulators of interesting metabolite pathways.
The demonstration with data sets from Arabidopsis and tomato suggested that Plant MetGenMAP is a powerful analysis and visualization package for plant systems biology. The system can greatly help researchers to generate novel biological hypotheses and derive new conclusions from high-throughput omics data sets.
MATERIALS AND METHODS
Collection and Processing of Biochemical Pathway and Gene Annotation Information
The attribute value flat files of AraCyc (Arabidopsis [Arabidopsis thaliana] metabolic pathway database), RiceCyc (rice [Oryza sativa] metabolic pathway database), and LycoCyc (tomato [Solanum lycopersicum] metabolic pathway database) pathways were obtained from TAIR (http://www.arabidopsis.org/), Gramene (http://www.gramene.org/), and SGN (http://www.sgn.cornell.edu), respectively. The pathway structure information was extracted from these files using a custom python script and then converted to the DOT language, a plain text graph description language that can be processed by the Graphviz package for visualization (Ellson et al., 2003), using an in-house Perl script. Synonyms for each metabolite in the pathways were also collected from these pathway databases and stored in the system. Plant MetGenMAP accepts full metabolite names as well as their synonyms.
The promoter sequences (1 kb upstream) and annotations (including GO terms) of Arabidopsis and rice genes were obtained from TAIR and the Rice Genome Annotation Project (http://rice.plantbiology.msu.edu/), respectively. No promoter sequences are currently used for tomato, since its whole genome sequencing is not finished yet. Tomato genes were annotated by comparing their sequences against GenBank nr and Swiss-Prot/TrEMBL protein databases using the BLAST program with an E-value cutoff of 1e-15. InterPro and Pfam domains were also identified for tomato genes by comparing their sequences against the InterPro (Hunter et al., 2009) and Pfam (Finn et al., 2008) databases, respectively. GO terms were assigned to tomato genes using the GO Annotation Database (Camon et al., 2004) based on their top Swiss-Prot/TrEMBL hits and using the InterPro-2GO and Pfam2GO mappings (http://www.geneontology.org/external2go) based on their corresponding InterPro and Pfam domains. To functionally classify genes into different categories, GO terms assigned to each gene were mapped to a set of plant-specific GO slims using a Perl script, map2slim.pl. Both the plant GO slims and the Perl script were obtained from the GO Web site (http://www.geneontology.org/GO.slims.shtml). All of the pathway and gene annotation data in the system are updated to the most recent releases from the corresponding source databases.
Statistical Test for Identifying Altered Pathways
The identification of significantly altered pathways in Plant MetGenMAP is achieved by analyzing the distribution of genes or metabolites for all pathways. The significance of an altered pathway is determined by the hypergeometric test:
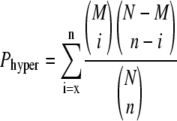 |
where N is the total number of genes or metabolites in all the pathways, M is the total number of genes or metabolites in a particular pathway, n is the total number of significantly changed genes or metabolites in all the pathways, and x is the total number of significantly changed genes or metabolites in that particular pathway. Suppose that we have a total of N genes in all the pathways and M genes belong to a particular pathway; then the P value represents the possibility that we observe x or more changed genes belonging to that particular pathway from a sample of n changed genes of all the pathways. The P values obtained from the hypergeometric test can be adjusted for multiple tests using the FDR control as proposed by Benjamini and Hochberg (1995) and the Bonferroni correction, which were implemented in the system using the R language.
Identification of Enriched Regulatory Motifs
The overrepresented regulatory motifs can be identified from the promoters of coexpressed genes in a specific pathway. Here, the coexpressed genes are defined as significantly up- or down-regulated genes under a specific condition. Plant MetGenMAP employs MotifSampler, a motif-sampling tool that is based on Gibbs sampling and a higher order background model (Thijs et al., 2001), to identify overrepresented motifs. Plant MetGenMAP uses third order Markov models for MotifSampler to identify motifs. Each identified motif is then screened against all promoter sequences of the corresponding organism and against the promoters of the list of coexpressed genes using PatMatch (Yan et al., 2005) to identify the frequency of the motif. A posthoc test is then performed to calculate the P value of the motif overrepresentation in coexpressed genes based on the hypergeometric distribution. For each motif, the system provides its consensus sequences, P value of its enrichment, the sequence logo generated by the WebLogo program (Crooks et al., 2004), as well as their positions in the corresponding promoters.
Identification of Overrepresented GO Terms
Plant MetGenMAP provides a tool to identify enriched GO terms from a list of up- and/or down-regulated genes under a specific experimental condition. The tool was implemented based on the GO∷TermFinder Perl module, which uses the hypergeometric distribution to calculate the significance of GO term enrichment (Boyle et al., 2004). Three different multiple test correction methods are provided in the module: FDR, simulation-based correction, and Bonferroni correction.
Arabidopsis Gene Expression Data Set
CEL files of the light treatment expression data set were obtained from the Nottingham Arabidopsis Stock Centre (Craigon et al., 2004). Detailed description of the data set is available at the Nottingham Arabidopsis Stock Centre Web site (http://affymetrix.arabidopsis.info/narrays/experimentpage.pl?experimentid=124). The data set was generated from hypocotyls and cotyledons of Arabidopsis seedlings treated with different light spectra, including far-red, UV-A, white, UV-A/B, blue, and red light (Supplemental Table S1), using the Arabidopsis ATH1 genome array. The CEL files were processed and normalized at the probe level using the GC content-based robust multiarray algorithm (Wu et al., 2004). Significance of gene expression changes between each light-treated plant and the control plant was determined using the LIMMA test, which is based on linear models and empirical Bayes methods (Smyth, 2004). Raw P values from each comparison were corrected for multiple tests using the FDR control as proposed by Benjamini and Hochberg (1995).
Tomato Gene Expression and Metabolite Profile Data Set
Comparison of transcriptomes of red ripe fruit (7 d after the onset of fruit ripening) between Solanum pennellii-derived introgression line IL3-2 (Eshed and Zamir, 1994) and its S. lycopersicum parent M82 was conducted using the publicly available tomato TOM1 cDNA array. The procedures of total RNA extraction, cDNA synthesis and labeling, microarray hybridization and scanning, and microarray image analysis were the same as described by Alba et al. (2004, 2005). Three biological replicates were performed for the comparison. Raw quantified array data were normalized using the print-tip LOWESS normalization strategy implemented in the marray package in Bioconductor (Yang et al., 2002). Data points flagged by the image analysis program as poor quality and spots with mean signal intensities less than local background intensities plus 2 sds of the local background in both channels were filtered out. Only spots with three nonfiltered replicated data points were used for the analysis. In addition, spots with coefficient of variation greater than 0.3 were discarded except those with all three replicates having greater than 1.5-fold change. The remaining spots with high-quality and reproducible data points were then mapped to SGN unigenes, and the average ratio of gene expression between IL3-2 and M82 was derived for each unigene.
The contents of carotenoids in the ripe fruit of IL3-2 and M82 were measured using the same methods as described by Alba et al. (2005). The carotenoids investigated in this study include trans-lycopene, phytoene, phytofluene, cis-lycopene, γ-carotene, β-carotene, α-carotene, δ-carotene, and lutein. At least four biological replicates were performed for each metabolite, and the ratio of average content between IL3-2 and M82 was derived.
Glc and Fru contents of M82 and IL3-2 ripe fruit were determined by the method of Tandon et al. (2003) with some modifications. Ripe fruit was harvested and homogenized in a blender. The homogenate was immediately frozen in liquid nitrogen and stored at −80°C until analysis. Samples were thawed, and 4 mL of water was added to 5 g of homogenate, followed by heating at 90°C for 15 min. The sample was filtered through Miracloth (Calbiochem), followed by filtration through a Sep-Pak C18 filter (Waters) and a Millipore 0.45-μm filter (Millipore). Prepared samples were separated on a Waters SugarPak1 column maintained at 90°C with a mobile phase of 1 mm Ca2EDTA and detection with a Waters 2410 refractive index detector.
All tomato microarray and metabolite profile data, as well as the associated experiment information, were deposited in the Tomato Functional Genomics Database (http://ted.bti.cornell.edu; Fei et al., 2006).
Supplemental Data
The following materials are available in the online version of this article.
Supplemental Figure S1. Overrepresented motifs identified from coexpressed genes in highly altered pathways.
Supplemental Figure S2. Enriched GO terms of biological process category in light treatments.
Supplemental Table S1. Description of the light treatment conditions.
Supplemental Table S2. Significantly altered pathways (P ≤ 0.05) under each of the 14 light treatment conditions.
Supplementary Material
Acknowledgments
We are grateful to Dr. Lukas Mueller for helpful discussion.
This work was supported by the National Science Foundation (grant nos. DBI–0501778, DBI–0605659, and DBI–082061).
The author responsible for distribution of materials integral to the findings presented in this article in accordance with the policy described in the Instructions for Authors (www.plantphysiol.org) is: Zhangjun Fei (zf25@cornell.edu).
The online version of this article contains Web-only data.
Open Access articles can be viewed online without a subscription.
References
- Alba R, Fei Z, Payton P, Liu Y, Moore S, Debbie P, Cohn J, D'Ascenzo M, Gordon J, Rose J, et al (2004) ESTs, cDNA microarrays, and gene expression profiling: tools for dissecting plant physiology and development. Plant J 39 697–714 [DOI] [PubMed] [Google Scholar]
- Alba R, Payton P, Fei Z, McQuinn R, Debbie P, Martin GB, Tanksley SD, Giovannoni JJ (2005) Transcriptome and selected metabolite analyses reveal multiple points of ethylene control during tomato fruit development. Plant Cell 17 2954–2965 [DOI] [PMC free article] [PubMed] [Google Scholar]
- Baxter CJ, Sabar M, Quick WP, Sweetlove LJ (2005) Comparison of changes in fruit gene expression in tomato introgression lines provides evidence of genome-wide transcriptional changes and reveals links to mapped QTLs and described traits. J Exp Bot 56 1591–1604 [DOI] [PubMed] [Google Scholar]
- Benjamini Y, Hochberg Y (1995) Controlling the false discovery rate: a practical and powerful approach to multiple testing. J R Stat Soc B 57 289–300 [Google Scholar]
- Boggio SB, Palatnik JF, Heldt HW, Valle EM (2000) Changes in the amino acid composition and nitrogen metabolizing enzymes in ripening fruits of Lycopersicon esculentum Mill. Plant Sci 159 125–133 [DOI] [PubMed] [Google Scholar]
- Borevitz JO, Xia Y, Blount J, Dixon RA, Lamb C (2000) Activation tagging identifies a conserved MYB regulator of phenylpropanoid biosynthesis. Plant Cell 12 2383–2394 [DOI] [PMC free article] [PubMed] [Google Scholar]
- Boyle EI, Weng S, Gollub J, Jin H, Botstein D, Cherry JM, Sherlock G (2004) GO:TermFinder: open source software for accessing Gene Ontology information and finding significantly enriched Gene Ontology terms associated with a list of genes. Bioinformatics 20 3710–3715 [DOI] [PMC free article] [PubMed] [Google Scholar]
- Camon E, Magrane M, Barrell D, Lee V, Dimmer E, Maslen J, Binns D, Harte N, Lopez R, Apweiler R (2004) The Gene Ontology Annotation (GOA) database: sharing knowledge in Uniprot with Gene Ontology. Nucleic Acids Res 32 D262–D266 [DOI] [PMC free article] [PubMed] [Google Scholar]
- Chattopadhyay S, Puente P, Deng XW, Wei N (1998) Combinatorial interaction of light-responsive elements plays a critical role in determining the response characteristics of light-regulated promoters in Arabidopsis. Plant J 15 69–77 [DOI] [PubMed] [Google Scholar]
- Craigon DJ, James N, Okyere J, Higgins J, Jotham J, May S (2004) NASCArrays: a repository for microarray data generated by NASC's transcriptomics service. Nucleic Acids Res 32 D575–D577 [DOI] [PMC free article] [PubMed] [Google Scholar]
- Crooks GE, Hon G, Chandonia JM, Brenner SE (2004) WebLogo: a sequence logo generator. Genome Res 14 1188–1190 [DOI] [PMC free article] [PubMed] [Google Scholar]
- Ellson J, Gansner E, Koutsofios L, North S, Woodhull G (2003) Graphviz and dynagraph: static and dynamic graph drawing tools. In M Junger, P Mutzel, eds, Graph Drawing Software. Springer-Verlag, Berlin, pp 127–148
- Escobar MA, Franklin KA, Svensson AS, Salter MG, Whitelam GC, Rasmusson AG (2004) Light regulation of the Arabidopsis respiratory chain: multiple discrete photoreceptor responses contribute to induction of type II NAD(P)H dehydrogenase genes. Plant Physiol 136 2710–2721 [DOI] [PMC free article] [PubMed] [Google Scholar]
- Eshed Y, Zamir D (1994) A genomic library of Lycopersicon pennellii in L. esculentum: a tool for fine mapping of genes. Euphytica 79 175–179 [Google Scholar]
- Fei Z, Tang X, Alba R, Giovannoni J (2006) Tomato Expression Database (TED): a suite of data presentation and analysis tools. Nucleic Acids Res 34 D766–D770 [DOI] [PMC free article] [PubMed] [Google Scholar]
- Feussner I, Wasternack C (2002) The lipoxygenase pathway. Annu Rev Plant Biol 53 275–297 [DOI] [PubMed] [Google Scholar]
- Finn RD, Tate J, Mistry J, Coggill PC, Sammut JS, Hotz HR, Ceric G, Forslun K, Eddy SR, Sonnhammer EL, et al (2008) The Pfam protein families database. Nucleic Acids Res 36 D281–D288 [DOI] [PMC free article] [PubMed] [Google Scholar]
- Fray RG, Grierson D (1993) Identification and genetic analysis of normal and mutant phytoene synthase genes of tomato by sequencing, complementation and co-suppression. Plant Mol Biol 22 589–602 [DOI] [PubMed] [Google Scholar]
- Gallego PP, Whotton L, Picton S, Grierson D, Gray JE (1995) A role for glutamate decarboxylase during tomato ripening: the characterisation of a cDNA encoding a putative glutamate decarboxylase with a calmodulin-binding site. Plant Mol Biol 27 1143–1151 [DOI] [PubMed] [Google Scholar]
- Gantet P, Memelink J (2002) Transcription factors: tools to engineer the production of pharmacologically active plant metabolites. Trends Pharmacol Sci 23 563–569 [DOI] [PubMed] [Google Scholar]
- Giovannoni J (2001) Molecular biology of fruit maturation and ripening. Annu Rev Plant Physiol 52 725–749 [DOI] [PubMed] [Google Scholar]
- Giovannoni J (2004) Genetic regulation of fruit development and ripening. Plant Cell (Suppl) 16 S170–S180 [DOI] [PMC free article] [PubMed] [Google Scholar]
- Giuliano G, Pichersky E, Malik VS, Timko MP, Scolnik PA, Cashmore AR (1988) An evolutionarily conserved protein binding sequence upstream of a plant light-regulated gene. Proc Natl Acad Sci USA 85 7089–7093 [DOI] [PMC free article] [PubMed] [Google Scholar]
- Griffiths A, Barry C, Alpuche-Solis AG, Grierson D (1999) Ethylene and developmental signals regulate expression of lipoxygenase genes during tomato fruit ripening. J Exp Bot 50 793–798 [Google Scholar]
- Grosu P, Townsend JP, Hartl DL, Cavalieri D (2002) Pathway Processor: a tool for integrating whole-genome expression results into metabolic networks. Genome Res 12 1121–1126 [DOI] [PMC free article] [PubMed] [Google Scholar]
- Grotewold E (2005) Plant metabolic diversity: a regulatory perspective. Trends Plant Sci 10 57–62 [DOI] [PubMed] [Google Scholar]
- Grotewold E (2006) The genetics and biochemistry of floral pigments. Annu Rev Plant Biol 57 761–780 [DOI] [PubMed] [Google Scholar]
- Hunter S, Apweiler R, Attwood TK, Bairoch A, Bateman A, Binns D, Bork P, Das U, Daugherty L, Duquenne L, et al (2009) InterPro: the integrative protein signature database. Nucleic Acids Res 37 D211–D215 [DOI] [PMC free article] [PubMed] [Google Scholar]
- Jiao Y, Ma L, Strickland E, Deng XW (2005) Conservation and divergence of light-regulated genome expression patterns during seedling development in rice and Arabidopsis. Plant Cell 17 3239–3256 [DOI] [PMC free article] [PubMed] [Google Scholar]
- Jin H, Cominelli E, Bailey P, Parr A, Mehrtens F, Jones J, Tonelli C, Weisshaar B, Martin C (2000) Transcriptional repression by AtMYB4 controls production of UV-protecting sunscreens in Arabidopsis. EMBO J 19 6150–6161 [DOI] [PMC free article] [PubMed] [Google Scholar]
- Jumtee K, Bamba T, Okazawa A, Fukusaki E, Kobayashi A (2008) Integrated metabolite and gene expression profiling revealing phytochrome A regulation of polyamine biosynthesis of Arabidopsis thaliana. J Exp Bot 59 1187–1200 [DOI] [PubMed] [Google Scholar]
- Kanehisa M, Araki M, Goto S, Hattori M, Hirakawa M, Itoh M, Katayama T, Kawashima S, Okuda S, Tokimatsu T, et al (2008) KEGG for linking genomes to life and the environment. Nucleic Acids Res 36 D480–D484 [DOI] [PMC free article] [PubMed] [Google Scholar]
- Klann EM, Chetelat RT, Bennett AB (1993) Expression of acid invertase gene controls sugar composition in tomato (Lycopersicon) fruit. Plant Physiol 103 863–870 [DOI] [PMC free article] [PubMed] [Google Scholar]
- Koes R, Verweij W, Quattrocchio F (2005) Flavonoids: a colorful model for the regulation and evolution of biochemical pathways. Trends Plant Sci 10 236–242 [DOI] [PubMed] [Google Scholar]
- Krieger CJ, Zhang P, Mueller LA, Wang A, Paley S, Arnaud M, Pick J, Rhee SY, Karp PD (2004) MetaCyc: a multiorganism database of metabolic pathways and enzymes. Nucleic Acids Res 32 D438–D444 [DOI] [PMC free article] [PubMed] [Google Scholar]
- León J, Sánchez-Serrano JJ (1999) Molecular biology of jasmonic acid biosynthesis in plants. Plant Physiol Biochem 37 373–380 [Google Scholar]
- Ma L, Li J, Qu L, Hager J, Chen Z, Zhao H, Deng XW (2001) Light control of Arabidopsis development entails coordinated regulation of genome expression and cellular pathways. Plant Cell 13 2589–2607 [DOI] [PMC free article] [PubMed] [Google Scholar]
- Martinez-Hernandez A, Lopez-Ochoa L, Arguello-Astorga G, Herrera-Estrella L (2002) Functional properties and regulatory complexity of a minimal RBCS light-responsive unit activated by phytochrome, cryptochrome, and plastid signals. Plant Physiol 128 1223–1233 [DOI] [PMC free article] [PubMed] [Google Scholar]
- Masoudi-Nejad A, Goto S, Jauregui R, Ito M, Kawashima S, Moriya Y, Endo TR, Kanehisa M (2007) EGENES: transcriptome-based plant database of genes with metabolic pathway information and expressed sequence tag indices in KEGG. Plant Physiol 144 857–866 [DOI] [PMC free article] [PubMed] [Google Scholar]
- Ogata H, Goto S, Sato K, Fujibuchi W, Bono H, Kanehisa M (1999) KEGG: Kyoto Encyclopedia of Genes and Genomes. Nucleic Acids Res 27 29–34 [DOI] [PMC free article] [PubMed] [Google Scholar]
- Oksman-Caldentey KM, Saito K (2005) Integrating genomics and metabolomics for engineering plant metabolic pathways. Curr Opin Biotechnol 16 174–179 [DOI] [PubMed] [Google Scholar]
- Paley SM, Karp PD (2006) The Pathway Tools cellular overview diagram and omics viewer. Nucleic Acids Res 34 3771–3778 [DOI] [PMC free article] [PubMed] [Google Scholar]
- Pandey R, Guru RK, Mount DW (2004) Pathway Miner: extracting gene association networks from molecular pathways for predicting the biological significance of gene expression microarray data. Bioinformatics 20 2156–2158 [DOI] [PubMed] [Google Scholar]
- Pratta G, Zorzoli R, Boggio SB, Picardi LA, Valle EM (2004) Glutamine and glutamate levels and related metabolizing enzymes in tomato fruits with different shelf-life. Sci Hortic (Amsterdam) 100 341–347 [Google Scholar]
- Rousseaux MC, Jones CM, Adams D, Chetelat R, Bennett A, Powell A (2005) QTL analysis of fruit antioxidants in tomato using Lycopersicon pennellii introgression lines. Theor Appl Genet 111 1396–1408 [DOI] [PubMed] [Google Scholar]
- Schauer N, Semel Y, Roessner U, Gur A, Balbo I, Carrari F, Pleban T, Perez-Melis A, Bruedigam C, Kopka J, et al (2006) Comprehensive metabolic profiling and phenotyping of interspecific introgression lines for tomato improvement. Nat Biotechnol 24 447–454 [DOI] [PubMed] [Google Scholar]
- Smyth GK (2004) Linear models and empirical Bayes methods for assessing differential expression in microarray experiments. Stat Appl Genet Mol Biol 3 Article 3 [DOI] [PubMed]
- Tandon KS, Baldwin EA, Scott JW, Shewfelt RL (2003) Linking sensory descriptors to volatile and nonvolatile components of fresh tomato flavor. J Food Sci 68 2366–2371 [Google Scholar]
- Terzaghi W, Cashmore A (1995) Light-regulated transcription. Annu Rev Plant Physiol Plant Mol Biol 46 445–474 [Google Scholar]
- Thijs G, Lescot M, Marchal K, Rombauts S, De Moor B, Rouze P, Moreau Y (2001) A higher-order background model improves the detection of promoter regulatory elements by Gibbs sampling. Bioinformatics 17 1113–1122 [DOI] [PubMed] [Google Scholar]
- Thimm O, Bläsing O, Gibon Y, Nagel A, Meyer S, Krüger P, Selbig J, Müller LA, Rhee SY, Stitt M (2004) MAPMAN: a user-driven tool to display genomics data sets onto diagrams of metabolic pathways and other biological processes. Plant J 37 914–939 [DOI] [PubMed] [Google Scholar]
- Tieman DM, Zeigler M, Schmelz EA, Taylor MG, Bliss P, Kirst M, Klee HJ (2006) Identification of loci affecting flavour volatile emissions in tomato fruits. J Exp Bot 57 887–896 [DOI] [PubMed] [Google Scholar]
- Tokimatsu T, Sakurai N, Suzuki H, Ohta H, Nishitani K, Koyama T, Umezawa T, Misawa N, Saito K, Shibata D (2005) KaPPA-view: a Web-based analysis tool for integration of transcript and metabolite data on plant metabolic pathway maps. Plant Physiol 138 1289–1300 [DOI] [PMC free article] [PubMed] [Google Scholar]
- Usadel B, Nagel A, Thimm O, Redestig H, Blaesing OE, Palacios-Rojas N, Selbig J, Hannemann J, Piques MC, Steinhauser D, et al (2005) Extension of the visualization tool MapMan to allow statistical analysis of arrays, display of corresponding genes, and comparison with known responses. Plant Physiol 138 1195–1204 [DOI] [PMC free article] [PubMed] [Google Scholar]
- van der Fits L, Memelink J (2000) ORCA3, a jasmonate-responsive transcriptional regulator of plant primary and secondary metabolism. Science 289 295–297 [DOI] [PubMed] [Google Scholar]
- Wang Z, Gerstein M, Snyder M (2009) RNA-Seq: a revolutionary tool for transcriptomics. Nat Rev Genet 10 57–63 [DOI] [PMC free article] [PubMed] [Google Scholar]
- Wei H, Persson S, Mehta T, Srinivasasainagendra V, Chen L, Page GP, Somerville C, Loraine A (2006) Transcriptional coordination of the metabolic network in Arabidopsis. Plant Physiol 142 762–774 [DOI] [PMC free article] [PubMed] [Google Scholar]
- Wu Z, Irizarry RA, Gentleman R, Martinez Murillo F, Spencer F (2004) A model based background adjustment for oligonucleotide expression arrays. J Am Stat Assoc 99 909–917 [Google Scholar]
- Yalpani N, Enyedi AJ, Leon J, Raskin I (1994) Ultraviolet light and ozone stimulate accumulation of salicylic acid and pathogenesis-related proteins and virus resistance in tobacco. Planta 193 373–376 [Google Scholar]
- Yan T, Yoo D, Berardini TZ, Mueller LA, Weems DC, Weng S, Cherry JM, Rhee SY (2005) PatMatch: a program for finding patterns in peptide and nucleotide sequences. Nucleic Acids Res 33 W262–W266 [DOI] [PMC free article] [PubMed] [Google Scholar]
- Yang YH, Dudoit S, Luu P, Lin DM, Peng V, Ngai J, Speed TP (2002) Normalization for cDNA microarray data: a robust composite method addressing single and multiple slide systematic variation. Nucleic Acids Res 30 e15. [DOI] [PMC free article] [PubMed] [Google Scholar]
- Yuan JS, Galbraith DW, Dai SY, Griffin P, Stewart CN Jr (2008) Plant systems biology comes of age. Trends Plant Sci 13 165–171 [DOI] [PubMed] [Google Scholar]
Associated Data
This section collects any data citations, data availability statements, or supplementary materials included in this article.