Abstract
With a view to future extension of the use of the agonist radioligand [11C]MNPA ([O-methyl-11C]2-methoxy-N-propylnorapomorphine) from animals to humans, we performed two positron emission tomography (PET) studies in monkeys. First, we assessed the ability to quantify the brain uptake of [11C]MNPA with compartmental modeling. Second, we estimated the radiation exposure of [11C]MNPA to human subjects based on whole-body imaging in monkeys. Brain PET scans were acquired for 90 min and included concurrent measurements of the plasma concentration of unchanged radioligand. Time-activity data from striatum and cerebellum were quantified with two methods, a reference tissue model and distribution volume. Whole-body PET scans were acquired for 120 min using four bed positions from head to mid thigh. Regions of interest were drawn on compressed planar whole-body images to identify organs with the highest radiation exposures. After injection of [11C]MNPA, the highest concentration of radioactivity in brain was in striatum, with lowest levels in cerebellum. Distribution volume was well identified with a two-tissue compartmental model and was quite stable from 60 to 90 min. Whole-body PET scans showed the organ with the highest radiation burden (μSv/MBq) was the urinary bladder wall (26.0), followed by lungs (22.5), gallbladder wall (21.9), and heart wall (16.1). With a 2.4-h voiding interval, the effective dose was 6.4 μSv/MBq (23.5 mrem/mCi). In conclusion, brain uptake of [11C]MNPA reflected the density of D2/3 receptors, quantified relative to serial arterial measurements, and caused moderate to low radiation exposure.
Keywords: PET, [11C]MNPA, dosimetry, DA D2/3 receptor agonist radioligand, whole-body biodistribution, kinetic analysis
INTRODUCTION
Agonist radioligands for dopamine (DA) D2-like receptors bind preferentially to the high affinity and functional state of the receptor, whereas antagonist radioligands bind equally well to receptors in the high and low affinity states (Creese et al., 1984; George et al., 1985; Sibley et al., 1983). Since high and low affinity states are defined relative to the endogenous transmitter DA, agonist radioligands for the D2-like receptor should be more useful than antagonist radioligands to measure in vivo competition from DA. In fact, endogenous DA more effectively competes in vivo with agonist radioligands and causes a greater percentage displacement than with antagonist radioligands (Ginovart et al., 2006; Narendran et al., 2004; Seneca et al., 2006; Willeit et al., 2008). Furthermore, disorders with alterations in DA turnover (e.g., schizophrenia and Parkinson disease) may be associated with compensatory changes in the percentage of receptors in high vs. low affinity states. For such conditions, an agonist radioligand may detect alterations in the number of receptors in the high affinity state, whereas an antagonist radioligand cannot distinguish receptors in the two states.
Three radiolabeled DA agonists have been studied in monkeys or humans: [11C]NPA ((R)-N-11C-propylnorapomorphine); [11C]MNPA ([O-methyl-11C]2-methoxy-N-propylnorapomorphine); and [11C]-(1)-PHNO ([11C]-(+)-4-Propyl-3,4,4a,5,6,10b-hexahydro-2H-naphtho-[1,2-b] [1,4]oxazin-9-ol). All three radiolabeled agonists have high brain uptake and selectivity for D2 and D3 receptors (i.e., D2/3 receptors) relative to D1, D4, and D5 receptors. Compared with the antagonist radioligands, these three agonist radioligands show greater sensitivity to changes in endogenous DA and bind preferentially to D2/3 receptors in the high affinity state (Ginovart et al., 2006; Narendran et al., 2004; Seneca et al., 2006; Willeit et al., 2008). Of the three radioligands, only [11C]-(+)-PHNO has been studied in human subjects (Ginovart et al., 2007; Graff-Guerrero et al., 2007; Willeit et al., 2008). As expected from the distribution of D2 and D3 receptors in humans, striatum has the highest brain uptake (Ginovart et al., 2007; Willeit et al., 2006). However, the uptake of [11C]-(+)-PHNO is higher in ventral than in dorsal striatum. This differential distribution suggests that [11C]-(+)-PHNO has an unexpected in vivo preference for D3 compared with D2 receptors, since D3 receptors are concentrated in the ventral striatum (Graff-Guerrero et al., 2007; Sokoloff et al., 1990).
To gather information useful to extend [11C]MNPA to humans, we performed two studies in monkeys. First, we assessed the ability of [11C]MNPA to quantify brain uptake using compartmental modeling. These modeling studies required serial brain imaging and concurrent measurements of the plasma concentration of unchanged radioligand. Second, we estimated the radiation exposure of [11C]MNPA to human subjects based on whole-body imaging in monkeys.
MATERIALS AND METHODS
Radioligand preparation
[11C]MNPA was prepared by a two step (Gao et al., 1990) labeling method (Finnema et al., 2007), which entails 11C-methylation of the precursor (R)-2-hydroxy-10,11-acetonide-NPA followed by deprotection. The specific activity of [11C]MNPA at the time of injection was 114 ± 43 GBq/lmol (n = 9 syntheses). The radiochemical purity was 98%.
Summary of PET studies
A total of nine PET experiments were performed in five male rhesus monkeys (Macaca mulatta) weighing 9.2 ± 1.4 kg. Anesthesia was induced with injection of ketamine (10 mg/kg i.m.) and then maintained with 1–2% isoflurane and 98% O2. Body temperature was kept at a constant, 37.0–37.5°C, using a heated air blanket. Vital signs including heart and respiration rates, and body temperature were monitored throughout the study.
The injected dose of MNPA was 1.2 ± 0.63 μg (n = 9). Since the monkeys had an average body weight of 9 kg, this dose corresponded to about 0.13 μg/kg. Injection of [11C]MNPA had no noticeable effects. The differences between the mean baseline vital sign values and any measurement after injection of radioligand was: <16 mm Hg for systemic blood pressure, <27 min-1 for pulse, <1 min-1 for respiratory rate, and <2.3°C for temperature.
PET brain imaging
After injection of [11C]MNPA (352 ± 42 MBq; n = 7) in three rhesus monkeys, PET scans were acquired for 90 min in 27 frames, with frames of 6 × 30 s, followed by 3 × 1 min, 2 × 2 min, and 16 × 5 min. Monkeys were imaged with the High Resolution Research Tomograph (Siemens/CPS, Knoxville, TN). Before radioligand injection, a 6-min transmission scan for attenuation correction was collected using 137Cs rod source.
PET whole-body imaging
After injection of [11C]MNPA (396 and 358 MBq) in two male rhesus monkeys (11.8 and 11.5 kg), whole-body PET scans were acquired on four segments of 15 cm each, from the head to upper thigh. The total scanning time was ~120 min, with frames of 4 × 15 s, 4 × 30 s, 8 × 1 min, 4 × 2 min, and 2 × 4 min. Whole-body transmission and emission scans were acquired on a GE Advance tomograph (GE Healthcare, Waukesha, WI). Before radioligand injection, an 8-min transmission scan for attenuation correction was collected using a 68Ge rod source for each of the four segments of the body.
Magnetic resonance imaging
To identify brain regions, T1-weighted magnetic resonance imaging (MRI) scans were obtained with a 1.5 T GE Signa device. Coronal images were acquired with a spoiled GRASS (gradient recall acquisition in the steady state) sequence with TR = 13.1 ms, TE = 5.8 ms, flip angle 45°, and matrix = 256 × 256.
Measurement of [11C]MNPA in plasma
Arterial blood was collected in heparin-treated syringes from two monkeys during three PET scans at 15, 30, 45, 60, 75, 90, and 105 s and at 2, 3, 5, 10, 15, 30, 45, 60, and 90 min. The plasma parent radioligand was separated from radiometabolites and quantified as previously described (Zoghbi et al., 2006) except that reversed phase radio-chromatography was done on a Luna C18 column (250 × 10 mm2,10 μm; Phenomenex, Torrance, CA) with a 45% MeOH: 55% ammonium formate (pH 4.5) as a mobile phase was used to resolve [11C]MNPA from the radiometabolites. The plasma free fraction (fP) of [11C]MNPA was determined by ultrafiltration with Amicon Centrifree® units as previously described (Gandelman et al., 1994).
Brain: image analysis and calculation of outcome measures
Regions of interest were manually defined on coronal PET images, with reference to the monkey’s core-gistered MRI and a brain MRI atlas (Paxinos et al., 2000). Regions of interest were placed on right and left striatum (total striatum 0.4 cm3) and on cerebellum (1.7 cm3). Brain uptake was expressed as a standardized uptake value (%SUV), which normalizes for injected activity and body weight: (% injected activity/cm3 tissue) × (g body weight). Image and kinetic analysis were performed using PMOD 2.85 (pixel-wise modeling software; PMOD Technologies, Adliswil, Switzerland).
The outcome measure was quantified with two methods, a reference tissue model and distribution volume. The first outcome measure was binding potential expressed relative to nondisplaceable uptake, BPND, which is the ratio at equilibrium of specific to nondisplaceable uptake (Innis et al., 2007). For [11C]MNPA, BPND was operationally defined as the ratio at equilibrium of (striatum - cerebellum)/cerebellum. The reference tissue model we used is the two-parameter multilinear reference tissue model (Ichise et al., 2003), which fits the time-activity curves of striatum and cerebellum from time 1 min to the end of scan (90 min).
The second outcome measure, distribution volume, is proportional to receptor density and is equal to the ratio at equilibrium of the concentration of radioligand in tissue to that in plasma. Distribution volume was calculated from measurements over time of the dynamic radioactivity in brain and of the concentrations of radioligand in arterial plasma. The serial concentrations of radioligand in plasma are referred to as the “input function.” The input function was analyzed as linear interpolation of the concentrations of [11C]MNPA before the peak, and a bi-exponential fit of concentrations after the peak. Rate constants (K1, k2, k3, and k4) in standard one- and two-tissue compartment models were calculated with the Marquardt optimizer. To correct the brain data for its vascular component, radioactivity in serial whole blood was measured and then subtracted from the PET measurements assuming that cerebral blood volume is 5% of total brain volume.
To determine the minimum scanning time necessary to obtain stable values of distribution volume, we analyzed the PET data from each monkey after removing variable durations of the terminal portion of the scan. We analyzed brain data from 0–30 min to 0–90 min, with 10-min increments.
Whole-Body: image analysis and dosimetry estimation
Tomographic PET images were compressed into a single planar image and analyzed with PMOD software. Regions of interest were drawn on source organs that could be identified: brain, heart, liver, gallbladder, lungs, kidneys, and urinary bladder.
At each time point, decayed activities of identifiable source organs were converted into the fraction of the total injected activity. The area under the curve of each organ was calculated by the trapezoidal method up to the termination of acquisition (120 min). The area after the last image to infinity was calculated by assuming that further decline in radioactivity occurred by physical decay only, without any biological clearance. The area under the curve of % injected activity from time zero to infinity is equivalent to residence time of the organ. Corresponding residence times for a 70-kg man were calculated with a multiplication factor to correct for organ and body weights: (bm/om) × (oh/bh), where bm and bh are the body weights of monkey and human, respectively; and om and oh are the organ weights of monkey and human, respectively.
The mean total radioactivity in urinary bladder of two monkeys were fitted with an exponential curve fit to estimate the percentage of injected activity excreted via this route. The dynamic bladder model with 2.4-h voiding interval was implemented in OLINDA/EXM version 1.0 to calculate organ absorbed doses (Stabin et al., 2005).
The organ values of injected activity were corrected for recovery of measured activity. To accomplish this, a large region of interest (ROI) was placed over the entire body for each of the 22 frames. The injected activity of each source organ at every time point was corrected for recovery by multiplying by 100/X, where X is the measured recovery for the individual frame. The average recovery of all frames in both monkeys was ~85%. If no radioactivity is lost to excretion, the total of all residence times equals T1/2/ln 2, where T1/2 = 20.4 min = 0.34 h, and T1/2/ln 2 = 0.49 h. The residence time of “remainder of body” for each monkey was calculated as 0.49 h minus the sum of the residence times of the source organs.
Please note that residence time is calculated from the area under the curve of decayed activity vs. time. In contrast, all graphs in this paper show decay-corrected activity vs. time, which is the more common format to display time-activity curves.
Statistical analysis
Goodness-of-fit by nonlinear least squares analysis was evaluated with the Akaike Information Criterion (AIC) (Akaike, 1974). The most appropriate model has the smallest AIC. Goodness-of-fit by the compartmental modes was compared with F statistics. This analysis was performed for all regions of interest and a value of P<0.05 was considered significant for F statistics.
The identifiability of the kinetic variables was calculated by the compartmental fitting as the standard error, which itself reflects the diagonal of the covariance matrix (Carson, 1986). Identifiability is expressed as a percentage and equals the ratio of the standard error of the rate constant divided by the value of the rate constant itself. Identifiability of VT was calculated from the covariance matrix using the generalized form of error propagation equation (Bevington and Robinson, 2003), where correlations among the rate constants were taken into account.
Data are Expressed as Mean ± SD.
RESULTS
PET brain imaging
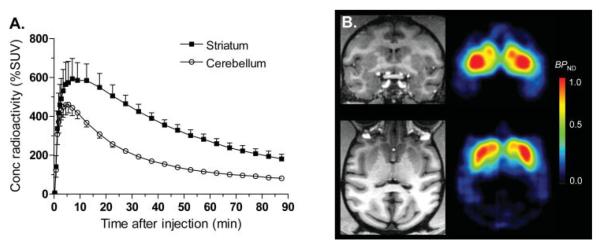
After injection of [11C]MNPA, the distribution of radioactivity in brain reflected the regional densities of DA D2/3 receptors (Fig. 1). That is, the peak uptake in striatum was ~600% SUV at 7 min. In comparison, the peak uptake in cerebellum was lower (~450% SUV) and occurred at an earlier time (5 min).
Fig. 1.
Time course of radioactivity and images of monkey brain after injection of [11C]MNPA. (A) Concentrations of radioactivity in striatum and cerebellum of monkey brain after injection of [11C]MNPA (n = 7). (B) PET images of [11C]MNPA estimated by a reference tissue model in monkey brain. Parametric images of BPND are presented on the right. A monkey 4.7-T MRI (on the left) was used for clearer representation of anatomic areas.
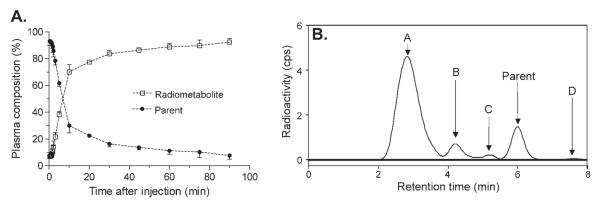
The peak plasma concentration of [11C]MNPA rapidly declined and was concurrent with accumulation of at least three radiometabolites. The peak plasma concentration was ~600% SUV decreased at ~60 s, and decreased rapidly to 50 and 10% of the peak value by 2 and 5 min, respectively (Fig. 2). The fraction of [11C]MNPA, expressed as a percentage of total plasma activity, declined relatively quickly and reached 50% at ~10 min (Fig. 3A). Four radiometabolites peaks were detected in arterial plasma samples with high-performance liquid chromatography (HPLC) analysis. Peaks A–C eluted earlier than MNPA, indicating that they are less lipophilic (Fig. 3B). Peak D eluted later than MNPA, but represented <1% of the total radioactivity in plasma. Finally, the plasma free fraction of [11C]MNPA was (7.51% ± 1.15; n = 3).
Fig. 2.
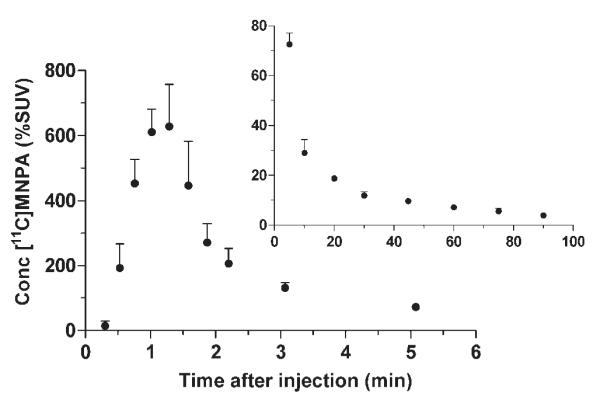
Concentration of [11C]MNPA in plasma after radioligand injection. The curve is shown with two time intervals (0–6 and 6–90 min) because of high concentrations at early time points. Concentrations are plotted for unchanged parent radioligand [11C]MNPA.
Fig. 3.
(A) The percentage composition of plasma radioactivity over time is shown for [11C]MNPA (•) and total radiometabolites (□) (n = 3). (B) Chromatogram of radioactivity (counts per second (CPS)) extracted from plasma at 60 min after injection of [11C]MNPA. Parent in plasma constituted 14% of total radioactivity. Radiometabolites (A–C) have lower lipophilicity than that of [11C]MNPA.
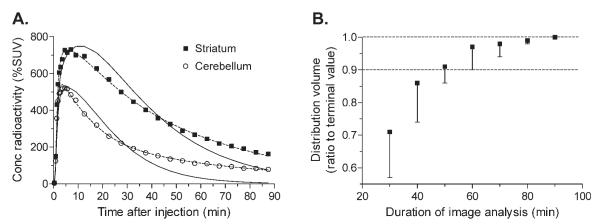
The density of D2/3 receptors in striatum could be quantified relative to the concentration of [11C]MNPA in plasma (n = 3 PET scans) and to the concentration of radioactivity in a reference region of brain (n = 7 PET scans). Distribution volume was calculated using compartmental modeling of time-activity brain data and the serial concentrations of [11C]MNPA in arterial plasma. The two-tissue compartmental model gave better statistical fit of brain data than the one-tissue compartment model in both striatum and cerebellum in three scans of two monkeys (F-test, P<0.001; Fig. 4A). Thus, we used results from the two-tissue compartment model. Although some of the individual rate constants (K1, k2, k3, k4) were not well identified, total distribution volume VT had good identifiability (<10%) in both striatum and cerebellum (Table I). VT was 25 ml cm-3 in striatum and 14 ml cm-3 in cerebellum. The value of BPND calculated from these distribution volumes was 0.8 (= (25 - 14)/14). The time stability of VT was analyzed for striatum using the two-tissue compartmental model. VT reached 90% of the terminal value within ~50 min, but was relatively stable from 60 to 90 min (Fig. 4B).
Fig. 4.
Compartmental modeling of dynamic PET images. (A) The two-tissue compartmental model (dashed lines) more closely followed the measured values than did the one-tissue compartmental model (solid lines). (B) Time stability of VT determined from the two-tissue compartmental model was assessed by analyzing increasingly truncated data, with a range of 0–30 min to 0–90 min. Each point represents the striatal VT analyzed with data from time 0 to the specified time and expressed as the percentage of the 90-min value.
TABLE I.
Kinetic rate constants calculated with a two-compartmental model
| Region |
K1 (mL·cm-3·min-1) Ident (%) |
k2 (min-1) Ident (%) |
k3 (min-1) Ident (%) |
k4 (min-1) Ident (%) |
VT (mL·cm-3) Ident (%) |
BPNDa | AICb |
|---|---|---|---|---|---|---|---|
| Striatum | 0.86 ± 0.13 | 0.15 ± 0.12 | 0.15 ± 0.19 | 0.03 ± 0.01 | 25.15 ± 1.19 | 0.80 ± 0.09 | 95 ± 9 |
| 3.2 ± 1.1 | 14.2 ± 5.1 | 23.3 ± 6.2 | 16.2 ± 7.3 | 4.0 ± 1.8 | |||
| Cerebellum | 0.74 ± 0.09 | 0.14 ± 0.02 | 0.03 ± 0.01 | 0.02 ± 0.01 | 13.97 ± 0.60 | – | 110 ± 14 |
| 2.6 ± 0.5 | 7.7 ± 0.3 | 20.7 ± 3.9 | 27.7 ± 13.7 | 9.8 ± 6.2 |
The rate constants and distribution volume (VT) for the striatum and cerebellum are shown as mean ± SD (n=3). The first line gives the value of the rate constant and the second line provides the identifiability, which is expressed as a % of the variable.
BPND =(VT striatum / VT cerebellum)-1.
AIC, Akaike information criterion.
Although distribution volume was calculated in three scans that had arterial blood data, BPND was calculated with a reference tissue model in all seven brain scans. The value of BPND was similar with both arterial and reference tissue methods. Striatal [11C]MNPA BPND calculated by a reference tissue model was 1.03 ± 0.13 (n = 7) and 0.95 ± 0.08 (n = 3) in the three animals that also had arterial blood data.
PET whole-body imaging
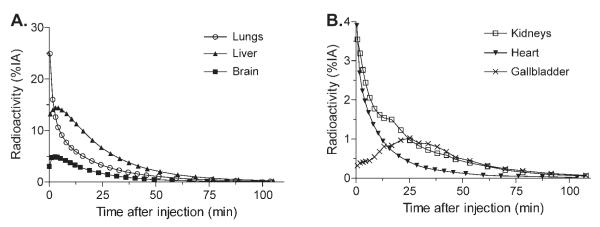
Brain, heart, liver, gallbladder, lungs, kidneys, and urinary bladder were visually identified as organs with moderate to high activity (Fig. 5). Uptake of radioactivity was highest in the lungs, with a peak of 25% injected activity at the first frame acquisition. Peak values of activity to brain, heart, liver, and kidneys were 5, 4, 14, and 4% of injected activity, respectively, and all occurred within 4 min (Figs. 6A and 6B).
Fig. 5.
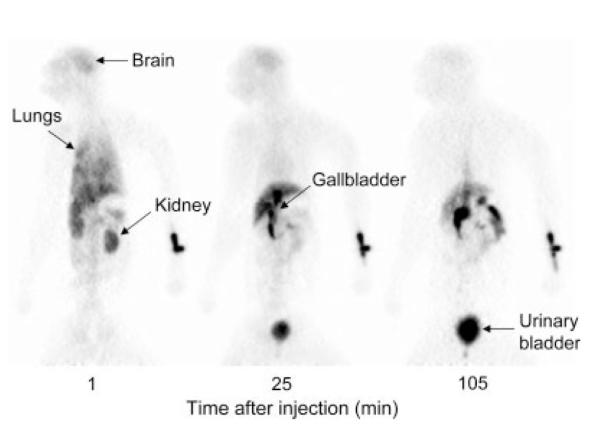
Whole-body images at 1, 25, and 105 min after injection of [11C]MNPA. Injection site seen on right side of image (i.e., catheter placed in left wrist).
Fig. 6.
Mean organ uptake in (A) lungs, liver, and brain, (B) kidneys, heart and gallbladder. The organ’s decay-corrected activity is expressed as a percentage of the injected activity (%IA).
The average cumulative urine activity was well fitted (r2 = 0.995) with an exponential curve (Fig. 7). The exponential fitting implied that an asymptote of ~20% of injected activity was excreted via the urine by time infinity.
Fig. 7.
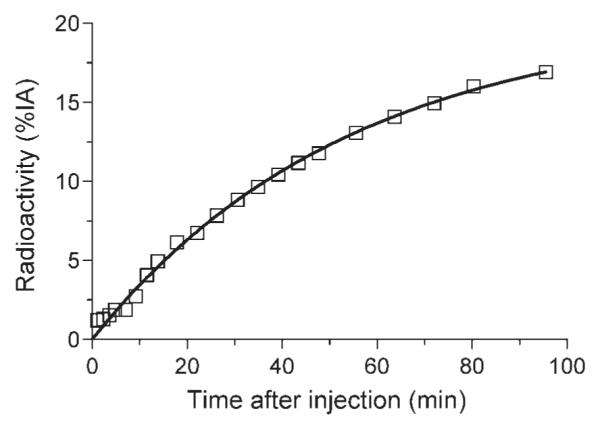
Decay-corrected activity from the total radioactivity in urinary bladder after injection of [11C]MNPA. Data are the average of two monkeys and are expressed as percentages of the injected activity (%IA). The solid line is an exponential fit of the data points. The asymptote of this equation implies that 20% of injected activity will be excreted via the urine by infinite time.
Human residence times were extrapolated from planar images using the average values of the two monkeys (Table II). Radiation absorbed dose estimates were calculated with OLINDA/EXM 1.0 computer program, with a urine voiding interval of 2.4 h (Table III). The organs with the highest radiation burden (μSv/MBq) were the urinary bladder wall (26.0), followed by the lungs (22.5), gallbladder wall (21.9), and heart wall (16.1). The effective dose was estimated to be 6.4 μSv/MBq, with 2.4-h voiding interval (Table III). A 4.8-h voiding interval had minimal effects on estimated radiation doses, as expected for the short half-life of 11C (20 min).
TABLE II.
Human residence time for [11C]MNPA extrapolated from the average of two rhesus monkeys
| Residence time (h) |
|||
|---|---|---|---|
| Source organ | Monkey no 1 | Monkey no 2 | Average |
| Brain | 0.029 | 0.025 | 0.027 |
| Heart | 0.018 | 0.016 | 0.017 |
| Liver | 0.069 | 0.080 | 0.075 |
| Gallbladder | 0.011 | 0.005 | 0.008 |
| Lungs | 0.081 | 0.088 | 0.085 |
| Kidneys | 0.019 | 0.007 | 0.013 |
| Bladder | 0.040 | 0.033 | 0.037 |
| Remainder of body | 0.223 | 0.236 | 0.230 |
The “remainder of body” for each animal was calculated by subtracting the residence times of the source organs from theoretical limit of 0.49h.
TABLE III.
Radiation dosimetry of [11C]MNPA extrapolated from the mean of the two monkeys
| Target organ | μSv/MBq | mrem/mCi |
|---|---|---|
| Adrenals | 3.3 | 12.2 |
| Brain | 6.4 | 23.8 |
| Breasts | 2.0 | 7.5 |
| Gallbladder wall | 21.9 | 80.9 |
| LLI wall | 2.2 | 8.2 |
| Small intestine | 2.3 | 8.4 |
| Stomach | 2.4 | 8.7 |
| ULI wall | 2.4 | 8.8 |
| Heart wall | 16.1 | 59.3 |
| Kidneys | 13.0 | 48.1 |
| Liver | 13.8 | 50.8 |
| Lungs | 22.5 | 83.3 |
| Muscle | 2.0 | 7.3 |
| Ovaries | 2.3 | 8.4 |
| Pancreas | 3.1 | 11.6 |
| Red marrow | 2.0 | 7.4 |
| Osteogenic cells | 2.6 | 9.6 |
| Skin | 1.5 | 5.4 |
| Spleen | 2.3 | 8.6 |
| Tests | 1.7 | 6.4 |
| Thymus | 2.5 | 9.2 |
| Thyroid | 1.8 | 6.6 |
| Urinary bladder wall | 26.0 | 96.0 |
| Uterus body | 2.9 | 10.8 |
| Total body | 2.8 | 10.4 |
| Effective Dose Equivalent | 9.4 | 34.7 |
| Effective Dose | 6.4 | 23.5 |
Dosimetry estimates are based on a 70-kg human male. Dynamic urinary bladder model was used with a 2.4 h voiding interval.
DISCUSSION
We found that [11C]MNPA binding to D2/3 receptors in monkey brain can be reliably quantified relative to concentrations of either the radioligand and total radioactivity in a receptor-free region of brain; that nonspecific binding is relatively high; and that radiation exposure is relatively low and similar to that of other 11C-labeled radioligands.
Quantification of BP
Binding potential is the ratio at equilibrium of specific binding to nondisplaceable uptake and can be quantified from the rate constants (k3/k4) or from the ratio of distribution volumes in target and background regions. For [11C]MNPA, the latter method is more precise and accurate.
In a two-tissue compartment model, the ratio k3/k4 theoretically equals BPND. However, the accuracy depends on the ability of the data to identify four rate constants (k1–k4), which thereby separates total brain activity into the two components of specific binding and nondisplaceable uptake. In our data, k3 and k4 were poorly identified (~20% in striatum), presumably because of noise in the brain and plasma data. That is, k3 and k4 had low precision. In addition, the nondisplaceable uptake in striatum was quantified inaccurately in comparison with that in cerebellum. The nondisplaceable uptake in striatum (K1/k2 = ~6 ml cm-3) was less than half of total uptake in cerebellum (VT = ~14 cm-3). In contrast, most prior studies using D2 radioligands, including [11C]MNPA (Finnema et al., 2005), have found that uptake in cerebellum at baseline conditions closely approximates the nondisplaceable uptake in striatum after receptor blockade. That is, the two-tissue compartment model identified only total distribution volume with precision (identifiability of 4%) and accuracy. Thus, the most reliable and accurate measure of BPND was determined from total distribution volumes in striatum and cerebellum—i.e., essentially (striatum – cerebellum)/cerebellum.
[11C]MNPA has relatively low BP
The BPND of [11C]MNPA is relatively low compared to several other radioligands for D2/3 receptors. This low value of BPND can be explained by the factors that determine both specific binding (i.e., receptor density and radioligand affinity) as well as nonspecific binding. Which of these factors (receptor density, radioligand affinity, and nonspecific binding) have the greatest impact on the relatively low BPND of [11C]MNPA? We will address this question by comparing [11C]MNPA with two other agonist radioligands and two antagonist radioligands (Table IV). With regard to the first factor of receptor density, the three agonist radioligands have fewer available receptors (Bavail) than the antagonist radioligands, since only a subset of receptors are in the high affinity, agonist-preferring state. The percentage of D2/3 receptors in the high affinity state is unknown but has been estimated with a broad range of 10–50% (Ginovart et al., 1997; Laruelle et al., 1997; Ross and Jackson, 1989; Seneca et al., in submission). If 50% is correct, then the specific binding (and thus BPND) of an agonist radioligand would be half that of a comparable antagonist radioligand.
TABLE IV.
Relationship of binding potential to receptor affinity and nondisplaceable uptake PET radioligands for the D2/3 receptors
| Radioligand (reference) |
Agonist or antagonist |
Ki (nM)a |
Ki: Ratio to MNPA |
VT cerebellum (mL cm-3) |
VT cerebellum Ratio to MNPA |
VS (mL cm-3) |
VS: Ratio to MNPA |
BPND (mL cm-3) |
BPND: ratio to MNPA |
|---|---|---|---|---|---|---|---|---|---|
| [11C]MPNA | Agonist | 0.17 (a) | 1.0 | 13.97 (b) | 1.0 | 11.18 (b) | 1.0 | 1.03 (b) | 1.0 |
| [11C]NPA | Agonist | 0.80 (a) | 4.7 | 3.44 (d) | 0.2 | 4.04 (d) | 0.4 | 1.22 (c) | 1.2 |
| [11C]PHNO | Agonist | 0.14 (e) | 0.8 | 5.81 (f) | 0.4 | 14.63 (f) | 1.3 | 2.7b(f) | 2.6 |
| [11C]raclopride | Antagonist | 1.70 (g) | 10.0 | 0.42 (i) | 0.03 | 0.70 (i) | 0.1 | 3.20 (h) | 3.1 |
| [18F]fallypride | Antagonist | 0.03 (j) | 0.2 | 0.95 (k) | 0.1 | 29.29 (k) | 2.6 | 23.30 (k) | 22.6 |
Ki values are from rat and mouse. Affinity is the inverse of Ki.
Avg BPND value for caudate, putamen, and ventral striatum.
Note: The in vivo values of BPND, VT and VS come from the following species: [11C]MNPA and [11C]NPA from monkey; [11C]PHNO, [11C]raclopride, and [18F]fallypride are from human. a) Gao et al., 1990; b) current paper; c) Narendran et al., 2004; d) Hwang et al., 2004; e) Wilson et al.,2005; f) Ginovart et al., 2007; g) Hall et al., 1990; h) Ito et al., 1998; i) Lammertsma et al., 1996; j) Mukherjee et al., 1995; k) Siessmeier et al. 2005.
With regard to the second factor, the in vivo affinities for most radioligands are unknown but can be estimated from in vitro binding to tissue homogenates. In vitro binding of all five radioligands has not been reported for monkey brain but is available for rodent brain. Values of binding experiments vary between labs and with different tissue and radioligand preparations. Nevertheless, among the five radioligands, [18F]fallypride has much greater affinity than the other four, and the highest BPND. The remaining four radioligands have Ki values over about a ten-fold range, from 0.14 to 1.70 nM. Compared to [11C]MNPA, the specific distribution volumes of [11C]NPA, [11C]PHNO and [11C]raclopride roughly correlate with their relative affinities (Table IV). For example, [11C]MNPA has about 4-fold higher affinity and a three-fold higher value of VS compared with [11C]NPA (Table IV).
With regard to the third factor, nonspecific binding is proportional to uptake in a reference region that lacks or has few receptors. The cerebellar VT of [11C]MNPA is much higher than that of the other four radioligands and contributes to its relatively low value of BPND. We provided values of total distribution volume (VT) in cerebellum that includes nonspecific binding, free radioligand in tissue, and perhaps a small amount of binding to D2/3 receptors (Asselin et al., 2007; Pinborg et al., 2007).
Since BPND is the ratio of specific to nondisplaceable uptake, the combined effect of affinity and nondisplaceable binding can be assessed as the ratio of the two values. For example, the affinity of [11C]MNPA is approximately four-fold higher than that of [11C]NPA, but the nondisplaceable uptake of [11C]MNPA is approximately four times higher than that of [11C]NPA. The net effect estimated by the ratio of these two ratios is ~1, and, thus, the BPND values of these two radioligands are fairly similar.
This analysis helps identify which characteristics of a radioligand should be improved to increase BPND. In the case of [11C]MNPA, its nonspecific binding in brain is high relative to the other four radioligands. Thus, an improved analog of [11C]MNPA would have much lower nonspecific binding, which would thereby increase BPND.
Estimation of radiation dosimetry in man
We used whole-body PET imaging in monkeys to estimate the radiation exposure of [11C]MNPA in man. Effective dose is an organ-weighted average of radiation exposure and was designed to be the best single value to estimate overall radiation exposure and risk of subsequently developing cancer. The effective dose of [11C]MNPA is estimated to be 6.4 μSv/MBq (23.5 mrem/mCi). For example, the effective doses of three commonly used radioligands are: [11C]NNC 112 (5.7 μSv/MBq); [11C]raclopride (6.5 μSv/MBq); and [18F]fallypride (21.1 μSv/MBq) (Cropley et al., 2006; Kessler et al., 2000; Slifstein et al., 2006).
Finally, our use of planar rather than tomographic images provided conservative (i.e., higher) estimates of radiation exposure, since the region included tissue above and below the source organs. We previously compared radiation exposure estimated with planar, bisected, and thin-slice tomographic images using [18F]SPA-RQ, a radioligand for the neurokinin-1 receptor (Sprague et al., 2007a) and using [11C]rolipram, a radioligand for cAMP phosphodiesterase 4 (Sprague et al., in submission). In both cases, the effective dose was 5–10% higher for planar than for the bisected and thin-slice tomographic images.
In conclusion, two types of PET scans were performed in monkeys so as to enable the use of [11C]MNPA to be extended from animals to humans. First, serial brain imaging was used to quantify D2/3 receptor binding relative to serial concentrations of [11C]MNPA in plasma. Distribution volume was well identified by two-tissue compartment model and was relatively stable from 60 to 90 min. However, the nondisplaceable uptake of [11C]MNPA was relatively high and caused low values of BP. Second, whole-body imaging showed that [11C]MNPA caused radiation exposure similar to that of many other 11C-labeled ligands.
ACKNOWLEDGMENTS
This research was supported by the Intramural Program (project #Z01-MH-002795-06) of the National Institute of Mental Health. We thank John Bacher, DVM for veterinary care; the staff of the NIH PET Department for successful completion of the scanning studies; PMOD Technologies, Ltd. (Adliswil, Switzerland) for providing its image analysis and modeling software; and John Neumeyer (Mclean Hospital/Harvard Medical School) for providing an authentic sample of MNPA.
Contract grant sponsor: Intramural Program (National Institute of Mental Health); Contract grant number: Z01-MH-002795-06.
REFERENCES
- Akaike H. A new look at the statistical model identification. IEEE Trans Automat Control AC. 1974;19:716–723. [Google Scholar]
- Asselin MC, Montgomery AJ, Grasby PM, Hume SP. Quantification of PET studies with the very high-affinity dopamine D2/D3 receptor ligand [11C]FLB 457: Re-evaluation of the validity of using a cerebellar reference region. J Cereb Blood Flow Metab. 2007;27:378–392. doi: 10.1038/sj.jcbfm.9600340. [DOI] [PubMed] [Google Scholar]
- Bevington PR, Robinson DK. Data reduction and error analysis for the physical sciences. McGraw-Hill; New York: 2003. [Google Scholar]
- Carson RE. Parameter estimation in positron emission tomography. In: Phelps ME, Mazziotta JC, Schelbert HR, editors. Positron emission tomography and autoradiography: Principles and applications for the brain and heart. Raven Press; New York: 1986. pp. 347–390. [Google Scholar]
- Creese I, Sibley DR, Leff SE. Agonist interactions with dopamine receptors: Focus on radioligand-binding studies. Fed Proc. 1984;43:2779–2784. [PubMed] [Google Scholar]
- Cropley VL, Fujita M, Musachio JL, Hong J, Ghose S, Sangare J, Nathan PJ, Pike VW, Innis RB. Whole-body biodistribution and estimation of radiation-absorbed doses of the dopamine D1 receptor radioligand 11C-NNC 112 in humans. J Nucl Med. 2006;47:100–104. [PubMed] [Google Scholar]
- Finnema SJ, Seneca N, Farde L, Shchukin E, Sovago J, Gulyas B, Wikstrom HV, Innis RB, Neumeyer JL, Halldin C. A preliminary PET evaluation of the new dopamine D2 receptor agonist [11C]MNPA in cynomolgus monkey. Nucl Med Biol. 2005;32:353–360. doi: 10.1016/j.nucmedbio.2005.01.007. [DOI] [PubMed] [Google Scholar]
- Finnema SJ, Jia ZS, Steiger C, Brinkman IH, Bang-Andersen BB, Wikström HV, Halldin C. Radiosynthesis of [11C]MNPA and [3H]MNPA from the precursor (R)-2-hydroxy-10,11-acetonide-NPA. J Label Compd Radiopharm V. 2007;50:S201. [Google Scholar]
- Gandelman MS, Baldwin RM, Zoghbi SS, Zea-Ponce Y, Innis RB. Evaluation of ultrafiltration for the free-fraction determination of single photon emission computed tomography (SPECT) radiotracers: Beta-CIT. IBF, and iomazenil. J Pharm Sci. 1994;83:1014–1019. doi: 10.1002/jps.2600830718. [DOI] [PubMed] [Google Scholar]
- Gao YG, Baldessarini RJ, Kula NS, Neumeyer JL. Synthesis and dopamine receptor affinities of enantiomers of 2-substituted apomorphines and their N-n-propyl analogues. J Medi Chem. 1990;33:1800–1805. doi: 10.1021/jm00168a040. [DOI] [PubMed] [Google Scholar]
- George SR, Watanabe M, Di Paolo T, Falardeau P, Labrie F, Seeman P. The functional state of the dopamine receptor in the anterior pituitary is in the high affinity form. Endocrinology. 1985;117:690–697. doi: 10.1210/endo-117-2-690. [DOI] [PubMed] [Google Scholar]
- Ginovart N, Farde L, Halldin C, Swahn CG. Effect of reserpine-induced depletion of synaptic dopamine on [11C]raclopride binding to D2-dopamine receptors in the monkey brain. Synapse (New York) 1997;25:321–325. doi: 10.1002/(SICI)1098-2396(199704)25:4<321::AID-SYN2>3.0.CO;2-C. [DOI] [PubMed] [Google Scholar]
- Ginovart N, Galineau L, Willeit M, Mizrahi R, Bloomfield PM, Seeman P, Houle S, Kapur S, Wilson AA. Binding characteristics and sensitivity to endogenous dopamine of [11C]-(+)-PHNO, a new agonist radiotracer for imaging the high-affinity state of D2 receptors in vivo using positron emission tomography. J Neurochem. 2006;97:1089–1103. doi: 10.1111/j.1471-4159.2006.03840.x. [DOI] [PubMed] [Google Scholar]
- Ginovart N, Willeit M, Rusjan P, Graff A, Bloomfield PM, Houle S, Kapur S, Wilson AA. Positron emission tomography quantification of [11C]-(+)-PHNO binding in the human brain. J Cereb Blood Flow Metab. 2007;27:857–871. doi: 10.1038/sj.jcbfm.9600411. [DOI] [PubMed] [Google Scholar]
- Graff-Guerrero A, Willeit M, Ginovart N, Mamo D, Mizrahi R, Rusjan P, Vitcu I, Seeman P, Wilson AA, Kapur S. Brain region binding of the D2/3 agonist [11C]-(+)-PHNO and the D2/3 antagonist [11C]raclopride in healthy humans. Hum Brain Mapp. 2008;29:400–410. doi: 10.1002/hbm.20392. [DOI] [PMC free article] [PubMed] [Google Scholar]
- Hall H, Wedel I, Halldin C, Kopp J, Farde L. Comparison of the in vitro receptor binding properties of N-[3H]methylspiperone and [3H]raclopride to rat and human brain membranes. J Neurochem. 1990;55:2048–2057. doi: 10.1111/j.1471-4159.1990.tb05794.x. [DOI] [PubMed] [Google Scholar]
- Hwang DR, Narendran R, Huang Y, Slifstein M, Talbot PS, Sudo Y, Van Berckel BN, Kegeles LS, Martinez D, Laruelle M. Quantitative analysis of (−)-N-11C-propyl-norapomorphine in vivo binding in nonhuman primates. J Nucl Med. 2004;45:338–346. [PubMed] [Google Scholar]
- Ichise M, Liow JS, Lu JQ, Takano A, Model K, Toyama H, Suhara T, Suzuki K, Innis RB, Carson RE. Linearized reference tissue parametric imaging methods: Application to [11C]DASB positron emission tomography studies of the serotonin transporter in human brain. J Cereb Blood Flow Metab. 2003;23:1096–1112. doi: 10.1097/01.WCB.0000085441.37552.CA. [DOI] [PubMed] [Google Scholar]
- Innis RB, Cunningham VJ, Delforge J, Fujita M, Gjedde A, Gunn RN, Holden J, Houle S, Huang SC, Ichise M, Iida H, Ito H, Kimura Y, Koeppe RA, Knudsen GM, Knuuti J, Lammertsma AA, Laruelle M, Logan J, Maguire RP, Mintun MA, Morris ED, Parsey R, Price JC, Slifstein M, Sossi V, Suhara T, Votaw JR, Wong DF, Carson RE. Consensus nomenclature for in vivo imaging of reversibly binding radioligands. J Cereb Blood Flow Metab. 2007;27:1533–1539. doi: 10.1038/sj.jcbfm.9600493. [DOI] [PubMed] [Google Scholar]
- Ito H, Hietala J, Blomqvist G, Halldin C, Farde L. Comparison of the transient equilibrium and continuous infusion method for quantitative PET analysis of [11C]raclopride binding. J Cereb Blood Flow Metab. 1998;18:941–950. doi: 10.1097/00004647-199809000-00003. [DOI] [PubMed] [Google Scholar]
- Kessler RM, Mason NS, Jones C, Ansari MS, Manning RG, Price RR. [18F]N-allyl-5-fluoropropylepidepride (Fallypride): Radiation dosimetry. Quantification of striatal and extrastriatal dopamine receptors in man. Neuroimage. 2000;11:S32. [Google Scholar]
- Lammertsma AA, Bench CJ, Hume SP, Osman S, Gunn K, Brooks DJ, Frackowiak RS. Comparison of methods for analysis of clinical [11C]raclopride studies. J Cereb Blood Flow Metab. 1996;16:42–52. doi: 10.1097/00004647-199601000-00005. [DOI] [PubMed] [Google Scholar]
- Laruelle M, D’souza CD, Baldwin RM, Abi-Dargham A, Kanes SJ, Fingado CL, Seibyl JP, Zoghbi SS, Bowers MB, Jatlow P, Charney DS, Innis RB. Imaging D2 receptor occupancy by endogenous dopamine in humans. Neuropsychopharmacology. 1997;17:162–174. doi: 10.1016/S0893-133X(97)00043-2. [DOI] [PubMed] [Google Scholar]
- Mukherjee J, Yang ZY, Das MK, Brown T. Fluorinated benzamide neuroleptics–III. Development of (S)-N-[(1-allyl-2-pyrrolidinyl)methyl]-5-(3-[18F]fluoropropyl)-2, 3-dimethoxybenzamide as an improved dopamine D2 receptor tracer. Nucl Medi Biol. 1995;22:283–296. doi: 10.1016/0969-8051(94)00117-3. [DOI] [PubMed] [Google Scholar]
- Narendran R, Hwang DR, Slifstein M, Talbot PS, Erritzoe D, Huang Y, Cooper TB, Martinez D, Kegeles LS, Abi-Dargham A, Laruelle M. In vivo vulnerability to competition by endogenous dopamine: Comparison of the D2 receptor agonist radiotracer (-)-N-[11C]propyl-norapomorphine ([11C]NPA) with the D2 receptor antagonist radiotracer [11C]-raclopride. Synapse (New York) 2004;52:188–208. doi: 10.1002/syn.20013. [DOI] [PubMed] [Google Scholar]
- Paxinos G, Huang XF, Toga AW. The rhesus monkey brain in stereotaxic coordinates. 1 v. Academic Press; San Diego: 2000. (various pagings) p. [Google Scholar]
- Pinborg LH, Videbaek C, Ziebell M, Mackeprang T, Friberg L, Rasmussen H, Knudsen GM, Glenthoj BY. [123I]epidepride binding to cerebellar dopamine D2/D3 receptors is displaceable: Implications for the use of cerebellum as a reference region. NeuroImage. 2007;34:1450–1453. doi: 10.1016/j.neuroimage.2006.11.003. [DOI] [PubMed] [Google Scholar]
- Ross SB, Jackson DM. Kinetic properties of the in vivo accumulation of 3H-(-)-N-n-propylnorapomorphine in mouse brain. Naunyn Schmiedebergs Arch Pharmacol. 1989;340:13–20. doi: 10.1007/BF00169200. [DOI] [PubMed] [Google Scholar]
- Seneca N, Finnema SJ, Farde L, Gulyas B, Wikstrom HV, Halldin C, Innis RB. Effect of amphetamine on dopamine D2 receptor binding in nonhuman primate brain: A comparison of the agonist radioligand [11C]MNPA and antagonist [11C]raclopride. Synapse (New York) 2006;59:260–269. doi: 10.1002/syn.20238. [DOI] [PubMed] [Google Scholar]
- Seneca N, Zoghbi SS, Skinbjerb M, Liow JS, Hong J, Sibley DR, Pike VW, Halldin C, Innis RB. Occupancy of dopamine D2/3 receptors in rat brain by endogenous dopamine measured with the agonist positron emission tomography radioligand [11C]MNPA. Synpase. doi: 10.1002/syn.20549. (in press) [DOI] [PMC free article] [PubMed] [Google Scholar]
- Sibley DR, Mahan LC, Creese I. Dopamine receptor binding on intact cells. Absence of a high-affinity agonist-receptor binding state. Mol Pharmacol. 1983;23:295–302. [PubMed] [Google Scholar]
- Siessmeier T, Zhou Y, Buchholz HG, Landvogt C, Vernaleken I, Piel M, Schirrmacher R, Rosch F, Schreckenberger M, Wong DF, Cumming P, Grunder G, Bartenstein P. Parametric mapping of binding in human brain of D2 receptor ligands of different affinities. J Nucl Med. 2005;46:964–972. [PubMed] [Google Scholar]
- Slifstein M, Hwang DR, Martinez D, Ekelund J, Huang Y, Hackett E, Abi-Dargham A, Laruelle M. Biodistribution and radiation dosimetry of the dopamine D2 ligand 11C-raclopride determined from human whole-body PET. J Nucl Med. 2006;47:313–319. [PubMed] [Google Scholar]
- Sokoloff P, Giros B, Martres MP, Bouthenet ML, Schwartz JC. Molecular cloning and characterization of a novel dopamine receptor (D3) as a target for neuroleptics. Nature. 1990;347:146–151. doi: 10.1038/347146a0. [DOI] [PubMed] [Google Scholar]
- Sprague DR, Chin FT, Liow JS, Fujita M, Burns HD, Hargreaves R, Stubbs JB, Pike VW, Innis RB, Mozley PD. Human biodistribution and radiation dosimetry of the tachykinin NK1 antagonist radioligand [18F]SPA-RQ: Comparison of thin-slice, bisected, and 2-dimensional planar image analysis. J Nucl Med. 2007a;48:100–107. [PMC free article] [PubMed] [Google Scholar]
- Sprague DR, Fujita M, Ryu YH, Liow JS, Pike VW, Innis RB. Whole-body biodistribution and radiation dosimetry in monkeys and humans of the Phospodiesterase 4 radioligand [11C](R)- Rolipram: Comparison of 2-Dimensional Planar, Bisected, and Quadrasected image analyses. 2007b. In submission. [DOI] [PMC free article] [PubMed]
- Stabin MG, Sparks RB, Crowe E. OLINDA/EXM: The second-generation personal computer software for internal dose assessment in nuclear medicine. J Nucl Med. 2005;46:1023–1027. [PubMed] [Google Scholar]
- Willeit M, Ginovart N, Kapur S, Houle S, Hussey D, Seeman P, Wilson AA. High-affinity states of human brain dopamine D2/3 receptors imaged by the agonist [11C]-(+)-PHNO. Biol Psychiatry. 2006;59:389–394. doi: 10.1016/j.biopsych.2005.09.017. [DOI] [PubMed] [Google Scholar]
- Willeit M, Ginovart N, Graff A, Rusjan P, Vitcu I, Houle S, Seeman P, Wilson AA, Kapur S. First human evidence of d-amphetamine induced displacement of a D2/3 agonist radioligand: A [11C]-(+)-PHNO positron emission tomography study. Neuropsychopharmacology. 2008;33:279–289. doi: 10.1038/sj.npp.1301400. [DOI] [PubMed] [Google Scholar]
- Wilson AA, McCormick P, Kapur S, Willeit M, Garcia A, Hussey D, Houle S, Seeman P, Ginovart N. Radiosynthesis and evaluation of [11C]-(+)-4-propyl-3,4,4a,5,6,10b-hexahydro-2H-naphtho[1,2-b] [1,4]oxazin-9 -ol as a potential radiotracer for in vivo imaging of the dopamine D2 high-affinity state with positron emission tomography. J Medi Chem. 2005;48:4153–4160. doi: 10.1021/jm050155n. [DOI] [PubMed] [Google Scholar]
- Zoghbi SS, Shetty HU, Ichise M, Fujita M, Imaizumi M, Liow JS, Shah J, Musachio JL, Pike VW, Innis RB. PET imaging of the dopamine transporter with 18F-FECNT: A polar radiometabolite confounds brain radioligand measurements. J Nucl Med. 2006;47:520–527. [PubMed] [Google Scholar]


