

Abstract
Translocator protein (TSPO) (18 kDa), formerly called the peripheral benzodiazepine receptor, is upregulated on activated microglia and macrophages and is, thus, a biomarker of inflammation. We previously reported that an 11C-labeled aryloxyanilide (half-life, 20 min) was able to quantify TSPOs in the healthy human brain. Because many PET centers would benefit from a longer-lived 18F-labeled radioligand (half-life, 110 min), the objective of this study was to evaluate the ability of a closely related aryloxyanilide (18F-N-fluoroacetyl-N-(2,5-dimethoxybenzyl)-2-phenoxyaniline [18F-PBR06]) to quantify TSPOs in the healthy human brain.
Methods
A total of 9 human subjects were injected with 18F-PBR06 (~185 MBq) and scanned for 5 h, with rest periods outside the camera. The concentrations of 18F-PBR06, separated from radiometabolites, were measured in arterial plasma.
Results
Modeling of regional brain and plasma data showed that a 2-tissue-compartment model was superior to a 1-tissue-compartment model. Even if data for all time points were used for the fitting, concentrations of brain activity measured with PET were consistently greater than the modeled values at late (280–300 min) but not at early time points. The greater values may have been caused by the slow accumulation of radiometabolites in the brain. To determine an adequate time for more accurate measurement of distribution volume (VT), which is the summation of receptor binding and nondisplaceable activity, we investigated which scan duration would be associated with maximal or near-maximal identifiability. We found that a scan of 120 min provided the best identifiability of VT (~2%). The images showed no significant defluorination.
Conclusion
18F-PBR06 can quantify TSPOs in the healthy human brain using 120 min of image acquisition and concurrent measurements of radioligand in plasma. Although brain activity is likely contaminated with radiometabolites, the percentage contamination is thought to be small (<10%), because values of distribution volume are stable during 60–120 min and vary by less than 10%. 18F-PBR06 is a longer-lived and promising alternative to 11C-labeled radioligands to measure TSPOs as a biomarker of inflammation in the brain.
Keywords: inflammation, microglia, distribution volume, aryloxyanilide, compartmental analysis, translocator protein (18 kDa)
Translocator protein (TSPO) (18kDa), formerly called the peripheral benzodiazepine receptor, is a mitochondrial protein that is highly expressed in phagocytic inflammatory cells, namely macrophages in the periphery and activated microglia in the central nervous system (1,2). Although the ligand 11C-PK 11195 and its active enantiomer 11C-(R)-PK 11195 have been used for in vivo imaging of peripheral benzodiazepine receptors (PBRs) for the past 2 decades (3), the ratio of specific to nonspecific binding has not been rigorously measured, but it is likely quite low. For example, even in human glioblastoma where TSPOs are expressed with high density, only 30% of total activity was due to specific binding (4). The relatively low affinity (index at the affinity [Ki] is 1–4 nM) and high lipophilicity (index at the lipophilicity [logD] is 3.97) of PK 11195 likely cause, respectively, low levels of specific binding and high levels of nondisplaceable activity.
In the past several years, several improved PET ligands from new structural classes have been developed, including aryloxyanilide-based ligands such as 11C-DAA1106 (5), 18F-FEDAA1106 (6), 11C-PBR01 (7), 11C-PBR28 (7), 18F-PBR06 (8), and 18F-FEPPA (9); pyrazolopyrimidine-based ligands such as 11C-DPA-713 (10) and 18F-DPA-714 (11); the 18F-labeled analogs (12); and the dihydropurinylacetamide 11C-AC-5216 (13). Because these ligands have 1.3 times (18F-DPA-714) to several times higher affinity and lower lipophilicity than PK 11195, they are expected to show higher levels of specific binding and lower levels of nondisplaceable activity. In fact, in rat models of neuroinflammation, 11C-DAA1106 (14) and 11C-DPA-713 (10) showed a greater contrast between lesioned and nonlesioned areas than did 11C-(R)-PK 11195.
Previous studies from our laboratory measured specific-to-nondisplaceable ratios of 2 ligands developed in our laboratory: 11C-PBR28 and 18F-N-fluoroacetyl-N-(2,5-dimethoxybenzyl)-2-phenoxyaniline (18F-PBR06). These were initially tested in monkeys by comparing distribution volumes obtained with a metabolite-corrected arterial input function under baseline and binding blockade conditions (8,15). Both of these ligands showed high specific-to-nondisplaceable ratios (9:1). After the promising results obtained in monkeys, we used compartmental modeling to successfully quantify 11C-PBR28 binding in healthy humans (16).
The current study tested the ligand PBR06—which was labeled with 18F—in healthy humans. 18F has the advantage of having a longer half-life than 11C (110 min vs. 20 min) and a lower positron energy (650 keV vs. 960 keV). The half-life of 18F allows a long period of data acquisition, which may be required to measure significantly increased binding site density. The half-life is sufficiently long to allow distribution of the radioligand for use at nearby PET centers having no cyclotron, as routinely done for 18F-FDG. In addition, 11C-PBR28 and 18F-PBR06 have different properties. PBR06 has a Ki of 1.0 nM and logD of 4.1 (17). The affinity (1/Ki) of PBR06 is 2.5 times greater than that of PBR28, and its lipophilicity is 100 times greater (7,17). This higher affinity would be expected to cause higher brain activity, but the high logD of 4.1 would be expected to cause lower passage through the blood–brain barrier than would the logD of PBR28 because of greater levels of nonspecific binding to plasma proteins (18).
In the current study, we evaluated the ability of 18F-PBR06 to quantify PBRs in the human brain. We sought to determine whether brain uptake was better quantified with a model having a single compartment (e.g., only specific binding) or 2 compartments (e.g., both specific and nonspecific binding), how well the primary measure of receptor binding (total distribution volume [VT]) was identified, and whether stable values of VT were attained during the scanning session.
MATERIALS AND METHODS
Radiopharmaceutical Preparation
18F-PBR06 was prepared by treating its bromomethyl analog with 18F-fluoride ion and purified with reversed-phase high-performance liquid chromatography (HPLC) (17). The radioligand was prepared according to our Investigational New Drug Application 23195, which was submitted to the U.S. Food and Drug Administration (a copy is available at: http://pdsp.med.unc.edu/snidd/). The radioligand was obtained in a state of high radio-chemical purity (>99%). The chemical purity was 88% ± 15%. Specific activity at the time of injection was 185 ± 64 GBq/μmol (mean ± SD).
Human Subjects
Nine healthy volunteers (6 men and 3 women; age, 32 ± 10 y) participated in this study. All subjects were free of current medical and psychiatric illness based on history, physical examination, electrocardiogram, urinalysis (including drug screening), and blood tests (complete blood count, serum chemistry, thyroid function test, and antibody screening for syphilis, HIV, and hepatitis B).
PET
After an injection of 18F-PBR06 (173 ± 25 MBq) over 1 min, 3-dimensional dynamic PET scans were acquired on an Advance camera (GE Healthcare) for 300 min in 45 frames of increasing duration from 30 s to 5 min. All PET images were reconstructed by filtered backprojection, with a full width at half maximum of 7.5 mm, and corrected for attenuation and scatter. Subjects had 3 rest periods (30 min each) outside the camera, beginning at approximately 120, approximately 180, and approximately 240 min after injection of the radioligand. One transmission scan was acquired before 18F-PBR06 injection. The position of the transmission scan was corrected for motion before applying attenuation correction. Head movement was corrected after the scan by realigning all images from each subject using Statistical Parametric Mapping (version 5 [SPM 5]; Wellcome Department of Cognitive Neurology).
MRI
To identify brain regions, MRI scans of 1.2-mm contiguous slices were obtained with a 1.5-T Signa device (GE Healthcare). Three sets of axial images were acquired using a spoiled gradient-recall sequence with the following parameters: repetition time, 12.4 ms; echo time, 5.3 ms; flip angle, 20°; and matrix, 256 × 256.
Measurement of 18F-PBR06 in Plasma
Blood samples (1 mL each) were drawn from the radial artery at 15-s intervals until 150 s, followed by 3-mL samples at 3, 4, 6, 8, 10, 15, 20, 30, 40, 50, 60, 75, 90, 120, 150, and 180 min. Radioactivity in plasma was quantified and corrected for radiometabolites using radiochromatography (HPLC; methanol:water:triethylamine, 75:25:0.1 by volume at 2.0 mL/min) with acetonitrile extracts from plasma (15,19). Radioanalysis was performed using reversed-phase HPLC consisting of a Novapak C18 column (4 μm, 100 × 8 mm; Waters Corp.). Radiochromatographic data were collected and smoothed with Bio-Chrome Lite software (Bioscan) and were decay-corrected until time zero of each radiochromatogram. The plasma time–activity curve was then corrected with the fraction of unchanged radioligand. The plasma free fraction (fP) of 18F-PBR06 was measured as described previously (20).
Image Analysis
Preset volumes of interest were positioned on the subject’s MR image and then transferred to the coregistered PET images using the following methods. Images were reconstructed on a 128 × 128 matrix with a pixel size of 2.0 × 2.0 × 4.25 mm in the x-, y-, and z-axes, respectively. Frames from 0 to 15 min of the PET scan were averaged to create a single image showing good delineation of cerebral cortices. A total of 3 MR images were realigned, and an average image was created to improve the signal-to-noise ratio using SPM 5 for each subject. The average MR image was coregistered to the average PET image, and both MR and PET images were spatially normalized to a standard anatomic orientation (Montreal Neurologic Institute space) by obtaining parameters from the MR image, again using SPM 5 for each subject. Preset volumes of interest were placed on the average of spatially normalized MR images overlying the following 11 regions: frontal cortex (27.2 cm3), parietal cortex (26.6 cm3), occipital cortex (31.2 cm3), temporal cortex (25.0 cm3), medial temporal cortex (14.4 cm3), caudate (5.6 cm3), putamen(6.5 cm3), cingulate (7.5 cm3), thalamus (12.6 cm3), pons (10.6 cm3), and cerebellum (51.2 cm3).
Estimation of Distribution Volume with Radiometabolite-Corrected Arterial Input Function
Distribution volume is an index of receptor density and is equal to the ratio at equilibrium of the concentration of radioligand in tissue to that in plasma. VT includes the concentrations of all radioligand in tissue (i.e., specific binding [receptor-bound] and nondisplaceable uptake [nonspecifically bound and free radioligand in tissue water]). The equilibrium value of VT was calculated kinetically from time–activity measurements of brain tissue using PET and measurements of the parent radioligand in plasma.
Time–activity data were analyzed with both 1- and 2-tissue-compartment models. The input function was corrected for radiometabolites and was calculated as the linear interpolation of the concentrations of 18F-PBR06 before the peak and as a triexponential fit of concentrations after the peak. Rate constants (K1, k2, k3, and k4) in standard 1- and 2-tissue-compartment models were estimated with the weighted least-squares method and the Marquardt optimizer. Brain data for each frame were weighted relative to other frames by assuming that the SD of the data was proportional to the inverse square root of noise equivalent counts. Each frame was weighted with the inverse square of the SD. Each model configuration was implemented to account for the contribution of activity to cerebral blood volume. Each model used measured whole-blood activity to assume that cerebral blood volume was 5% brain volume (21). The delay between the arrival of 18F-PBR06 in the radial artery and brain was estimated by fitting the whole brain, excluding the areas of mostly white matter.
We followed the recently proposed consensus nomenclature for reversibly binding radioligands (22), where VT is total distribution volume, including specific and nondisplaceable uptake, and BPND is a ratio of specific-to-nondisplaceable activity. Image and kinetic analyses were performed using pixelwise modeling software (PMOD 2.80; PMOD Technologies Ltd.) (23).
Statistical Analysis
Goodness of fit by nonlinear least-squares analysis was evaluated using Akaike’s information criterion (AIC) (24) and model selection criterion (MSC) (16); the latter is a modified version of the AIC proposed by Micromath Scientific Software. The most appropriate model is that with the smallest AIC and the largest MSC value. Goodness of fit by 1- and 2-compartment models was compared with F statistics that accounted for the number of variables in each model (25). A P value of less than 0.05 was considered significant for F statistics.
The identifiability of the kinetic variables was calculated as the SE of nonlinear least-squares estimation from the diagonal of the covariance matrix (26). The identifiability (i.e., SE) was expressed as a percentage of the rate constant itself. A smaller percentage indicates better identifiability.
Group data are expressed as mean ± SD.
RESULTS
Pharmacologic Effects
On the basis of patient reports, electrocardiogram, blood pressure, pulse, and respiration rate, the injection of 18F-PBR06 caused no pharmacologic effects during the 5-h scans. In addition, no significant effects were noted in any of the blood and urine tests acquired about 24 h after radioligand injection. The injected mass dose of PBR06 was 1.5 ± 0.6 nmol.
Plasma Analysis
The concentration of 18F-PBR06 peaked and rapidly declined thereafter, following a curve that was well fitted as a triexponential function, which showed average half-lives of 0.5, 5, and 450 min. Calculated as the partial area under the concentration-versus-time curve, 0.5, 5, and 450 min accounted for 17%, 27%, and 56%, respectively, of the area under the curve from peak to infinity. The concentration of 18F-PBR06 in plasma is shown in Figure 1A.
FIGURE 1.

(A) Concentration (Conc) of 18F-PBR06 in plasma. (B) Percentage composition of plasma that represents parent radioligand (●) and radiometabolites (○) is plotted vs. time after injection. Value for 10 min is shown on both graphs, which differ in range of y-axis. (C) This radiochromatogram illustrates plasma composition at 30 min after injection of 18F-PBR06. One radiometabolite (A; 47%) eluted in void volume of column, followed by other one (B; 16%) and parent 18F-PBR06 (37%). Radiometabolites A and B are both more polar than parent. cps = counts per second.
Reversed-phase HPLC showed the presence of 2 radiometabolites of 18F-PBR06, which appeared quickly in plasma and later became the predominant components (Figs. 1B and 1C). The radiometabolites eluted earlier than did 18F-PBR06, indicating that they were less lipophilic than 18F-PBR06. At 30 min, the less lipophilic of the 2 radiometabolites (47%) eluted in the void volume of the column at 2.6 min; the more lipophilic radiometabolite (16%) eluted at 4.5 min. The parent (37%) eluted at 6.7 min. The fP of 18F-PBR06 was 2.1% ± 0.4%. There was no significant correlation between VT and fP values.
Radioactivity in Brain and Skull
After 18F-PBR06 injection, all subjects showed moderate levels of brain activity that washed out gradually. The peak uptake occurred at 3 min and was approximately 170% of standardized uptake value (Fig. 2). Brain activity decreased to 50% of the peak by 60 min and to 30% of the peak by 240 min. As expected from the known distribution of TSPOs in the human brain (27,28), the distribution of activity was widespread and fairly uniform in the gray matter of cerebral cortices, cerebellum, basal ganglia, and thalamus (Fig. 3). Because no brain region lacks TSPO expression, we did not apply a reference region method in the kinetic analysis.
FIGURE 2.
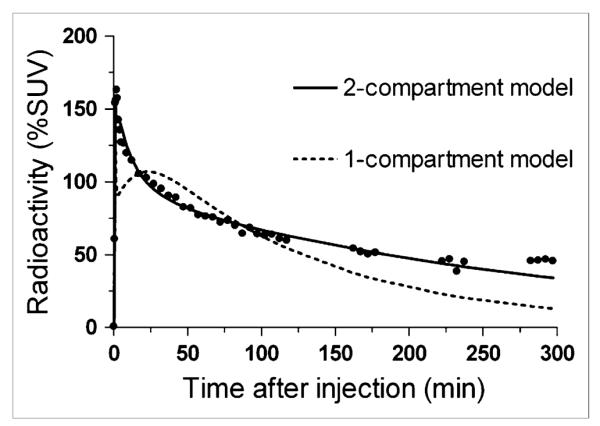
Time–activity data and curve fitting for temporal cortex. 2-compartment model provided significantly better fitting than did 1-compartment model in all regions for all subjects. %SUV = percentage standardized uptake value.
FIGURE 3.

PET and MR images from healthy subject. PET images from 0 to 300 min after injection of 18F-PBR06 were summed, and pixel values represent mean concentration of radioactivity (%SUV). Coregistered MR images are in middle column, and fused PET and MR images are in left column.
Fluorine-labeled radioligands may be metabolized by defluorination, with subsequent uptake of 18F-fluoride ion into bone, including the skull. In this study, however, no significant defluorination was found (Fig. 3 and Supplemental Fig. 1; supplemental materials are available online only at http://jnm.snmjournals.org).
Kinetic Analysis
We compared 1-compartment and unconstrained 2-compartment models by studying the results obtained from the full 5-h session. On the basis of F test, AIC, and MSC results, for all regions of all subjects the unconstrained 2-tissue-compartment model provided a significantly better fit than did the 1-tissue-compartment model (Fig. 2). In addition, the unconstrained 2-compartment model provided good identifiability of approximately 3%–4% and moderate intersubject variability (SD/mean) of approximately 30% for VT. Therefore, the unconstrained 2-compartment model described the data well, consistent with the presence of large amounts of both specific and nonspecific binding in the human brain. The blood volume correction did not substantively affect the results.
Although the unconstrained 2-tissue-compartment model showed good fit for the 5-h dataset as a whole, the fitting consistently overestimated the measured values at late time points (Fig. 2). Essentially, the measured brain activity was greater than that predicted from using only the parent radioligand in plasma as the input function. These results are consistent with the accumulation of radiometabolites in the brain, especially at later time points. As expected from this overestimation (Fig. 2), VT values increased with longer scan lengths (Figs. 4A and 4B).
FIGURE 4.

Average value of distribution volume (VT) and standard error (SE) in temporal cortex as function of duration of image acquisition using either 300 (A) or 120 (B) min as the terminal point. VT was calculated using unconstrained 2-tissue compartment model and then averaged for all 9 subjects. Scans were analyzed using brain data from time 0 to specified time on the x-axis. The same data are plotted with a terminal value of either entire 300 min of scanning (A) or only initial 120 min (B). VT (○) is plotted on the left y-axis. SE(%) (■) is plotted on the right y-axis.
To determine an optimal scan length, we calculated identifiability and VT for varying durations of scan data. Truncating the scan data from 0–100 to 0–60 min consistently worsened identifiability (i.e., increased the SE expressed as a percentage of VT itself [SE(%)]; y-axis on right in Fig. 4A). With scan data less than 50 min, the fitting did not even converge. With data longer than 120 min, identifiability also became worse. Thus, a scan length of 120 min had the best identifiability and also avoided the accumulation of radiometabolites that likely occurred after that time. Furthermore, even if the 60-min value of VT was correct, the value from 120 min of scanning was within 10% of this correct value (Fig. 4B). There was almost no effect of scan duration on the SD of VT values across subjects.
As noted above, the optimal method of quantitation used the unconstrained, 2-tissue-compartment model with the initial 120 min of data. Using this method, we calculated VT in 10 regions in all 7 subjects (Supplemental Table 1). The curves had excellent goodness of fit, with low values of AlC (~140) and high values of MSC (~4) (Supplemental Table 1). Although k2 and k3 were not as well identified (identifiability, 8%–19%), K1, and k4 had good identifiability (~6%–13%); most important, VT had excellent identifiability (2%–5%) for a composite ratio of variables. The coefficients of variation of VT across subjects were around 26%–34%.
DISCUSSION
This initial evaluation of 18F-PBR06 in healthy human subjects showed that brain uptake can be robustly calculated as VT using an unconstrained 2-tissue-compartment model. Compartmental analysis of the unusually long image acquisition (5 h) showed that radiometabolites may slowly accumulate in the brain, thereby causing VT to be overestimated. The identifiability of VT was best (i.e., achieved a minimal value of ~2%) using 2 h (120 min) of scan data. In addition to providing optimal identifiability, 120 min of scan data also provided excellent goodness of fit with the unconstrained 2-tissue-compartment model. Because VT depended on scan length, we recommend acquiring images for the same duration in all subjects, specifically 2 h, and using VT obtained by an unconstrained 2-tissue-compartment model to measure TSPOs in the healthy human brain.
Possible Influences of Radiometabolites in Quantification
We were able to acquire images for 5 h, which is longer than most PET studies with 18F as the radionuclide. Compartmental analysis of the 5 h of data suggested that radiometabolites accumulated slowly in the brain. That is, the concentrations of radioactivity in the brain at late time points were always higher than those calculated assuming that only parent radioligand entered the brain (i.e., compartmental modeling using 18F-PBR06 levels as arterial input) (Fig. 2). In addition, VT values increased commensurate with increasing scan durations (Figs. 4A and 4B). The relative concentration of PBR06 in the rat brain 30 min after injection was 90.4% ± 0.2% of the total activity (17). This value may decrease at later time points. The chemical identity of the radiometabolite in the human brain is not known, but studies in rats suggest it may be 18F-N-fluoroacetyl-p-phenoxyaniline (17). This radiometabolite (computed logD, 2.97) was extracted from the rat brain after injection of 18F-PBR06 and has the same retention time as peak B in radiochromatograms of human plasma (Fig. 1C).
When radiometabolites show small contributions to brain activity, the optimal scan length is commonly determined as the minimal scan length after which the measurement of VT becomes independent of the data length. However, if radiometabolites may slowly accumulate in the brain, we know of no standard approach to determine optimal scan length. In the absence of clear guidance, we selected the scan length based on the time when identifiability of VT achieved its best (i.e., smallest) value and also when the measurement of VT showed a small influence from the data length. Identifiability was large with scans of short (1 h) or long (5 h) duration. A minimal value of identifiability (~2%) was achieved with about 2 h of image acquisition (Figs. 4A and 4B). Nevertheless, brain scans from 2 h may have been contaminated by radiometabolites, and shorter acquisition would have been more accurate. If we assume that the shortest acquisition is the most accurate, then the results from 60 min would be the comparator, because fitting of less than 60 min typically did not even converge. With this worse-case comparison, the values of VT from 120 min of scanning are still within 10% of those using 60 min of data and have even better identifiability than those using 60 min of data (Fig. 4B). The optimal scan length can be different in patients who would presumably have higher VT values.
Comparison with 11C-PBR28 in Humans and Monkeys
In a previous study, we measured VT/fP of a closely related radioligand, 11C-PBR28, in humans (16) and rhesus monkeys (15) and found a 20x greater VT/fP in the monkey brain. When we compared the VT/fP results obtained in this human study of 18F-PBR06 with results previously obtained for rhesus monkeys (8), we found a similar difference in VT/fP between these species. The VT/fP of 18F-PBR06 was approximately 100 mL/cm3 (fP, 2.1%) in humans and 1,700–2,900 mL/cm3 (fP, 3.5%) in monkeys, respectively. Therefore, our PET studies using both radioligands confirm TSPO density differences between humans and rhesus monkeys reported in postmortem studies of a limited number of brain regions (27,29).
Notably, in rhesus monkeys, a 1-tissue-compartment model adequately described the brain kinetics of 11C-PBR28 (15), whereas in humans, a 2-tissue-compartment model was necessary (16). One possible reason for this difference is that, in comparison to the monkey brain, the human brain has 1/20th the amount of specific binding and therefore a higher percentage of nonspecific binding. However, to describe the brain kinetics of 18F-PBR06, a 2-tissue-compartment model was needed in both monkeys and humans. The reason for the differences between 11C-PBR28 and 18F-PBR06 are not clear, but the higher lipophilicity (logD: PBR06, 4.1, and PBR28, 3.0) and higher affinity (Ki: PBR06, 1.0 nM, and PBR28, 2.5 nM) of 18F-PBR06 may have caused kinetic brain behaviors to differ from those of 11C-PBR28. Direct comparison of these radioligands in the same subjects will provide further understanding of the differences between these 2 radioligands and their respective advantages. In monkeys, VT values became independent of data length when data of 150–200 min or longer were analyzed (8). The findings in monkeys contrast with those in humans, showing a gradual increase of VT (Fig. 4). Twenty times difference in receptor density is likely to be a major source of the difference between these species. In humans, VT/fP from 5-h data was 22 mL/cm3, 21% greater than that from 120-min data. That magnitude of the difference would not cause a substantial difference in monkeys because VT/fP is 20 times greater. Likewise, the influence of radiometabolites may not be so big in inflammatory areas as in the normal human brain because of the increased TSPO levels.
A Possible Alternative Measure of Receptor Binding
Although VT was used as the main measure of receptor binding in this study, BPND is, hypothetically, a possible alternative measure of receptor binding. Measuring BPND requires fewer resources than does measuring VT, because BPND does not require arterial blood sampling or HPLC measurement of metabolite-corrected arterial input function. However, reference tissue models require a brain region without specific binding as the reference region. The measurement of reference tissue models is a ratio of VT in regions to be studied to VT in a reference region. The reference region can be either a region without a binding site or a binding site that does not change between groups.
However, in this study, the average identifiability of BPND estimated by the nonlinear least-squares method was around 10%, suggesting that BPND is not suitable as a possible alternative of VT.
CONCLUSION
Binding of 18F-PBR06 in the healthy human brain was well identified with an unconstrained 2-tissue-compartment model using 120 min of scan data. The identifiability of VT from both shorter and longer scan durations was worse than that from 120 min. In addition, longer scans are likely contaminated by the slow accumulation of radiometabolites in the brain. Similar to our previously reported 11C-labeled radioligand PBR28, 18F-PBR06 is a promising PET tool to measure inflammation in the brain. 18F-PBR06 has a longer half-life and a shorter positron range, which will allow studies to be performed at greater distances from the radiochemistry production facility.
Supplementary Material
Supplemental Table 1. Unconstrained two-tissue compartment model using two hours of data: rate constants, distribution volumes, and goodness of fit in eleven brain regions
Supplemental Fig. 1. PET images from 180–300 minutes after injection of 18F-PBR06 were summed, and the pixel values represent the mean concentration of radioactivity (%SUV). The coregistered MRI images are in the middle column, and the fused PET and MRI images are in the left column.
ACKNOWLEDGMENTS
We thank the staff of the PET Department for successfully completing the PET scans, PMOD Technologies for providing its image-analysis and modeling software, Pavitra Kannan and Kimberly J. Jenko for providing support with the radiometabolite analysis, and Ioline Henter at NIMH for editing the manuscript. This research was supported by the Intramural Program of NIMH (project Z01-MH-002852-04).
REFERENCES
- 1.Papadopoulos V, Lecanu L, Brown RC, Han Z, Yao ZX. Peripheral-type benzodiazepine receptor in neurosteroid biosynthesis, neuropathology and neurological disorders. Neuroscience. 2006;138:749–756. doi: 10.1016/j.neuroscience.2005.05.063. [DOI] [PubMed] [Google Scholar]
- 2.Zavala F, Haumont J, Lenfant M. Interaction of benzodiazepines with mouse macrophages. Eur J Pharmacol. 1984;106:561–566. doi: 10.1016/0014-2999(84)90059-1. [DOI] [PubMed] [Google Scholar]
- 3.Venneti S, Lopresti BJ, Wiley CA. The peripheral benzodiazepine receptor (translocator protein 18kDa) in microglia: from pathology to imaging. Prog Neurobiol. 2006;80:308–322. doi: 10.1016/j.pneurobio.2006.10.002. [DOI] [PMC free article] [PubMed] [Google Scholar]
- 4.Pappata S, Cornu P, Samson Y, et al. PET study of carbon-11-PK 11195 binding to peripheral type benzodiazepine sites in glioblastoma: a case report. J Nucl Med. 1991;32:1608–1610. [PubMed] [Google Scholar]
- 5.Ikoma Y, Yasuno F, Ito H, et al. Quantitative analysis for estimating binding potential of the peripheral benzodiazepine receptor with [11C]DAA1106. J Cereb Blood Flow Metab. 2007;27:173–184. doi: 10.1038/sj.jcbfm.9600325. [DOI] [PubMed] [Google Scholar]
- 6.Fujimura Y, Ikoma Y, Yasuno F, et al. Quantitative analyses of 18F-FEDAA1106 binding to peripheral benzodiazepine receptors in living human brain. J Nucl Med. 2006;47:43–50. [PubMed] [Google Scholar]
- 7.Briard E, Zoghbi SS, Imaizumi M, et al. Synthesis and evaluation in monkey of two sensitive 11C-labeled aryloxyanilide ligands for imaging brain peripheral benzodiazepine receptors in vivo. J Med Chem. 2008;51:17–30. doi: 10.1021/jm0707370. [DOI] [PubMed] [Google Scholar]
- 8.Imaizumi M, Briard E, Zoghbi SS, et al. Kinetic evaluation in nonhuman primates of two new PET ligands for peripheral benzodiazepine receptors in brain. Synapse. 2007;61:595–605. doi: 10.1002/syn.20394. [DOI] [PubMed] [Google Scholar]
- 9.Wilson AA, Garcia A, Parkes J, et al. Radiosynthesis and initial evaluation of [18F]-FEPPA for PET imaging of peripheral benzodiazepine receptors. Nucl Med Biol. 2008;35:305–314. doi: 10.1016/j.nucmedbio.2007.12.009. [DOI] [PubMed] [Google Scholar]
- 10.Boutin H, Chauveau F, Thominiaux C, et al. 11C-DPA-713: a novel peripheral benzodiazepine receptor PET ligand for in vivo imaging of neuroinflammation. J Nucl Med. 2007;48:573–581. doi: 10.2967/jnumed.106.036764. [DOI] [PubMed] [Google Scholar]
- 11.James ML, Fulton RR, Vercoullie J, et al. DPA-714, a new translocator protein-specific ligand: synthesis, radiofluorination, and pharmacologic characterization. J Nucl Med. 2008;49:814–822. doi: 10.2967/jnumed.107.046151. [DOI] [PubMed] [Google Scholar]
- 12.Fookes CJ, Pham TQ, Mattner F, et al. Synthesis and biological evaluation of substituted [18F]imidazo[1,2-a]pyridines and [18F]pyrazolo[1,5-a]pyrimidines for the study of the peripheral benzodiazepine receptor using positron emission tomography. J Med Chem. 2008;51:3700–3712. doi: 10.1021/jm7014556. [DOI] [PubMed] [Google Scholar]
- 13.Zhang MR, Kumata K, Maeda J, et al. 11C-AC-5216: a novel PET ligand for peripheral benzodiazepine receptors in the primate brain. J Nucl Med. 2007;48:1853–1861. doi: 10.2967/jnumed.107.043505. [DOI] [PubMed] [Google Scholar]
- 14.Venneti S, Lopresti BJ, Wang G, et al. A comparison of the high-affinity peripheral benzodiazepine receptor ligands DAA1106 and (R)-PK11195 in rat models of neuroinflammation: implications for PET imaging of microglial activation. J Neurochem. 2007;102:2118–2131. doi: 10.1111/j.1471-4159.2007.04690.x. [DOI] [PubMed] [Google Scholar]
- 15.Imaizumi M, Briard E, Zoghbi SS, et al. Brain and whole-body imaging in nonhuman primates of [11C]PBR28, a promising PET radioligand for peripheral benzodiazepine receptors. Neuroimage. 2008;39:1289–1298. doi: 10.1016/j.neuroimage.2007.09.063. [DOI] [PMC free article] [PubMed] [Google Scholar]
- 16.Fujita M, Imaizumi M, Zoghbi SS, et al. Kinetic analysis in healthy humans of a novel positron emission tomography radioligand to image the peripheral benzodiazepine receptor, a potential biomarker for inflammation. Neuroimage. 2008;40:43–52. doi: 10.1016/j.neuroimage.2007.11.011. [DOI] [PMC free article] [PubMed] [Google Scholar]
- 17.Briard E, Zoghbi SS, Simeon FG, et al. Single-step high yield radiosynthesis and evaluation of a sensitive 18F-labeled ligand for imaging brain peripheral benzodiazepine receptors with PET. J Med Chem. 2009;52:688–699. doi: 10.1021/jm8011855. [DOI] [PMC free article] [PubMed] [Google Scholar]
- 18.Waterhouse RN. Determination of lipophilicity and its use as a predictor of blood-brain barrier penetration of molecular imaging agents. Mol Imaging Biol. 2003;5:376–389. doi: 10.1016/j.mibio.2003.09.014. [DOI] [PubMed] [Google Scholar]
- 19.Zoghbi SS, Shetty HU, Ichise M, et al. PET imaging of the dopamine transporter with 18F-FECNT: a polar radiometabolite confounds brain radioligand measurements. J Nucl Med. 2006;47:520–527. [PubMed] [Google Scholar]
- 20.Carson RE, Channing MA, Blasberg RG, et al. Comparison of bolus and infusion methods for receptor quantitation: applications to [18F]cyclofoxy and positron emission tomography. J Cereb Blood Flow Metab. 1993;13:24–42. doi: 10.1038/jcbfm.1993.6. [DOI] [PubMed] [Google Scholar]
- 21.Leenders KL, Perani D, Lammertsma AA, et al. Cerebral blood flow, blood volume and oxygen utilization: normal values and effect of age. Brain. 1990;113:27–47. doi: 10.1093/brain/113.1.27. [DOI] [PubMed] [Google Scholar]
- 22.Innis RB, Cunningham VJ, Delforge J, et al. Consensus nomenclature for in vivo imaging of reversibly binding radioligands. J Cereb Blood Flow Metab. 2007;27:1533–1539. doi: 10.1038/sj.jcbfm.9600493. [DOI] [PubMed] [Google Scholar]
- 23.Burger C, Mikolajczyk K, Grodzki M, Rudnicki P, Szabatin M, Buck A. JAVA tools quantitative post-processing of brain PET data [abstract] J Nucl Med. 1998;39(suppl):277P. [Google Scholar]
- 24.Akaike H. A new look at the statistical model identification. IEEE Trans Automat Contr. 1974;AC19:716–723. [Google Scholar]
- 25.Hawkins RA, Phelps ME, Huang S-C. Effects of temporal sampling, glucose metabolic rates, and disruptions of the blood-brain barrier on the FDG model with and without a vascular compartment: studies in human brain tumors with PET. J Cereb Blood Flow Metab. 1986;6:170–183. doi: 10.1038/jcbfm.1986.30. [DOI] [PubMed] [Google Scholar]
- 26.Carson RE. Parameter estimation in positron emission tomography. In: Phelps ME, Mazziotta JC, Schelbert HR, editors. Positron Emission Tomography and Autoradiography: Principles and Applications for the Brain and Heart. Raven Press; New York, NY: 1986. pp. 347–390. [Google Scholar]
- 27.Cymerman U, Pazos A, Palacios JM. Evidence for species differences in ‘peripheral’ benzodiazepine receptors: an autoradiographic study. Neurosci Lett. 1986;66:153–158. doi: 10.1016/0304-3940(86)90182-5. [DOI] [PubMed] [Google Scholar]
- 28.Doble A, Malgouris C, Daniel M, et al. Labelling of peripheral-type benzodiazepine binding sites in human brain with [3H]PK 11195: anatomical and subcellular distribution. Brain Res Bull. 1987;18:49–61. doi: 10.1016/0361-9230(87)90033-5. [DOI] [PubMed] [Google Scholar]
- 29.Pazos A, Cymerman U, Probst A, Palacios JM. ‘Peripheral’ benzodiazepine binding sites in human brain and kidney: autoradiographic studies. Neurosci Lett. 1986;66:147–152. doi: 10.1016/0304-3940(86)90181-3. [DOI] [PubMed] [Google Scholar]
Associated Data
This section collects any data citations, data availability statements, or supplementary materials included in this article.
Supplementary Materials
Supplemental Table 1. Unconstrained two-tissue compartment model using two hours of data: rate constants, distribution volumes, and goodness of fit in eleven brain regions
Supplemental Fig. 1. PET images from 180–300 minutes after injection of 18F-PBR06 were summed, and the pixel values represent the mean concentration of radioactivity (%SUV). The coregistered MRI images are in the middle column, and the fused PET and MRI images are in the left column.