

Abstract
Nucleotide-binding oligomerization domain (NOD)2/CARD15 protein, that senses muramyl dipeptide (MDP), a product of bacterial peptidoglycan, appears to play an important role in regulating intestinal immunity. Although the liver is exposed to gut-derived MDP, the influence of NOD2 ligation on hepatic APC, in particular dendritic cells (DC), is unknown. Freshly-isolated mouse liver and spleen plasmacytoid (p)DC expressed higher levels of NOD2 message than conventional myeloid (m)DC. Following MDP stimulation in vivo, liver pDC, but not mDC, upregulated expression of IFN regulatory factor 4 (IRF4), a negative regulator of TLR signaling, and induced less allogeneic T cell proliferation and IFNγ production. Their adoptive transfer failed to prime allogeneic T cells in vivo. By contrast, splenic DC IRF4 levels and T cell stimulatory activity remained unchanged. Liver pDC from MDP-stimulated mice also displayed greater IκBα, cell surface B7-H1, and B7-H1 relative to CD86 than control liver pDC. No similar effects were observed for liver mDC or spleen DC. Absence of B7-H1 on liver pDC reversed the inhibitory effect of MDP. After ex vivo stimulation with LPS or CpG, liver pDC but not mDC from MDP-treated animals secreted less IL-12p70, IL-6 and TNFα and induced weaker allogeneic T cell proliferation than those from controls. Moreover, CpG-stimulated liver pDC from MDP-treated mice secreted less IFNα than their splenic counterparts, and systemic levels of IFNα were reduced in MDP-treated animals after CpG administration. These findings suggest that differential effects of NOD2 ligation on liver pDC may play a role in regulating hepatic innate and adaptive immunity.
Keywords: dendritic cells, tolerance/suppression/anergy, T cells
Introduction
There is growing evidence that liver immune function is influenced by its location downstream of the gut. The gastrointestinal tract is an important portal of entry for various pathogens and also hosts commensal bacteria that, together, release so-called “pathogen-associated molecular patterns.” These include bacterial endotoxin (LPS), peptidoglycan and bacterial lipoprotein that, after reaching the liver via the portal vein, are recognized by specific pattern-recognition molecules (PRM) on different cell types, including dendritic cells (DC). Liver DC are uniquely well-equipped APC regarded as critical instigators and regulators of innate and adaptive immunity (1–4). Four major DC sub-sets have been identified in mouse liver: conventional myeloid (m) DC (CD11c+CD11b+B220−), plasmacytoid (p) DC (CD11cloCD11b−B220+Ly6C+), CD8α+ DC (CD11c+CD8α+), and natural-killer (NK) DC (CD11c+NK1.1+) (5–8). mDC are the best characterized, and are thought to play pivotal roles in hepatic tolerance and immunity (9–12). pDC, that are comparatively abundant in the liver (5), are the principal source of type-1 IFNs in the body (13), and have also been implicated in hepatic tolerance (14).
Compared to spleen, skin or blood DC, freshly-isolated liver DC are inferior stimulators of allogeneic T cell responses, and can induce Ag-specific T cell hyporesponsiveness (5, 15–18). Recent data support the hypothesis that these properties of liver DC may reflect an adaptive response to continual LPS exposure, that prevents chronic liver inflammation (19–20). Previously, we have shown that liver DC are hyporesponsive to stimulation via TLR4 (“endotoxin tolerance”) and that subsequent stimulation with other TLR ligands, such as the TLR9 ligand CpG, results in an attenuated response (“cross tolerance”) (16, 19).
NOD2 (nucleotide-binding oligomerization domain 2, also known as caspase activation and recruitment domain 15 [CARD15]), is a recently-discovered PRM that mediates resistance to mycobacterial infection and regulates innate and adaptive immune responses. Its ligand is a component of peptidoglycan termed muramyl dipeptide (MDP), the largest molecular motif common to gram positive/negative bacteria (21–22). Unlike TLR, NOD2 is a cytosolic protein, expressed mainly by macrophages, DC and intestinal epithelial cells exposed to peptidoglycan under physiological conditions (23). It belongs to a large family of >20 members, whose defining feature is a modular domain organization of a C-terminal leucine-rich repeat domain, that binds MDP, a central NOD domain and N-terminal effector domain, composed of a CARD, pyrin domain or baculovirus ‘inhibitor of apoptosis’ repeat (Bir) domain (24). Upon sensing MDP, NOD2 undergoes conformational changes that lead to a CARD-CARD interaction with the receptor-interacting serine/threonine kinase (RICK), a downstream effector molecule that mediates ubiquitination of IkB-kinase-γ (IKK-γ), associated with NF-κB activation and transcription of pro-inflammatory cytokines (23).
The functional significance of NOD2 in regulation of immune responses is underscored by the fact that a subpopulation of Crohn’s disease patients bears mutations in the NOD2 gene (25–26), that are associated with younger age at diagnosis, ileal involvement, ileocecal resections, and a high risk of postoperative relapse and reoperation (27). Moreover, there is recent evidence that systemic administration of MDP prevents the development of experimental colitis in mice through the suppression of multiple TLR pathways (TLR2, TLR4 and TLR9), with associated reduction in Th1 responses (28). Hedl et al (29) have reported that, unlike peripheral-derived macrophages, intestinal macrophages, that are chronically exposed to MDP from the gut lumen, do not secrete TNF-α after acute MDP stimulation, suggesting a possible “MDP tolerance” mechanism similar to that described for LPS. Furthermore, prolonged exposure of macrophages to MDP reduces pro-inflammatory cytokine production after re-challenge with TLR ligands (“cross-tolerance”) (29). These regulatory effects of NOD2 signaling have recently been correlated with induction of a gene transcription regulatory protein, IFN regulatory factor 4 (IRF4) (28), that negatively regulates TLR signaling (30–31). Taken together, these findings suggest an important role of NOD2 signaling in regulating innate and adaptive immunity.
The liver is exposed continually to MDP, yet no data are available concerning the expression and role of NOD2 in liver DC subsets. In this study, we aimed to analyze NOD2 expression in liver mDC and pDC, to ascertain the influence of in vivo NOD2 ligation on liver DC function, and to address mechanisms underlying observed effects.
Materials and Methods
Experimental Animals
Male C57BL/10 (B10) (H-2b) and BALB/c (H2d) mice (8–12 wks old) were purchased from The Jackson Laboratory (Bar Harbor, ME). B7-H1-deficient mice (B6[H-2b] background) were described previously (32). They were maintained in the specific pathogen-free facility of University of Pittsburgh School of Medicine. Experiments were conducted in accordance with the National Institutes of Health Guide for Care and Use of Laboratory Animals, and under an Institutional Animal Care and Use Committee-approved protocol. Mice received Purina rodent chow (Ralston Purina, St. Louis, MO) and tap water ad libitum.
Reagents
RPMI-1640 complete medium was used for cell culture, as described (19). Chinese hamster ovary cell-derived recombinant human fms-like tyrosine kinase 3 ligand (Flt3L) was provided by Amgen (Seattle, WA). MDP and LPS (from Salmonella Minnesota R595, specific for TLR4) were purchased from Invivogen (San Diego, CA) and Alexis Biochemicals (San Diego, CA) respectively. CpG ODN-B was purchased from the Coley Pharmaceutical Group (Wellesley, MA).
Isolation of liver and spleen DC subsets
CD11c+ cells were isolated from livers and spleens of mice given the endogenous DC poietin Flt3L (10 µg/mouse/day i.p., for 10 days) as described (16), and either MDP (100µg/mouse/day i.p.) or PBS for the last 3 days of cytokine treatment. Bulk DC were enriched by density centrifugation using Nycodenz (Sigma, St, Louis, MO). For pDC purification (>95%), mPDCA1+ cells were positively selected from the DC-enriched fraction using immunomagnetic beads and a paramagnetic LS column (Miltenyi Biotec, Auburn, CA). For mDC purification, mPDCA1− cells collected in the negative fraction after pDC selection were first run through LD columns (Miltenyi Biotec) to remove residual mPDCA1+ cells, then incubated with anti-mouse CD11c immunomagnetic beads (clone N418; Miltenyi Biotec) and positively selected by passage through a paramagnetic LS column, yielding a highly-enriched (≥95%) CD11c+mPDCA1− population.
Flow cytometry (cell surface staining)
Cells were treated with FcγR-blocking rat anti-mouse CD16/32 mAb (2.4G2) to avoid non-specific Ab binding. For cell surface staining, they were then incubated for 30 min with FITC-, PE-, PE-Cy5-, or PE-Cy7-conjugated mAbs to detect expression of CD11c (HL3), CD11b (M1/70), B220/CD45R (RA3-6B2), IAb β-chain (25-9-17), CD40 (3/23), CD80 (16-10A1), CD86 (GL1) or B7-H1 (MIH5) (eBioscience, San Diego, CA). All mAbs and appropriate Ig isotype controls were obtained from BD PharMingen (San Diego, CA), unless specified. Flow analysis was performed using a LSR II flow cytometer (BD Bioscience, San Jose, CA) and results expressed as % positive cells and mean fluorescence intensity (MFI).
RT-PCR
RNA was extracted using Trizol (Invitrogen, Carlsbad, CA) then reversed transcribed using the iScript cDNA Synthesis kit (Bio-Rad). Reactions for semi-quantitative PCR were performed with Fast SYBR Green PCR Master Mix (Applied Biosystems, Foster City, CA) and primers specific for NOD2 (F: 5’-GCTGCCAATCTTCACGTCGTC-3’; R: 5’-TAAGTACTGAGGAAGCGAGACTGA-3’), IRF4 (F: 5’-GCCCAACAAGCTAGAAAG-3 ’ ; R : 5 ’-TCTCTGAGGGTCTGGAAACT-3’) (31), IFNα4 (from SABiosciences, Frederick, MD), or β-actin (F: 5’-AGAGGGAAATCGTGCGTGAC-3 ’ ; R : 5 ’-CAATAGTGATGACCTGGCCGT-3’) in triplicate. Reactions were amplified with an Applied Biosystems PRISM 7500 Fast Real-time PCR System at an annealing temperature of 62°C. Data were plotted using the manufacturer’s software as theΔRn fluorescence signal vs cycle number. The cycle threshold number was determined as the cycle number at which the ΔRn crosses this threshold. Relative gene expression was determined by extrapolation from a standard curve amplified from control cDNA, then normalized to expression of β-actin mRNA using the comparative cycle threshold method.
Western blot analysis
Cytoplasmic and nuclear proteins were resolved in 10% SDS-polyacrylamide electrophoresis gels, electrotransferred to nitrocellulose, and subjected to Western blot analysis. IκBα Abs were purchased from Cell Signaling (Danvers, MA). Western blotting signals were obtained using commercially available horseradish peroxidase-conjugated secondary Abs, and developed using the Super Signal Chemiluminescent Substrate purchased from Pierce (Rockford, IL).
T cell purification
Bulk T cells were purified from spleens and lymph nodes of normal BALB/c mice. Single cell suspensions were incubated with a mAb cocktail consisting of anti-CD45R/B220 (RA3-6B2), anti-CD16/CD32 (2.4G2), anti-TER-119 and anti-Ly6G (RB6-8C5) obtained from BD PharMingen. After washing, non-T cells were eliminated from the cell suspension by adding Mouse Depletion Dynabeads (Dynal Biotech, Oslo, Norway) and following the manufacturer’s instructions.
MLR
Graded numbers of B10 DC were used as stimulators of normal bulk allogeneic BALB/c T cells (2×10⁵/well) in 72 h MLR using 96-well, round-bottom plates, as described (33). For the final 16–18 h, individual wells were pulse-labeled with 1 µCi [3H] thymidine. Radioisotope incorporation was determined using a β scintillation counter and results expressed as mean cpm ± 1 SD of triplicate wells.
Adoptive cell transfer
Flt3L-expanded CD11cloPDCA1+ pDC were isolated from livers and spleens of PBS- or MDP-treated B10 mice using immunomagnetic beads (Miltenyi Biotec). Two million cells were adoptively transferred by i.v. injection (lateral tail vein) into normal, allogeneic recipients (BALB/c). Seven days later, proliferative responses of host T cells (2.105) to stimulation with various numbers of donor CD3− splenocytes were determined by thymidine incorporation in MLR, as described above.
Intracellular cytokine staining
Purified DC were treated with brefeldin A (GolgiPlug™; 1 µl/ml, BD PharMingen) for 16 h, labeled with FITC-conjugated anti-CD11c (HL3) and PE-Cy5-conjugated anti-B220/CD45R (RA3-6B2) mAb, then fixed in 2% v/v paraformaldehyde. The cells were permeabilized with 0.1% saponin, then incubated with PE-conjugated anti-IL-12p40/p70 (C15.6) or rat IgG (all BD PharMingen) for 30 min. Flow analysis was performed as described above and results expressed as % positive cells.
ELISA
Levels of IL-12p70, IL-6, TNFα, IFNα and IFNγ in culture supernatants were determined by ELISA, using commercial kits from Biolegend Inc., San Diego, CA (IL-12p70, IL-6, TNFα, IFNγ) and PBL Biomedical Laboratories, Piscataway, NJ (IFNα) respectively, and following the manufacturers’ instructions. The limits of detection for IL-12p70, IL-6, TNFα, IFNα and IFNγ were 7.8, 2.0, 2.0, 12.5 and 15.6 pg/ml, respectively.
Statistical analysis
Data are expressed as means ± 1 SD. Significances of differences between means were determined by unpaired Student’s ‘t’-test. A ‘p’ value < 0.05 was considered significant.
Results
Freshly-isolated liver and spleen DC express NOD2 and pDC express higher levels than mDC; in vivo treatment with MDP does not change the number and relative proportion of liver and spleen DC subsets
Under physiological conditions, NOD2 is expressed mainly by epithelial cells and APC (34), including macrophages and bone marrow-derived DC, as well as human blood monocytes, DC and monocyte-derived DC (35–36), but not by other hematopoietic cells (37–38). No data are available concerning NOD2 expression by liver or spleen DC subsets. To address this question, freshly-isolated, immunobead-sorted liver and spleen pDC (CD11clomPDCA1+B220+) and mDC (CD11c+mPDCA1− B220−) from Flt3L-treated B10 mice (Fig.1 A; purity >95%) were analyzed for NOD2 mRNA expression by semi-quantitative RT-PCR, as described in the Materials and Methods. As shown in Fig. 1B, both liver and spleen DC subsets expressed NOD2 mRNA. In each tissue, 2–3-fold higher levels of mRNA were expressed in pDC compared with mDC. We next analyzed the absolute number of in vivo Flt3L-expanded immunobead-sorted liver and spleen DC subsets isolated from PBS- and MDP-treated mice at a dosage (100µg/d, i.p., 3 days) shown by Watanabe et al (28) to prevent experimental colitis in mice. As shown in Fig.1C, no differences in absolute DC numbers were detected between the PBS- and MDP- groups. The data confirmed in both groups, the relative abundance of pDC in the liver compared with the spleen.
FIGURE 1.

Freshly-isolated plasmacytoid (p)DC express higher levels of NOD2 message than myeloid (m) DC and in vivo treatment with MDP does not affect the number and proportion of liver and spleen DC subsets. Freshly-isolated, immunobead-purified liver and spleen pDC and mDC were isolated from C57BL/10 (B10) mice treated for 10 consecutive days with the endogenous DC poietin Flt3L (10µg/d, i.p.). A) mPDCA-1+ and mPDCA-1−CD11c+ immunobead-purified cells were stained with anti-B220 and anti-CD11c mAbs. Flow cytometric analysis shows a purity >95% of liver and spleen CD11clowB220+ pDC and CD11c+B220−mDC; B) DC subsets were analyzed for NOD2 relative to β-actin mRNA expression by semi-quantitative RT-PCR, as described in the Materials and Methods. Data are representative of three independent experiments, with two mice per group in each experiment. *p<0.004. For negative and positive control purposes, NOD2 expression was evaluated in a mouse D10 T cell line (Tc) and in normal mouse peritoneal macrophages (M), respectively. (C) Absolute number of Flt3L-expanded, freshly-isolated, immunobead-purified liver and spleen pDC and mDC from MDP-treated (100µg/d, i.p., 3 days) and control (PBS) mice. Data are representative of five independent experiments, with two mice per group in each experiment.
Freshly-isolated liver pDC from MDP-treated animals exhibit impaired ability to induce allogeneic T cell proliferation and IFNγ production
Ag presentation, T cell activation/proliferation and IFNγ secretion are pivotal steps in inducing and regulating immune responses. In the next series of experiments, we tested whether MDP infusion of mice could modify the T cell stimulatory function of DC subsets. To address this issue, Flt3L-expanded freshly-isolated liver or spleen pDC or mDC from MDP- or PBS-injected (control) B10 mice were co-cultured in MLR with normal allogeneic (BALB/c) bulk T cells for 72 h. T cell proliferation and IFNγ levels in culture supernatants were determined by MLR and ELISA, as described in the Materials and Methods. As shown in Fig. 2A, liver pDC isolated from MDP-treated animals exhibited much inferior T cell allostimulatory activity when compared with those from control mice. By contrast, liver mDC from MDP-treated animals showed no significant change in their ability to induce T cell proliferation. On the other hand, the T cell stimulatory activity of neither spleen pDC nor mDC from MDP-injected animals was affected (Fig. 2, A and B). While liver pDC pre-exposed to MDP in vivo showed significantly impaired ability to induce IFNγ secretion in MLR (Fig. 2C), no significant changes in IFNγ production were detected when liver mDC or spleen DC subsets were used as T cell stimulators in MLR (Fig. 2C, and data not shown).
FIGURE 2.

Freshly-isolated liver pDC from MDP-treated animals exhibit comparatively weak ability to induce allogeneic T cell proliferation and IFNγ production. Flt3L-expanded, freshly-isolated, immunobead-purified liver and spleen pDC and mDC from MDP (100µg/d, i.p., for 3 d)- or PBS-treated B10 mice were used as stimulators in 72 h MLR (responder cells: BALB/c bulk T cells). A) T cell proliferation was quantified by [3H]TdR incorporation. The proliferation of BALB/c T cells cultured alone (Neg control) and the responses of T cells stimulated with pDC or mDC isolated from CpG-ODN B (CpG)- or LPS-treated (LPS) mice (positive controls) are also shown. Data are representative of three independent experiments, with two mice per group in each experiment (*p<0.004). B) overall statistical analysis of three independent experiments showing the percentage of T cell proliferation induced by MDP-treated liver and spleen DC subsets relative to PBS-treated groups (*p<0.004). C) Supernatants from co-cultures of liver or spleen DC subsets from MDP- or PBS-treated B10 mice with BALB/c bulk T cells were harvested at 72 h and IFNγ levels quantified by ELISA. Data are representative of three independent experiments, with two mice per group in each experiment (*p<0.007 compared with MDP; NS: not significant).
Adoptive transfer of liver pDC from MDP-treated animals fails to prime allogeneic T cells in vivo
We next examined the ability of liver and spleen pDC from control or MDP-treated B10 mice to prime normal allogeneic T cells in vivo. As shown in Fig. 3, T cells harvested from BALB/c mice injected systemically 7 days previously with 2×10⁶ splenic pDC, showed marked enhancement of anti-donor proliferative reactivity in MLR, irrespective of donor MDP treatment. By contrast, donor pretreatment with MDP resulted in complete suppression of the ability of liver pDC to prime allogeneic T cells in vivo.
FIGURE 3.

Adoptive transfer of liver pDC from MDP-treated animals fails to prime allogeneic T cells in vivo. Flt3L-expanded liver or spleen pDC (2.106) from PBS- or MDP-treated B10 mice were injected i.v. into groups of 2–3 normal, allogeneic (BALB/c) recipients. Seven days later, proliferative responses of host bulk T cells (2.105) to stimulation with various numbers of B10 CD3− splenocytes were determined, as described in the Materials and Methods. For control purposes, proliferation of unprimed BALB/c bulk T cells stimulated by B10 CD3− splenocytes (Control) was tested. Results are means 1SD of triplicate cultures and are from one experiment representative of 2 performed. *p<0.01.
Elevated B7-H1/CD86 ratio on liver pDC from MDP-treated animals correlates with impaired T cell stimulatory ability
Since DC function and the outcome of DC-T cell interactions may depend on the net co-regulatory signals delivered by DC-expressed B7 family molecules, we next examined the cell surface expression of co-inhibitory B7-H1 (also called PD-L1) and co-stimulatory CD86 (B7-2) molecules on Flt3L-expanded, freshly-isolated liver and spleen DC subsets from MDP- or PBS-treated animals. As shown in Fig. 4A, B7-H1 expression was upregulated significantly on a subset of liver pDC from MDP-treated animals compared with DC from controls (MFI: 33.1±5.0 vs 22.7±3.0; p<0.02). With regard to CD86 expression on liver and spleen DC subsets, no significant differences were detected between MDP-treated and control animals (Fig. 4B). However, when the B7-H1/CD86 ratio, reported previously to negatively correlate with lymphocyte activation (39), was calculated (Fig. 4C), only liver pDC from MDP-treated animals showed a higher ratio compared with control groups (B7-H1/CD86: 1.9±0.7 vs 1.4±0.4; p<0.007). This higher B7-H1/CD86 ratio on liver pDC exposed to MDP in vivo was consistent with their inferior ability to induce T cell proliferation and IFNγ production (Fig. 2, A and C) and to prime allogeneic T cells in vivo (Fig. 3). To verify the role of B7-H1 signaling in mediating the influence of MDP on liver pDC, we next used liver pDC isolated from B7-H1−/− animals as stimulators in 72 h MLR. As shown in Figure 4D, the impaired ability of liver pDC from MDP-treated mice to induce allogeneic T cell proliferation was reversed when B7-H1−/− pDC were used as stimulators, further implicating B7-H1 in the inhibitory action of MDP on liver pDC function. As with conventional DC (40), T cell proliferation induced by pDC isolated from B7-H1−/− animals was higher than that induced by DC from wild-type mice both in the PBS and MDP groups.
FIGURE 4.

B7-H1 and B7-H1:CD86 (B7-2) MFI ratio on freshly-isolated liver pDC from MDP-treated animals correlates with inferior T cell stimulatory ability. Flt3L-expanded, freshly-isolated, immunobead-purified liver and spleen pDC and mDC from MDP (100µg/d, i.p., for 3 d)- or PBS-treated B10 mice were analyzed for (A) cell surface B7-H1 and (B) CD86 MFI by flow cytometry. C) overall analysis of three independent experiments, with two mice per group in each, showing the percentage change in B7-H1/CD86 ratio between MDP-treated and PBS control groups. D) T cell proliferation induced by liver pDC isolated from MDP (100µg/d, i.p., for 3 d)- or PBS-treated B7-H1−/− (KO) or wild-type (WT) control mice. The proliferation of BALB/c T cells cultured alone (Neg control) and the responses of T cells stimulated with pDC isolated from CpG-ODN B (CpG)-treated KO or WT mice (positive controls) are also shown. Data are representative of three independent experiments, with two mice per group in each experiment. (*p<0.01 compared with MDP WT; NS: not significant).
The liver environment plays a key role in mediating the influence of MDP on hepatic pDC
To ascertain whether the liver microenvironment is involved in the effect of MDP on liver pDC, Flt3L-expanded, freshly-isolated, immunobead-purified liver pDC were cultured with or without 10–100µg/ml of MDP. Twenty-four hour later, B7-H1 expression determined by flow cytometry, was unaffected by exposure to MDP (PD-L1 MFI: 23±5 [10µg], 22±4 [100µg] vs 21±5 [0µg]) and, the T cell allostimulatory activity of MDP pre-exposed liver pDC did not differ from that of control cells (supplemental Fig.S1). The discrepancy between, the consequences of in vivo and in vitro exsposure to MDP supports the hypothesis that the liver environment most likely play a key role in mediating the in vivo effect of MDP on hepatic pDC.
Inhibition of the T cell stimulatory ability of liver pDC by MDP in vivo is associated with up-regulation of IRF4 and IκBα
It has been shown recently (28) that in vivo stimulation of NOD2 with MDP is associated with the upregulation, in CD11b+ myeloid cells, of the gene transcription regulatory molecule IRF4, a negative regulator of the signaling cascade leading to NF-κB activation. To ascertain whether the in vivo inhibitory effect of MDP on liver pDC was associated with a change in IRF4 expression, we performed RT-PCR on Flt3L-expanded freshly-isolated liver and spleen DC subsets, isolated 8 and 24 hr after MDP or PBS treatment (control). As shown in Fig. 5A, at 24 h liver but not spleen pDC from MDP-treated mice expressed significantly (3-fold) higher IRF4 mRNA than pDC from the control group, while no significant differences in liver and spleen mDC IRF4 expression were detected between the MDP- and PBS-treated groups. Analysis of liver and spleen DC subsets isolated at 8 h after the last injection of MDP did not reveal any significant difference in IRF4 expression between the groups (data not shown), suggesting that early kinetics of IRF4 expression were not affected.
FIGURE 5.
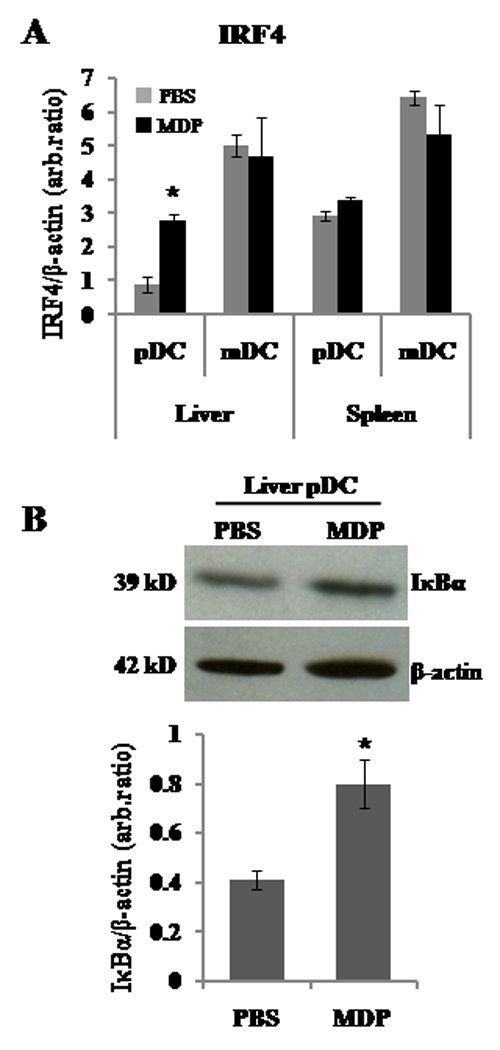
MDP stimulation in vivo is associated with upregulated expression of IRF4 and IκBα inhibitors in liver pDC. A) Flt3L-expanded, freshly-isolated, immunobead-purified liver and spleen pDC and mDC from MDP (100µg/d, i.p., for 3 d)- or PBS-treated B10 mice were analysed for IRF4/β-actin ratio by semi-quantitative real-time RT-PCR. Liver pDC isolated from MDP-treated mice showed a significantly higher level of IRF4 message than control liver pDC (*p<0.033). No significant differences were detected for liver mDC or spleen DC subsets. Data shown are representative of three independent experiments, with two mice per group in each experiment. B) Flt3L-expanded, freshly-isolated, immunobead-purified liver pDC from MDP (100µg/d, i.p., for 3 d)- or PBS-treated mice were analyzed for IκBα by Western blot analysis. In vivo MDP-preconditioned liver pDC exhibited a higher level of IκBα than control pDC (*p<0.05). GAPDH = housekeeping protein.
Ubiquitination of the inhibitor IκBα is a key and common step in different NF-κB activation pathways. Therefore, we next verified, by Western blotting, whether the increased IRF4 levels in liver pDC from MDP-treated mice were associated with modification of IκBα inhibitor levels. As shown in Fig. 5B, higher levels of IκBα were demonstrated in liver pDC from MDP-treated animals compared with those in pDC from control mice.
In vivo MDP treatment impairs TLR4- and TLR9-induced T cell stimulatory activity of liver pDC
Under normal, steady-state conditions, in vitro culture of liver and spleen DC subsets, with or without LPS or CpG, up-regulates their T cell stimulatory activity to varying degrees. Moreover, it has been shown that MDP stimulation interferes with subsequent reactivity (NF-κB activation) of human macrophages or DC in response to TLR ligands (28–29). Therefore, we next analyzed the ability of liver and spleen DC subsets to upregulate their T cell stimulatory function after overnight culture with or without LPS or CpG (TLR4 and TLR9 ligands, respectively). Murine pDC have been shown to express low levels of TLR4 (16–17, 41–43). As shown in Fig. 6A, both freshly-isolated liver pDC and those cultured overnight from MDP-treated animals in medium alone exhibited inferior T cell allostimulatory activity then those from PBS-treated control mice. This difference in stimulatory function was more marked when the corresponding pDC population were compared following overnight culture in LPS or CpG (1µg/ml) (Fig. 6A). Similar results were obtained when lower concentrations of LPS or CpG (10 and 100 ng/ml) were used (data not shown). By contrast, liver mDC and both spleen DC subsets exposed to MDP in vivo retained their allogeneic T cell stimulatory activity compared with DC from PBS-treated mice (Fig. 6B).
FIGURE 6.

In vivo MDP stimulation impairs TLR4- and TLR9-induced T cell stimulatory activity of liver but not spleen pDC. Flt3L-expanded, freshly-isolated, immunobead-purified liver pDC from MDP (100µg/d, i.p., for 3 d)- or PBS-treated B10 mice were cultured overnight with LPS or CpG (1µg/ml) or culture media (CM) alone; after washing, the cells were used as stimulators in 72 h MLR (responder cells: BALB/c bulk T cells). A) T cell proliferation induced by freshly-isolated and overnight-cultured liver pDC (cultured in CM alone or LPS or CpG) was quantified by [3H]TdR incorporation. For control purposes, the proliferation of BALB/c T cells cultured alone was measured (Neg control). Data shown are representative of three independent experiments, with two mice per group in each experiment (*p<0.004: PBS/CM vs MDP/CM; †p<0.004: PBS/LPS vs MDP/LPS; ‡p<0.004: PBS/CpG vs MDP/CpG). B) overall statistical analysis of three independent MLR, showing the percentage of T cell proliferation induced by liver or spleen DC from the MDP-treated compared to PBS-treated groups (*p<0.004).
In vivo MDP administration reduces TLR4- and TLR9-induced IL-12 production by liver pDC
IL-12 plays a critical role in the development of Th1 cells from naïve CD4+ T cells (44). We next examined whether in vivo MDP administration influenced TLR4- or TLR9 ligand-mediated IL-12 production by liver and spleen DC subsets, using intracellular cytokine staining and ELISA, as described in the Materials and Methods. As shown in Fig. 7, A and C, liver pDC and mDC from MDP-treated mice cultured overnight without TLR ligation displayed significantly reduced IL-12p70 production compared with cells from control mice (pDC: not detectable [ND] vs 138±25 pg/ml, p<0.01; mDC: 160±50 vs 405±46pg/ml, p<0.01). When liver DC stimulated with MDP in vivo were cultured overnight with LPS (1µg/ml) or CpG (100 ng/ml), IL-12p70 secretion by pDC remained lower than that of control pDC (LPS: 220±37 vs 701±45 pg/ml, p<0.01; CpG: 230±26 vs 421±42 pg/ml, p<0.01), whereas liver mDC exhibited similar IL-12 secretion to cells from PBS-treated animals (LPS: 937±70 vs 1043±45 pg/ml, NS; CpG: 170±27 vs 120±76 pg/ml, NS). Similar results were obtained when lower concentrations of LPS (10 and 100 ng/ml) and CpG (10 ng/ml) were used (data not shown). However, much higher concentration of CpG (1µg/ml) could override the influence of MDP on liver pDC (data not shown). Spleen DC subsets isolated from MDP-treated mice did not show any differences from controls in IL-12 production after overnight culture, with or without LPS or CpG (data not shown).
FIGURE 7.

In vivo MDP stimulation reduces TLR4- and TLR9-induced IL-12 production by liver pDC. Flt3L-expanded, freshly-isolated, immunobead-purified liver pDC and mDC from MDP (100µg/d, i.p., for 3 d)- or PBS-treated B10 mice were cultured overnight with LPS (1µg/ml) or CpG (100 ng/ml) or culture media (CM) alone. Thereafter, supernatants and cells were harvested in order to detect IL-12p40/70 production by ELISA (A, C) and intracellular staining by flow cytometry (B, D). The top histograms of A and C show ELISA data from one experiment representative of three independent experiments, with two mice per group in each; in the lower histograms, the overall analysis of all three experiments is shown. B, D) Flow analysis results showing data of one representative experiment of three independent experiments, with two mice per group in each. (*p<0.01). ND = not detected.
Consistent with the ELISA data, flow analysis of intracellular IL-12p40/70 production showed reduced cytokine accumulation within liver pDC from MDP-treated mice after culture with or without LPS (1 µg/ml) or CpG (100 ng/ml) compared with control DC (Fig. 7B) (overall analysis of 3 experiments, CM: 0.9±0.1% vs 2.0±0.4%, P<0.05; LPS: 2.3±0.6% vs 3.7±0.7%, p<0.05; CpG: 2.0±0.2 vs 4.6±0.4, p<0.05). In contrast, the incidence of liver mDC from MDP-treated animals that were positive for IL-12p40/70 after LPS or CpG stimulation was not significantly different to that of the control group (LPS: 7.8±4% vs 5.3±1.6%, NS; CpG: 3.5±0.7 vs 4.0±0.8, NS), although after overnight culture in culture medium (CM) alone, MDP-exposed liver mDC exhibited a lower incidence of positive cells than control mDC (1.3±0.4%vs3.6±1.5%; p<0.05) (Fig. 7D). Intracellular staining of spleen DC subsets for IL-12p40/70 did not reveal any differences between MDP- and PBS-treated animals (data not shown).
In vivo MDP administration reduces TLR4- and TLR9-induced IL-6 and TNFα production by liver pDC
IL-6 and TNFα play important roles in innate and adaptive immune responses and pDC are an important source of these cytokines (45–46). Therefore we next analyzed the impact of in vivo MDP treatment on IL-6 and TNFα production by liver pDC. Flt3L mobilized, freshly-isolated, immunobead-purified liver pDC from MDP- or PBS-treated mice were cultured overnight with or without LPS or CpG (1µg/ml) and levels of secreted IL-6 and TNFα measured by ELISA, as described in the Materials and Methods. As shown in Fig 8, after culture in CM alone, no differences were detected between pDC from MDP-and PBS-treated animals (IL-6: 37±11 vs 50±10 pg/ml, NS; TNFα: ND vs ND). After overnight culture with LPS or CpG, liver pDC from MDP-treated mice produced less IL-6 and TNFα as compared to control groups (IL-6/LPS: 144±15 vs 500±55 pg/ml, p<0.001; IL-6/CpG: 618±24 vs 2006±79 pg/ml, p<0.001; TNFα/LPS: 28±11 vs 522±25 pg/ml, p<0.0004; TNFα/CpG: ND vs 50±7 pg/ml, p<0.001). Similar results were obtained when lower concentrations of LPS and CpG (10 and 100 ng/ml) were used (data not shown).
FIGURE 8.

In vivo MDP administration reduces TLR4- and TLR9-induced IL-6 and TNFα production by liver pDC. Flt3L-expanded, freshly-isolated, immunobead-purified liver pDC from MDP (100µg/d, i.p., for 3 d)- or PBS-treated B10 mice were cultured overnight with LPS or CpG (1µg/ml) or culture media (CM) alone. Thereafter, supernatants were harvested in order t o detect IL-6 and TNFα production by ELISA. Data shown are representative of three independent experiments, with two mice per group in each experiment. (*p<0.001). ND= not detected.
Systemic MDP administration impairs TLR9-induced IFNα production by liver pDC and reduces circulating IFNα levels
Considering the higher proportion of pDC in liver than in spleen (5), and the unique ability of pDC to produce type-I IFNs that are important in anti-viral immunity, we next analyzed the influence of MDP treatment on the ability of liver and spleen pDC to secrete IFNα after overnight culture, with or without CpG stimulation. As shown in Fig. 9A, freshly-isolated liver pDC from MDP-treated animals stimulated with CpG (1µg/ml) secreted a much lower level of IFNα than liver pDC from control animals (ND vs 37±1 pg/ml, respectively; p<0.0004). To determine the in vivo functional relevance of these findings, we measured IFNα mRNA in freshly-isolated liver pDC and IFNα levels in serum from MDP-pretreated and control mice, 6 h after CpG (7.5µg/g, i.v.) administration. As shown in Fig. 9B, liver pDC from MDP-treated mice expressed significantly lower levels of IFNα than those from controls. Furthermore, serum IFNα concentrations were reduced >50% in the MDP-treated group (Fig. 9C).
FIGURE 9.

In vivo MDP stimulation reduces TLR9-induced IFNα production by liver pDC and systemic IFNα levels. A) Flt3L-expanded, freshly-isolated, immunobead-purified liver pDC from MDP (100µg/d, i.p., for 3 d)- or PBS-treated B10 mice were cultured overnight with CpG (1µg/ml) or culture media (CM) alone; thereafter, supernatants were harvested in order to detect IFNα secretion by ELISA. Data are representative of three independent experiments, with two mice per group in each experiment (*p<0.008). B) B10 mice were treated with the endogenous DC poietin Flt3L (10µg/mouse/day i.p., for 10 days) and either MDP (100µg/mouse/day i.p.) or PBS for the last 3 days of Flt3L treatment. Twenty four h later, mice were injected with CpG-ODN B (7.5µg/g, i.v.) and euthanized 6 h thereafter. Freshly-isolated, immunobead-sorted CD11clomPDCA1+ liver pDC were analyzed for IFNα:β-Actin mRNA ratio by real time RT-PCR (*p<0.002); C) serum IFNα levels were measured by ELISA (*p<0.005). ND = not detected.
Discussion
Many clinical and experimental observations support the view that the liver is a unique organ in which tolerance is favored over immunity (47–49). Thus, the liver appears to play an important role in oral (50) and portal venous tolerance (51), whereas hepatic allografts are accepted more readily than others types of organ transplant (52–53), and can protect other grafts from the same donor from rejection (54–55). Furthermore, hepatitis B and C virus infection is more likely to induce chronic infection of the liver than other organs (56–57). Despite compelling evidence of hepatic tolerogenicity, the mechanisms that regulate the balance between tolerance and immunity in the liver microenvironment are still ill-defined. Several findings support a pivotal role of hepatic APC, in particular DC (4, 14, 18).
Herein, we describe for the first time, how NOD2 ligation in vivo can regulate innate and adaptive immune reactivity through selective functional modification of liver DC subsets. Our data show that freshly-isolated liver pDC express higher levels of NOD2 message than conventional liver mDC, and that similar differences are observed between spleen DC subsets. However, regardless of NOD2 expression, liver and spleen DC subsets show differences in phenotype and function when stimulated in vivo with the NOD2 ligand MDP. Administration of 100µg MDP for three consecutive days, establishes a physiological amount equivalent to MDP levels in the colon (58), that prevent experimentally-induced colitis (28). When compared to control liver pDC, freshly-isolated liver pDC from MDP-treated animals showed weaker ability to induce allogeneic T cell proliferation, with associated reduction in IFNγ production, increased B7-H1 expression on a subset of cells, elevated cell surface B7-H1/CD86 ratio, and increased expression of the NF-κB signaling inhibitory molecules IRF4 and IκBα. In vivo, liver pDC from MDP-treated mice failed to prime allogeneic T cells. By contrast, these differences were not detected for liver mDC or spleen DC subsets.
Our findings also show that MDP stimulation in vivo significantly interferes with subsequent responses of liver pDC to TLR4 or TLR9 ligation. Ex vivo stimulation with either LPS or CpG did not up-regulate the T cell stimulatory activity of MDP-exposed liver pDC to the same extent as that of control liver pDC. In addition, MDP treatment reduced IL-12, IL-6 and TNFα production by pDC with and without LPS or CpG stimulation. Furthermore, CpG-stimulated liver pDC secreted lower levels of IFNα than their splenic counterparts, and systemic administration of CpG in MDP-treated mice induced lower levels of IFNα message in liver pDC and lower systemic IFNα levels than in control animals. Taken together, these findings demonstrate that systemic exposure to MDP markedly and selectively influences liver DC function, compared with secondary lymphoid tissue DC, and that liver pDC are more affected than liver mDC, reflecting their higher levels of MDP receptor (NOD2) expression. These findings have significant implications for liver immunobiology, given that, when compared with the spleen, higher proportions of pDC relative to conventional mDC are found in normal mouse livers, or livers in which DC have been expanded by systemic administration of the DC poietin Flt3L (5, 42). Our data also show that MDP treatment does not affect the relatively high proportion of pDC relative to mDC foud in the liver. Moreover, pDC are the major producers of type-I IFNs in the body and are therefore important in innate anti-viral responses, as well as in adaptive immunity and tolerance (13, 59). In addition, while mDC tend to prime Th type-1 (Th1) responses, pDC can induce Th1, Th2 or regulatory T cell (Treg) responses, depending on the nature of the Ag and the costimulatory and co-regulatory signals delivered to T cells (13, 60–61).
Recently, pDC have been implicated in the prolongation or indefinite survival of organ or skin allografts and the induction of alloAg-specific Treg (62–64). The impaired ability of liver pDC stimulated in vivo with MDP to induce T cell proliferation, together with decreased IFNγ production in MLR, suggest a switch from Th1-polarizing ability, consistent with recent clinical observations. Thus, small intestine graft recipients with Crohn’s disease-associated NOD2 gene polymorphism and lack of normal NOD2 signaling, are at higher risk of graft rejection and loss, suggesting an important role of intact NOD2 signaling in the regulation of gut mucosal and alloimmune responses (65).
Our interest in B7-H1 expression and the B7-H1/CD86 ratio on the surface of liver pDC from MDP-stimulated and control mice is based on evidence that the balance between inhibitory B7-H1 and costimulatory B7-1(CD80)/B7-2(CD86) ligands regulates T cell function (39, 66). Indeed, we previously observed a much higher (5- to 6-fold) ratio of B7-H1 to CD86 on CpG-stimulated murine pDC compared with mDC, and that blockade of B7-H1 on pDC increased their T-cell allostimulatory ability (64). In the present study, co-stimulatory molecule expression was not significantly different between liver and spleen DC subsets isolated from MDP-treated and control mice (data not shown). However, B7-H1 expression on a subset of cells (that may account for the effects observed) and the B7-H1/CD86 ratio were higher on liver pDC of MDP-treated animals. The significant positive correlation we observed between weak T cell allostimulatory activity and high B7-H1/CD86 ratio on liver pDC from MDP-treated mice (compared with control cells) was confirmed using B7-H1−/− mice. Indeed, MDP treatment of B7-H1−/− mice did not impair the ability of their liver pDC to stimulate allogeneic T cell proliferation, suggesting a B7-H1-dependent mechanism underlying the effect of MDP. In the current study, the inhibitory effect of MDP on liver pDC was associated with the induction of a previously identified TLR and (likely) NOD2 inhibitory molecule, IRF4 (28). IRF4 has been shown to compete with IRF5 for binding to MyD88. It also binds to TNF receptor-associated factor 6 (TRAF6) and/or RICK (31), and thus interferes with the ability of these components to activate the NF-κB pathway through ubiquitination of IκBα, which was higher in liver pDC from MDP-treated mice than in control liver pDC. Consistent with our data, it has been shown that prevention of experimentally-induced colitis by systemic administration of MDP is associated with the upregulation of IRF4 expression in CD11b+ myeloid cells from mesenteric lymph nodes and spleen (28).
Several in vivo and in vitro studies suggest that chronic exposure to MDP induces “self” and “cross” tolerance. Hedl el al (29) have shown that primary, monocyte-derived macrophages, pre-exposed to MDP in vitro, fail to produce pro-inflammatory cytokines after restimulation with MDP or TLR4 ligation, and that intestinal macrophages, that are chronically exposed to gut-derived MDP, fail to produce pro-inflammatory cytokines (TNFα) after TLR4 or MDP activation. Moreover, Watanabe et al (28) have demonstrated that in vivo MDP treatment downregulates TLR2-, 4- and 9-mediated IL-12 production by colon lamina propria lymphocytes, and that lymphocytes from mesenteric lymph nodes and intestinal lamina propria of MDP-treated mice secrete less IFNγ when stimulated with anti-CD3 than those from controls. In the liver, the interaction between NOD2 and TLR signaling has not previously been investigated. Consistent with Watanabe et al (28), our data demonstrate that in vivo MDP stimulation results in a downregulatory effect on TLR4 and TLR9 signaling. Indeed, LPS or CpG stimulation did not upregulate IL-12 or T cell stimulatory activity of liver pDC from MDP-exposed animals to the same extent as that of control mice. These data are consistent with higher expression of NOD2 and IRF4 in liver pDC, which suggests an inhibitory effect of IRF4 on the signaling cascade leading to NF-κB activation. Notably, liver mDC, that expressed lower levels of NOD2 compared with pDC, did not up-regulate IRF4 after MDP treatment, and TLR4-induced IL-12 production and T cell stimulatory activity after LPS stimulation were similar to that of control mDC, although the inherent ability of liver mDC to upregulate IL-12 secretion after maturation in culture was impaired. This suggests that signaling events in liver mDC downstream of NOD2 and TLR ligation may differ from those in liver pDC.
MDP treatment also impaired the CpG-induced T cell stimulatory ability of liver pDC. The analysis conducted of splenic DC subsets did not show any significant changes, consistent with an important influence of the liver microenvironment on DC responsiveness. Indeed, we found that unlike in vivo, MDP had little direct effect on liver pDC fuction in vitro. It has been reported for pDC that engagement of TLR9 by CpG, leading to IFNα secretion, involves a multi-protein signal-transducing complex, that includes MyD88, TRAF6 and IRF7 (67). MyD88 and TRAF6 are inhibited by IRF4 (31), which we found was increased in liver but not spleen pDC after systemic MDP treatment. Consistent with the expression of IRF4, stimulation of liver pDC from MDP-treated animals with CpG did not induce the same level of IFNα secretion as from control pDC. By contrast, expression of IRF4 in spleen pDC from MDP-treated mice did not differ from the control group, and IFNα secretion after CpG stimulation was higher (data not shown). Consistent with these ex vivo findings, IFNα message expression in liver pDC from MDP pre-treated mice was lower than in control pDC after systemic CpG administration, and associated with lower circulating levels of IFNα, indicating that functional modification of liver pDC by MDP may also have systemic effects.
In conclusion, these data suggest that NOD2 ligation affects functions of liver pDC associated with upregulated IRF4 and IκBα expression that may play important roles in innate and adaptive immunity. Moreover, our novel findings suggest that the influence of MDP on the T cell allostimulatory ability of liver pDC is modulated by B7-H1 expression.
Supplementary Material
Acknowledgments
We acknowledge the invaluable expertise of Alan Zahorchak in performing Western blot analyses and Miriam Freeman in manuscript preparation.
This work was supported by National Institutes of Health grants R01 AI067541, R01 AI60994, and P01 81678 (AWT) and by the Roche Organ Transplantation Research Foundation (874279717). AC and TLS are supported by Basic Science Fellowships from the American Society of Transplantation. DT was in receipt of a Uehara Foundation Fellowship.
Nonstandard abbreviations used in this paper:
- DC
dendritic cells
- Flt3L
fms-like tyrosine kinase 3 ligand
- mDC
myeloid DC
- pDC
plasmacytoid DC
- Treg
regulatory T cells
- Foxp3
forkhead winged helix protein-3
References
- 1.Banchereau J, Steinman RM. Dendritic cells and the control of immunity. Nature. 1998;392:245–252. doi: 10.1038/32588. [DOI] [PubMed] [Google Scholar]
- 2.Morelli AE, Thomson AW. Dendritic cells: regulators of alloimmunity and opportunities for tolerance induction. Immunol Rev. 2003;196:125–146. doi: 10.1046/j.1600-065x.2003.00079.x. [DOI] [PubMed] [Google Scholar]
- 3.Steinman RM, Hawiger D, Nussenzweig MC. Tolerogenic dendritic cells. Annu Rev Immunol. 2003;21:685–711. doi: 10.1146/annurev.immunol.21.120601.141040. [DOI] [PubMed] [Google Scholar]
- 4.Sumpter TL, Abe M, Tokita D, Thomson AW. Dendritic cells, the liver, and transplantation. Hepatology. 2007;46:2021–2031. doi: 10.1002/hep.21974. [DOI] [PubMed] [Google Scholar]
- 5.Pillarisetty VG, Shah AB, Miller G, Bleier JI, DeMatteo RP. Liver dendritic cells are less immunogenic than spleen dendritic cells because of differences in subtype composition. J Immunol. 2004;172:1009–1017. doi: 10.4049/jimmunol.172.2.1009. [DOI] [PubMed] [Google Scholar]
- 6.Lian ZX, Okada T, He XS, Kita H, Liu YJ, Ansari AA, Kikuchi K, Ikehara S, Gershwin ME. Heterogeneity of dendritic cells in the mouse liver: identification and characterization of four distinct populations. J Immunol. 2003;170:2323–2330. doi: 10.4049/jimmunol.170.5.2323. [DOI] [PubMed] [Google Scholar]
- 7.O'Connell PJ, Morelli AE, Logar AJ, Thomson AW. Phenotypic and functional characterization of mouse hepatic CD8 alpha+ lymphoid-related dendritic cells. J Immunol. 2000;165:795–803. doi: 10.4049/jimmunol.165.2.795. [DOI] [PubMed] [Google Scholar]
- 8.Jomantaite I, Dikopoulos N, Kroger A, Leithauser F, Hauser H, Schirmbeck R, Reimann J. Hepatic dendritic cell subsets in the mouse. Eur J Immunol. 2004;34:355–365. doi: 10.1002/eji.200324336. [DOI] [PubMed] [Google Scholar]
- 9.Lu L, Woo J, Rao AS, Li Y, Watkins SC, Qian S, Starzl TE, Demetris AJ, Thomson AW. Propagation of dendritic cell progenitors from normal mouse liver using granulocyte/macrophage colony-stimulating factor and their maturational development in the presence of type-1 collagen. J Exp Med. 1994;179:1823–1834. doi: 10.1084/jem.179.6.1823. [DOI] [PMC free article] [PubMed] [Google Scholar]
- 10.Lu L, Rudert WA, Qian S, McCaslin D, Fu F, Rao AS, Trucco M, Fung JJ, Starzl TE, Thomson AW. Growth of donor-derived dendritic cells from the bone marrow of murine liver allograft recipients in response to granulocyte/macrophage colony-stimulating factor. J Exp Med. 1995;182:379–387. doi: 10.1084/jem.182.2.379. [DOI] [PMC free article] [PubMed] [Google Scholar]
- 11.Lau AH, Thomson AW. Dendritic cells and immune regulation in the liver. Gut. 2003;52:307–314. doi: 10.1136/gut.52.2.307. [DOI] [PMC free article] [PubMed] [Google Scholar]
- 12.Hsu W, Shu SA, Gershwin E, Lian ZX. The current immune function of hepatic dendritic cells. Cell Mol Immunol. 2007;4:321–328. [PubMed] [Google Scholar]
- 13.Siegal FP, Kadowaki N, Shodell M, Fitzgerald-Bocarsly PA, Shah K, Ho S, Antonenko S, Liu YJ. The nature of the principal type 1 interferon-producing cells in human blood. Science. 1999;284:1835–1837. doi: 10.1126/science.284.5421.1835. [DOI] [PubMed] [Google Scholar]
- 14.Goubier A, Dubois B, Gheit H, Joubert G, Villard-Truc F, Asselin-Paturel C, Trinchieri G, Kaiserlian D. Plasmacytoid dendritic cells mediate oral tolerance. Immunity. 2008;29:464–475. doi: 10.1016/j.immuni.2008.06.017. [DOI] [PMC free article] [PubMed] [Google Scholar]
- 15.Goddard S, Youster J, Morgan E, Adams DH. Interleukin-10 secretion differentiates dendritic cells from human liver and skin. Am J Pathol. 2004;164:511–519. doi: 10.1016/S0002-9440(10)63141-0. [DOI] [PMC free article] [PubMed] [Google Scholar]
- 16.De Creus A, Abe M, Lau AH, Hackstein H, Raimondi G, Thomson AW. Low TLR4 expression by liver dendritic cells correlates with reduced capacity to activate allogeneic T cells in response to endotoxin. J Immunol. 2005;174:2037–2045. doi: 10.4049/jimmunol.174.4.2037. [DOI] [PubMed] [Google Scholar]
- 17.Tokita D, Sumpter TL, Raimondi G, Zahorchak AF, Wang Z, Nakao A, Mazariegos GV, Abe M, Thomson AW. Poor allostimulatory function of liver plasmacytoid DC is associated with pro-apoptotic activity, dependent on regulatory T cells. J Hepatol. 2008;49:1008–1018. doi: 10.1016/j.jhep.2008.07.028. [DOI] [PMC free article] [PubMed] [Google Scholar]
- 18.Bamboat ZM, Stableford JA, Plitas G, Burt BM, Nguyen HM, Welles AP, Gonen M, Young JW, DeMatteo RP. Human liver dendritic cells promote T cell hyporesponsiveness. J Immunol. 2009;182:1901–1911. doi: 10.4049/jimmunol.0803404. [DOI] [PMC free article] [PubMed] [Google Scholar]
- 19.Abe M, Tokita D, Raimondi G, Thomson AW. Endotoxin modulates the capacity of CpG-activated liver myeloid DC to direct Th1-type responses. Eur J Immunol. 2006;36:2483–2493. doi: 10.1002/eji.200535767. [DOI] [PubMed] [Google Scholar]
- 20.Lunz JG, 3rd, Specht SM, Murase N, Isse K, Demetris AJ. Gut-derived commensal bacterial products inhibit liver dendritic cell maturation by stimulating hepatic interleukin-6/signal transducer and activator of transcription 3 activity. Hepatology. 2007;46:1946–1959. doi: 10.1002/hep.21906. [DOI] [PubMed] [Google Scholar]
- 21.Girardin SE, Boneca IG, Viala J, Chamaillard M, Labigne A, Thomas G, Philpott DJ, Sansonetti PJ. Nod2 is a general sensor of peptidoglycan through muramyl dipeptide (MDP) detection. J Biol Chem. 2003;278:8869–8872. doi: 10.1074/jbc.C200651200. [DOI] [PubMed] [Google Scholar]
- 22.Inohara N, Ogura Y, Fontalba A, Gutierrez O, Pons F, Crespo J, Fukase K, Inamura S, Kusumoto S, Hashimoto M, Foster SJ, Moran AP, Fernandez-Luna JL, Nunez G. Host recognition of bacterial muramyl dipeptide mediated through NOD2. Implications for Crohn's disease. J Biol Chem. 2003;278:5509–5512. doi: 10.1074/jbc.C200673200. [DOI] [PubMed] [Google Scholar]
- 23.Strober W, Murray PJ, Kitani A, Watanabe T. Signalling pathways and molecular interactions of NOD1 and NOD2. Nat Rev Immunol. 2006;6:9–20. doi: 10.1038/nri1747. [DOI] [PubMed] [Google Scholar]
- 24.Fritz JH, Ferrero RL, Philpott DJ, Girardin SE. Nod-like proteins in immunity, inflammation and disease. Nat Immunol. 2006;7:1250–1257. doi: 10.1038/ni1412. [DOI] [PubMed] [Google Scholar]
- 25.Hampe J, Grebe J, Nikolaus S, Solberg C, Croucher PJ, Mascheretti S, Jahnsen J, Moum B, Klump B, Krawczak M, Mirza MM, Foelsch UR, Vatn M, Schreiber S. Association of NOD2 (CARD 15) genotype with clinical course of Crohn's disease: a cohort study. Lancet. 2002;359:1661–1665. doi: 10.1016/S0140-6736(02)08590-2. [DOI] [PubMed] [Google Scholar]
- 26.Bonen DK, Ogura Y, Nicolae DL, Inohara N, Saab L, Tanabe T, Chen FF, Foster SJ, Duerr RH, Brant SR, Cho JH, Nunez G. Crohn's disease-associated NOD2 variants share a signaling defect in response to lipopolysaccharide and peptidoglycan. Gastroenterology. 2003;124:140–146. doi: 10.1053/gast.2003.50019. [DOI] [PubMed] [Google Scholar]
- 27.Buning C, Genschel J, Buhner S, Kruger S, Kling K, Dignass A, Baier P, Bochow B, Ockenga J, Schmidt HH, Lochs H. Mutations in the NOD2/CARD15 gene in Crohn's disease are associated with ileocecal resection and are a risk factor for reoperation. Aliment Pharmacol Ther. 2004;19:1073–1078. doi: 10.1111/j.1365-2036.2004.01967.x. [DOI] [PubMed] [Google Scholar]
- 28.Watanabe T, Asano N, Murray PJ, Ozato K, Tailor P, Fuss IJ, Kitani A, Strober W. Muramyl dipeptide activation of nucleotide-binding oligomerization domain 2 protects mice from experimental colitis. J Clin Invest. 2008;118:545–559. doi: 10.1172/JCI33145. [DOI] [PMC free article] [PubMed] [Google Scholar]
- 29.Hedl M, Li J, Cho JH, Abraham C. Chronic stimulation of Nod2 mediates tolerance to bacterial products. Proc Natl Acad Sci U S A. 2007;104:19440–19445. doi: 10.1073/pnas.0706097104. [DOI] [PMC free article] [PubMed] [Google Scholar]
- 30.Honma K, Udono H, Kohno T, Yamamoto K, Ogawa A, Takemori T, Kumatori A, Suzuki S, Matsuyama T, Yui K. Interferon regulatory factor 4 negatively regulates the production of proinflammatory cytokines by macrophages in response to LPS. Proc Natl Acad Sci U S A. 2005;102:16001–16006. doi: 10.1073/pnas.0504226102. [DOI] [PMC free article] [PubMed] [Google Scholar]
- 31.Negishi H, Ohba Y, Yanai H, Takaoka A, Honma K, Yui K, Matsuyama T, Taniguchi T, Honda K. Negative regulation of Toll-like-receptor signaling by IRF-4. Proc Natl Acad Sci U S A. 2005;102:15989–15994. doi: 10.1073/pnas.0508327102. [DOI] [PMC free article] [PubMed] [Google Scholar]
- 32.Dong H, Zhu G, Tamada K, Flies DB, van Deursen JM, Chen L. B7-H1 determines accumulation and deletion of intrahepatic CD8(+) T lymphocytes. Immunity. 2004;20:327–336. doi: 10.1016/s1074-7613(04)00050-0. [DOI] [PubMed] [Google Scholar]
- 33.Castellaneta A, Di Leo A, Francavilla R, Margiotta M, Barone M, Amoruso A, Troiani L, Thomson AW, Francavilla A. Functional modification of CD11c(+) liver dendritic cells during liver regeneration after partial hepatectomy in mice. Hepatology. 2006;43:807–816. doi: 10.1002/hep.21098. [DOI] [PubMed] [Google Scholar]
- 34.Hisamatsu T, Suzuki M, Reinecker HC, Nadeau WJ, McCormick BA, Podolsky DK. CARD15/NOD2 functions as an antibacterial factor in human intestinal epithelial cells. Gastroenterology. 2003;124:993–1000. doi: 10.1053/gast.2003.50153. [DOI] [PubMed] [Google Scholar]
- 35.Tada H, Aiba S, Shibata K, Ohteki T, Takada H. Synergistic effect of Nod1 and Nod2 agonists with toll-like receptor agonists on human dendritic cells to generate interleukin-12 and T helper type 1 cells. Infect Immun. 2005;73:7967–7976. doi: 10.1128/IAI.73.12.7967-7976.2005. [DOI] [PMC free article] [PubMed] [Google Scholar]
- 36.Fritz JH, Girardin SE, Fitting C, Werts C, Mengin-Lecreulx D, Caroff M, Cavaillon JM, Philpott DJ, Adib-Conquy M. Synergistic stimulation of human monocytes and dendritic cells by Toll-like receptor 4 and NOD1- and NOD2-activating agonists. Eur J Immunol. 2005;35:2459–2470. doi: 10.1002/eji.200526286. [DOI] [PubMed] [Google Scholar]
- 37.Inohara N, Nunez G. NODs: intracellular proteins involved in inflammation and apoptosis. Nat Rev Immunol. 2003;3:371–382. doi: 10.1038/nri1086. [DOI] [PubMed] [Google Scholar]
- 38.Gutierrez O, Pipaon C, Inohara N, Fontalba A, Ogura Y, Prosper F, Nunez G, Fernandez-Luna JL. Induction of Nod2 in myelomonocytic and intestinal epithelial cells via nuclear factor-kappa B activation. J Biol Chem. 2002;277:41701–41705. doi: 10.1074/jbc.M206473200. [DOI] [PubMed] [Google Scholar]
- 39.Okazaki T, Honjo T. The PD-1-PD-L pathway in immunological tolerance. Trends Immunol. 2006;27:195–201. doi: 10.1016/j.it.2006.02.001. [DOI] [PubMed] [Google Scholar]
- 40.Latchman YE, Liang SC, Wu Y, Chernova T, Sobel RA, Klemm M, Kuchroo VK, Freeman GJ, Sharpe AH. PD-L1-deficient mice show that PD-L1 on T cells, antigen-presenting cells, and host tissues negatively regulates T cells. Proc Natl Acad Sci U S A. 2004;101:10691–10696. doi: 10.1073/pnas.0307252101. [DOI] [PMC free article] [PubMed] [Google Scholar]
- 41.Angelov GS, Tomkowiak M, Marcais A, Leverrier Y, Marvel J. Flt3 ligand-generated murine plasmacytoid and conventional dendritic cells differ in their capacity to prime naive CD8 T cells and to generate memory cells in vivo. J Immunol. 2005;175:189–195. doi: 10.4049/jimmunol.175.1.189. [DOI] [PubMed] [Google Scholar]
- 42.Shu SA, Lian ZX, Chuang YH, Yang GX, Moritoki Y, Comstock SS, Zhong RQ, Ansari AA, Liu YJ, Gershwin ME. The role of CD11c(+) hepatic dendritic cells in the induction of innate immune responses. Clin Exp Immunol. 2007;149:335–343. doi: 10.1111/j.1365-2249.2007.03419.x. [DOI] [PMC free article] [PubMed] [Google Scholar]
- 43.Reis e Sousa C. Toll-like receptors and dendritic cells: for whom the bug tolls. Semin Immunol. 2004;16:27–34. doi: 10.1016/j.smim.2003.10.004. [DOI] [PubMed] [Google Scholar]
- 44.Trinchieri G. Interleukin-12 and its role in the generation of TH1 cells. Immunol Today. 1993;14:335–338. doi: 10.1016/0167-5699(93)90230-I. [DOI] [PubMed] [Google Scholar]
- 45.Zucchini N, Bessou G, Robbins SH, Chasson L, Raper A, Crocker PR, Dalod M. Individual plasmacytoid dendritic cells are major contributors to the production of multiple innate cytokines in an organ-specific manner during viral infection. Int Immunol. 2008;20:45–56. doi: 10.1093/intimm/dxm119. [DOI] [PMC free article] [PubMed] [Google Scholar]
- 46.Doganci A, Eigenbrod T, Krug N, De Sanctis GT, Hausding M, Erpenbeck VJ, Haddad el B, Lehr HA, Schmitt E, Bopp T, Kallen KJ, Herz U, Schmitt S, Luft C, Hecht O, Hohlfeld JM, Ito H, Nishimoto N, Yoshizaki K, Kishimoto T, Rose-John S, Renz H, Neurath MF, Galle PR, Finotto S. The IL-6R alpha chain controls lung CD4+CD25+ Treg development and function during allergic airway inflammation in vivo. J Clin Invest. 2005;115:313–325. doi: 10.1172/JCI22433. [DOI] [PMC free article] [PubMed] [Google Scholar]
- 47.Crispe IN. The liver as a lymphoid organ. Annu Rev Immunol. 2009;27:147–163. doi: 10.1146/annurev.immunol.021908.132629. [DOI] [PubMed] [Google Scholar]
- 48.Mazariegos GV, Sindhi R, Thomson AW, Marcos A. Clinical tolerance following liver transplantation: long term results and future prospects. Transpl Immunol. 2007;17:114–119. doi: 10.1016/j.trim.2006.09.033. [DOI] [PubMed] [Google Scholar]
- 49.Benseler V, McCaughan GW, Schlitt HJ, Bishop GA, Bowen DG, Bertolino P. The liver: a special case in transplantation tolerance. Semin Liver Dis. 2007;27:194–213. doi: 10.1055/s-2007-979471. [DOI] [PubMed] [Google Scholar]
- 50.Li W, Chou ST, Wang C, Kuhr CS, Perkins JD. Role of the liver in peripheral tolerance: induction through oral antigen feeding. Am J Transplant. 2004;4:1574–1582. doi: 10.1111/j.1600-6143.2004.00551.x. [DOI] [PubMed] [Google Scholar]
- 51.Cantor HM, Dumont AE. Hepatic suppression of sensitization to antigen absorbed into the portal system. Nature. 1967;215:744–745. doi: 10.1038/215744a0. [DOI] [PubMed] [Google Scholar]
- 52.Calne RY, Sells RA, Pena JR, Davis DR, Millard PR, Herbertson BM, Binns RM, Davies DA. Induction of immunological tolerance by porcine liver allografts. Nature. 1969;223:472–476. doi: 10.1038/223472a0. [DOI] [PubMed] [Google Scholar]
- 53.Qian S, Demetris AJ, Murase N, Rao AS, Fung JJ, Starzl TE. Murine liver allograft transplantation: tolerance and donor cell chimerism. Hepatology. 1994;19:916–924. doi: 10.1002/hep.1840190418. [DOI] [PMC free article] [PubMed] [Google Scholar]
- 54.Rasmussen A, Davies HF, Jamieson NV, Evans DB, Calne RY. Combined transplantation of liver and kidney from the same donor protects the kidney from rejection and improves kidney graft survival. Transplantation. 1995;59:919–921. [PubMed] [Google Scholar]
- 55.Kotru A, Sheperd R, Nadler M, Chapman W, Huddleston C, Lowell J. Combined lung and liver transplantation: the United States experience. Transplantation. 2006;82:144–145. doi: 10.1097/01.tp.0000227923.85536.2f. author reply 145. [DOI] [PubMed] [Google Scholar]
- 56.Leroy V, Vigan I, Mosnier JF, Dufeu-Duchesne T, Pernollet M, Zarski JP, Marche PN, Jouvin-Marche E. Phenotypic and functional characterization of intrahepatic T lymphocytes during chronic hepatitis C. Hepatology. 2003;38:829–841. doi: 10.1053/jhep.2003.50410. [DOI] [PubMed] [Google Scholar]
- 57.Cooper S, Erickson AL, Adams EJ, Kansopon J, Weiner AJ, Chien DY, Houghton M, Parham P, Walker CM. Analysis of a successful immune response against hepatitis C virus. Immunity. 1999;10:439–449. doi: 10.1016/s1074-7613(00)80044-8. [DOI] [PubMed] [Google Scholar]
- 58.Vavricka SR, Musch MW, Chang JE, Nakagawa Y, Phanvijhitsiri K, Waypa TS, Merlin D, Schneewind O, Chang EB. hPepT1 transports muramyl dipeptide, activating NF-kappaB and stimulating IL-8 secretion in human colonic Caco2/bbe cells. Gastroenterology. 2004;127:1401–1409. doi: 10.1053/j.gastro.2004.07.024. [DOI] [PubMed] [Google Scholar]
- 59.Colonna M, Trinchieri G, Liu YJ. Plasmacytoid dendritic cells in immunity. Nat Immunol. 2004;5:1219–1226. doi: 10.1038/ni1141. [DOI] [PubMed] [Google Scholar]
- 60.Shortman K, Liu YJ. Mouse and human dendritic cell subtypes. Nat Rev Immunol. 2002;2:151–161. doi: 10.1038/nri746. [DOI] [PubMed] [Google Scholar]
- 61.Rissoan MC, Soumelis V, Kadowaki N, Grouard G, Briere F, de Waal Malefyt R, Liu YJ. Reciprocal control of T helper cell and dendritic cell differentiation. Science. 1999;283:1183–1186. doi: 10.1126/science.283.5405.1183. [DOI] [PubMed] [Google Scholar]
- 62.Ochando JC, Homma C, Yang Y, Hidalgo A, Garin A, Tacke F, Angeli V, Li Y, Boros P, Ding Y, Jessberger R, Trinchieri G, Lira SA, Randolph GJ, Bromberg JS. Alloantigen-presenting plasmacytoid dendritic cells mediate tolerance to vascularized grafts. Nat Immunol. 2006;7:652–662. doi: 10.1038/ni1333. [DOI] [PubMed] [Google Scholar]
- 63.Fugier-Vivier IJ, Rezzoug F, Huang Y, Graul-Layman AJ, Schanie CL, Xu H, Chilton PM, Ildstad ST. Plasmacytoid precursor dendritic cells facilitate allogeneic hematopoietic stem cell engraftment. J Exp Med. 2005;201:373–383. doi: 10.1084/jem.20041399. [DOI] [PMC free article] [PubMed] [Google Scholar]
- 64.Abe M, Wang Z, de Creus A, Thomson AW. Plasmacytoid dendritic cell precursors induce allogeneic T-cell hyporesponsiveness and prolong heart graft survival. Am J Transplant. 2005;5:1808–1819. doi: 10.1111/j.1600-6143.2005.00954.x. [DOI] [PubMed] [Google Scholar]
- 65.Fishbein T, Novitskiy G, Mishra L, Matsumoto C, Kaufman S, Goyal S, Shetty K, Johnson L, Lu A, Wang A, Hu F, Kallakury B, Lough D, Zasloff M. NOD2-expressing bone marrow-derived cells appear to regulate epithelial innate immunity of the transplanted human small intestine. Gut. 2008;57:323–330. doi: 10.1136/gut.2007.133322. [DOI] [PubMed] [Google Scholar]
- 66.Freeman GJ, Long AJ, Iwai Y, Bourque K, Chernova T, Nishimura H, Fitz LJ, Malenkovich N, Okazaki T, Byrne MC, Horton HF, Fouser L, Carter L, Ling V, Bowman MR, Carreno BM, Collins M, Wood CR, Honjo T. Engagement of the PD-1 immunoinhibitory receptor by a novel B7 family member leads to negative regulation of lymphocyte activation. J Exp Med. 2000;192:1027–1034. doi: 10.1084/jem.192.7.1027. [DOI] [PMC free article] [PubMed] [Google Scholar]
- 67.Gilliet M, Cao W, Liu YJ. Plasmacytoid dendritic cells: sensing nucleic acids in viral infection and autoimmune diseases. Nat Rev Immunol. 2008;8:594–606. doi: 10.1038/nri2358. [DOI] [PubMed] [Google Scholar]
Associated Data
This section collects any data citations, data availability statements, or supplementary materials included in this article.