

In general, the breast US computer-aided diagnosis system appears to be effective across different patient populations, but further investigation is warranted.
Abstract
Purpose:
To evaluate the robustness of a breast ultrasonographic (US) computer-aided diagnosis (CAD) system in terms of its performance across different patient populations.
Materials and Methods:
Three US databases were analyzed for this study: one South Korean and two United States databases. All three databases were utilized in an institutional review board–approved and HIPAA-compliant manner. Round-robin analysis and independent testing were performed to evaluate the performance of a computerized breast cancer classification scheme across the databases. Receiver operating characteristic (ROC) analysis was used to evaluate performance differences.
Results:
The round-robin analyses of each database demonstrated similar results, with areas under the ROC curve ranging from 0.88 (95% confidence interval [CI]: 0.820, 0.918) to 0.91 (95% CI: 0.86, 0.95). The independent testing of each database, however, indicated that although the performances were similar, the range in areas under the ROC curve (from 0.79 [95% CI: 0.730, 0.842] to 0.87 [95% CI: 0.794, 0.923]) was wider than that with the round-robin tests. However, the only instances in which statistically significant differences in performance were demonstrated occurred when the Korean database was used in a testing capacity in independent testing.
Conclusion:
The few observed statistically significant differences in performance indicated that while the US features used by the system were useful across the databases, their relative importance differed. In practice, this means that a CAD system may need to be adjusted when applied to a different population.
© RSNA, 2009
Introduction
Breast cancer continues to be the most common form of cancer and the second most common cause of death from cancer among women in the United States (1). While mammography is currently the only screening method recommended for the general population (2), there is still considerable research being conducted to augment the breast cancer diagnosis process. The utility of ultrasonography (US) in the evaluation of abnormalities within the breast has increased substantially over the past decade (3–5). Studies have shown breast US to have an accuracy of 96%–100% in the diagnosis of cysts (6), and its use in differentiating between different types of solid lesions (ie, benign vs malignant) is becoming more widespread (3–5,7). This increased interest in US as a diagnostic tool for breast cancer has led to rapid developments in the application of computer-aided diagnosis (CAD) to breast US (8).
The automated classification of breast lesions at US includes the computerized extraction of various lesion features and artificial intelligence techniques to classify the lesions in terms of malignancy. Features including shape, sharpness, texture, and shadowing are useful in computerized classification schemes (9), and CAD systems based on these features have been shown to perform the benign versus malignant classification task well (10–15). In an effort to translate breast US CAD into clinical practice, prior studies have investigated its robustness through different usage scenarios, including across different institutions, manufacturers, and protocols (16,17). However, there are other types of variability that may affect robustness. An inevitable but nontrivial difference in how a CAD system may be utilized is the population in which it is applied. Although a CAD algorithm may be calibrated by using a diverse database collected in the United States, for example, it is unlikely that the system will always be used in regions with similar patient population demographics. While it would be reasonable to assume that the performance of a CAD system trained with a large and diverse database would be relatively unaffected by natural patient population variation, it is nonetheless useful to investigate its robustness in such conditions (18).
In this work, we evaluated a breast US CAD system by using a database of patients with Korean ethnicity to determine if it maintained its previous “stand-alone” performance level from evaluations with United States databases (12,17,19).
Materials and Methods
Image Databases
Three independent US databases were utilized in this study. All of the databases were compiled in accordance with an institutional review board–approved protocol with informed consent and were maintained in a manner compliant with the Health Insurance Portability and Accountability Act. All of the images in each database were acquired by using the same model of US scanner (HDI 5000; Philips Medical Systems, Bothell, Wash) with a Philips L12-5 transducer, with an operating range of 12–5 MHz. The use of spatial compounding refers to the use of the scanner's SonoCT feature.
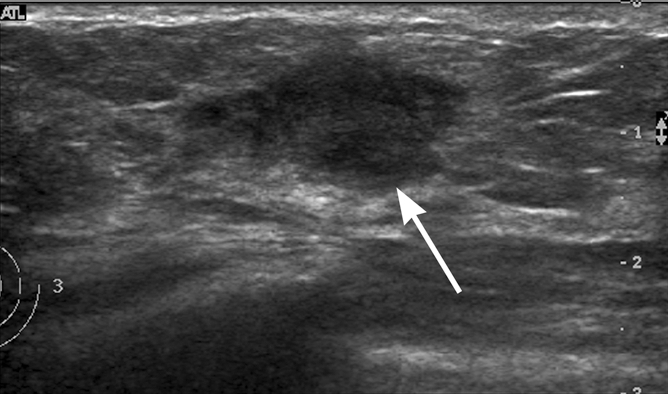
Two of the databases (Table 1) were obtained from a single clinical imaging site at the University of Chicago Medical Center (Chicago, Ill) during two nonoverlapping time periods. Each examination was performed by one of many fellowship-trained breast radiologists (C.A.S.) by using the breast US clinical imaging protocol established at the imaging site (Fig 1). This imaging protocol was developed in accordance with American College of Radiology guidelines. In United States database A, all of the lesions depicted were sampled for biopsy during clinical work-up to confirm their diagnosis. In United States database B, all of the malignant lesion diagnoses were verified with biopsy; however, for the benign and cystic lesions in database B, either the diagnoses were verified with biopsy or the lesions were deemed benign during the original clinical examination such that there was no further intervention (radiologic interpretation is often the final clinical work-up for some cysts and benign lesions, although biopsy is the preferred method of pathologic verification). Patients with lesions seen at US in whom the disease was not confirmed with biopsy were followed up for an average of 3 years (range, 2–4 years) to minimize the risk of including missed cancers as benign lesions in the analysis. The inclusion of nonbiopsied lesions was not believed to be an issue here as we were interested in the level of agreement between the CAD system and the diagnostic decision that would occur clinically. No case selection was performed at this clinical site; the only requirement for inclusion was patient consent.
Table 1.
Composition of US Databases
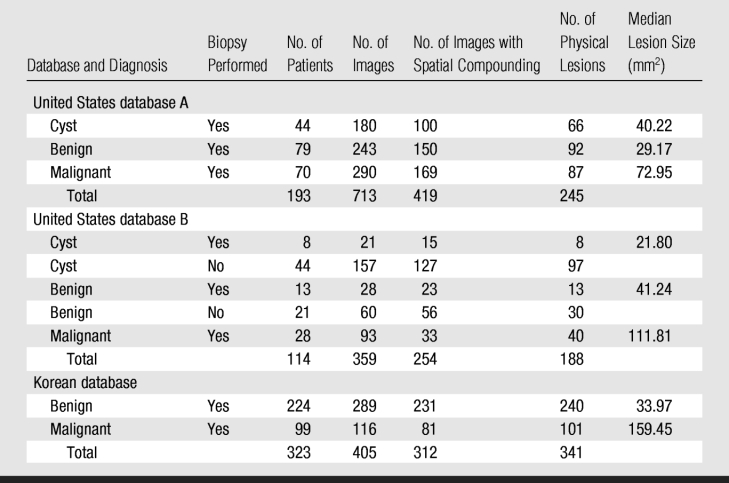
Figure 1a:

Examples of breast US images from databases used in this study. (a) Longitudinal image from United States site in 39-year-old woman shows a fibroadenoma (arrow). (b) Transverse image from United States site in 46-year-old woman shows an infiltrating ductal carcinoma (arrow). (c) Longitudinal image from Korean site in 43-year-old woman shows a fibroadenoma (arrow). (d) Transverse image from Korean site in 56-year-old woman shows an infiltrating ductal carcinoma (arrow).
Figure 1b:
Examples of breast US images from databases used in this study. (a) Longitudinal image from United States site in 39-year-old woman shows a fibroadenoma (arrow). (b) Transverse image from United States site in 46-year-old woman shows an infiltrating ductal carcinoma (arrow). (c) Longitudinal image from Korean site in 43-year-old woman shows a fibroadenoma (arrow). (d) Transverse image from Korean site in 56-year-old woman shows an infiltrating ductal carcinoma (arrow).
Figure 1c:

Examples of breast US images from databases used in this study. (a) Longitudinal image from United States site in 39-year-old woman shows a fibroadenoma (arrow). (b) Transverse image from United States site in 46-year-old woman shows an infiltrating ductal carcinoma (arrow). (c) Longitudinal image from Korean site in 43-year-old woman shows a fibroadenoma (arrow). (d) Transverse image from Korean site in 56-year-old woman shows an infiltrating ductal carcinoma (arrow).
Figure 1d:

Examples of breast US images from databases used in this study. (a) Longitudinal image from United States site in 39-year-old woman shows a fibroadenoma (arrow). (b) Transverse image from United States site in 46-year-old woman shows an infiltrating ductal carcinoma (arrow). (c) Longitudinal image from Korean site in 43-year-old woman shows a fibroadenoma (arrow). (d) Transverse image from Korean site in 56-year-old woman shows an infiltrating ductal carcinoma (arrow).
In general, the scanner operator saved several views (longitudinal, transverse, and oblique) of each lesion, and all were made available for the databases. United States database A was collected over a 25-month period between 2002 and 2004, and United States database B was collected over a nonoverlapping 18-month period between 2004 and 2006. The two databases had three patients in common; however, images of different physical lesions within those patients were recorded in each database. The mean age of the patients in United States database A was 51.6 years ± 12.8 (standard deviation), and the mean age of the patients in United States database B was 50.7 years ± 15.5 (Fig 2). Many of the lesions in the databases were depicted on multiple images, and some patients had multiple lesions. United States database A contained lesions from 193 women, with the number of lesions per woman ranging from one to five (mean, 1.3) and the number of images per lesion ranging from one to 20 (mean, 2.9). United States database B contained lesions from 114 women, with the number of lesions per person ranging from one to six (mean, 1.7) and the number of images per lesion ranging from one to six (mean, 1.9). The racial distribution across both databases was 45.0% African American (138 of 307), 25.7% white (79 of 307), 2.9% Asian (nine of 307), and 1.0% Hispanic (three of 307). Ethnic information was unavailable for the remaining 25.4% (78 of 307) of the women in the databases. Spatial compounding was used on 61.8% (202 of 327) of images depicting malignant lesions, 71.1% (229 of 322) of images depicting benign lesions, and 74.5% (242 of 325) of images depicting cystic lesions. For 98 images, we were unable to determine a posteriori whether spatial compounding was used.
Figure 2:

Histogram shows distribution of patient ages for the lesions in the Korean and United States databases.
The third US database (Table 1) was obtained from a single clinical imaging site in South Korea (Seoul National University Hospital, Seoul, South Korea). Each US examination was performed by using the same clinical imaging protocol established at the imaging site by one of many breast radiologists (W.K.M.) with more than 13 years of experience (Fig 1). This imaging protocol was developed in accordance with American College of Radiology guidelines. All of the lesions depicted in the Korean database were sampled for biopsy during clinical work-up to confirm their diagnosis. All of the lesions represented consecutive clinical cases collected between 2002 and 2004 that were seen as solid masses at US and were scheduled for US-guided biopsy. Two orthogonal images from each case were selected for inclusion in the database by the scanner operator (some cases had only one image because images with measurement cursors were excluded by the operator). Lesions seen only as calcifications were excluded, and two examinations that were deemed to be of poor image quality were excluded. Additionally, 55 images were removed from the database because of the presence of artifacts resulting from lossy image compression (reducing the total number of images to 405 [Table 1]). The remaining images contained only minor image compression–related artifacts and were of acceptable quality; these artifacts are believed to be the result of the method of image archiving used at the clinical imaging site (note that these artifacts refer to lossy image compression methods and not to artifacts from scanning compression of breast tissue). The mean age of patients in the Korean database was 45.4 years ± 9.8 (Fig 2). Some of the lesions in the database were depicted on multiple images, and some patients had multiple lesions. The Korean database contained lesions from 323 women, with the number of lesions per person ranging from one to two (mean, 1.0) and the number of images per lesion ranging from one to two (mean, 1.4). Spatial compounding was used on 69.8% (81 of 116) of images depicting malignant lesions and 79.9% (231 of 289) of images depicting benign lesions.
For this study, every lesion was reviewed by a single breast radiologist (C.A.S., with more than 18 years of experience and certification according to the Mammography Quality Standards Act). The lesions were grouped by database, and the radiologist was indirectly aware that the Korean database was collected at a different clinical site from the United States databases. Within each database, the lesions were reviewed randomly. The radiologist outlined each lesion to provide the “true” lesion margins. The center of mass of each radiologist outline was used as the seed point for performing automatic lesion segmentation (20), and these automatically generated outlines were utilized by the CAD scheme. It is important to note that in this study we were not investigating lesion detection methods, but rather the variability in the classification method across different patient populations given an identified lesion.
CAD Method
The following four unique mathematic descriptors (features) were extracted from each lesion after automatic segmentation was performed: the depth-to-width ratio, the radial gradient index, the maximum side difference, and the autocorrelation value (9,21). The depth-to-width ratio (“shape”) of the lesion provides a measure of its size and shape, the radial gradient index (“sharpness”) provides a measure of its shape and margin sharpness, the maximum side difference (“shadowing”) provides a description of its posterior acoustic behavior (the amount of shadowing or enhancement), and the autocorrelation value (“texture”) provides a measure of its texture and size. These features have been shown to be useful in US breast lesion diagnosis and are used by radiologists during the conventional clinical interpretation process (3,5,22). Features extracted from different images that depicted the same physical lesion were averaged together to provide a single set of features for each lesion (ie, analysis was performed on a per-lesion basis, not a per-image basis). This is similar to the CAD method used in prior robustness studies (16). The extracted features were then input into a Bayesian artificial neural network–based classifier with five hidden units (23). The classifier provided an estimated probability of malignancy for the lesion of interest as its output. This probability ranged between 0 and 1, with 0 representing the lowest likelihood of malignancy with respect to the lesion distribution and cancer prevalence with which the Bayesian neural network was trained and 1 representing the highest.
Statistical Analysis
The performance of the CAD scheme was assessed by using all three databases. The United States databases were assessed as separate databases, as well as a combined, single database.
The diagnostic performance of each US feature was assessed individually for the Korean and combined United States databases. The assessments were made on a per-lesion basis. The Mann-Whitney U test was used to assess the differences between the median lesion sizes in the databases (24). Because the Korean database did not contain any cystic lesions, cysts were removed from the combined United States database in further analysis to allow for a more direct comparison and to determine their impact on the performance of the features. A post-hoc analysis of the effect that spatial compounding may have on feature performance was also performed. The performance of the Bayesian neural network classifier across all of the different databases was assessed by using two analysis methods. First, separate round-robin analyses (also called leave-one-case-out analyses, where a “case” is a physical lesion in this study) were performed for each database. Second, independent testing was performed by using the two patient populations. In independent testing, one entire database was used to train the classifier, while a separate independent database was used as a test data set. This method of testing better simulated the real-world use of the CAD system. All of the databases were used in both training and testing capacities for the independent tests (eg, the Korean database was used for training while United States database A was used for testing and vice versa).
In addition, one-to-one age matching was performed with the Korean and combined United States databases by randomly selecting cases from the database with the larger population from each age group (bin size of each age group, 5 years). The original cancer prevalence rate for each database was maintained. Round-robin analysis and independent testing were performed on the Bayesian neural network by using the age-matched databases (number of lesions per database, 298).
Receiver operating characteristic (ROC) analysis was used to evaluate the performance of each US feature, as well as to evaluate the classifier's performance (25) and to assess the statistical significance of perceived differences therein (26–29). A software package (Proproc; Department of Radiology, University of Chicago, Chicago, Ill) was used to generate ROC curves for each test (30) and to calculate the nonparametric Wilcoxon estimate of the area under the ROC curve (AUC). Confidence intervals were calculated and comparisons of the AUCs were performed by using a different software package (Rockit; Department of Radiology, University of Chicago). Significance testing was corrected for multiple comparisons by using the Holm-Bonferroni method (24).
Results
The difference in median lesion size (86.50 mm2) (Table 1) between the malignant lesions in the Korean database and those in United States database A was statistically significant (P < .001), as was the difference (47.64 mm2) between the malignant lesions in the Korean database and those in United States database B (P < .001). The median lesion size difference (8.93 mm2) was also significant (P = .014) between the benign lesions in the Korean database and the benign and cystic lesions in United States database B. However, there was no significant difference in median size between the benign and cystic lesions in the Korean database and those in United States database A (difference in median size, 0.92 mm2; P = .435).
The performances of the individual US features in terms of AUC for the Korean and combined United States databases (Table 2, Fig 3) were similar, and most performance differences failed to demonstrate statistical significance. The shape and texture features achieved similar performance in both databases. The sharpness and shadowing features, however, showed markedly lower performance in the Korean database. The results of the analysis without cysts (Fig 3c) indicated that the presence of cysts in the combined United States database may explain the difference in the performance of the sharpness feature between the Korean and the United States databases, but the presence of cysts did not appear to account for all of the difference in the performance of the shadowing feature. The post-hoc analysis of the use of spatial compounding failed to demonstrate a statistically significant difference when the performance of any of the features in lesions imaged with spatial compounding turned on was compared with that in lesions imaged with spatial compounding turned off (Table 3).
Table 2.
Results of Comparison of Performance of Individual Features between Korean and United States Databases

Note.—Data are AUCs, with two-sided asymmetric 95% confidence intervals in parentheses.
* Two sided and corrected for multiple comparisons.
† Statistically significant at the 5% level.
Figure 3a:

Graphs show ROC curves of the performances of individual US features for (a) the Korean database (341 lesions), (b) the combined United States database (433 lesions), and (c) the combined United States database with cystic lesions removed (262 lesions).
Figure 3b:

Graphs show ROC curves of the performances of individual US features for (a) the Korean database (341 lesions), (b) the combined United States database (433 lesions), and (c) the combined United States database with cystic lesions removed (262 lesions).
Figure 3c:

Graphs show ROC curves of the performances of individual US features for (a) the Korean database (341 lesions), (b) the combined United States database (433 lesions), and (c) the combined United States database with cystic lesions removed (262 lesions).
Table 3.
Results of Comparison of Performance of Individual Features with and without Use of Spatial Compounding in Korean and United States Databases

* Data in parentheses are two-sided asymmetric 95% confidence intervals.
† Two sided and corrected for multiple comparisons.
The results of the round-robin analysis using the Bayesian neural network classifier for each database (Table 4) demonstrated AUC values that were very similar (ranging from 0.88 to 0.91). This indicates that the performance of the CAD system was relatively stable within a particular database. The results of the independent test analysis of each database (Table 4), however, indicated that although the AUC values for each test were similar, the range of AUC values (0.79–0.87) was larger than that for the round-robin tests. The age-matched round-robin and independent test analyses likewise demonstrated similar results (Table 4). The ROC curves for all of the analyses (round robin and independent testing) further illustrated these differences (Fig 4). Most of the performance comparisons between the databases (Table 5) failed to demonstrate a statistically significant difference in CAD system performance; this included the age-matched comparisons (P = .910 for Korean database round robin vs combined United States database round robin and P = .100 for Korean database independent testing vs combined United States database independent testing). When the Korean database was used in a testing capacity in an independent test, however, the AUCs of the test tended to be lower (0.82, 0.79, and 0.80), and some differences in performance were statistically significant when round-robin results were compared with independent test results (P < .001, P < .001, and P < .001, respectively, for the three Korean database independent testing vs Korean round-robin comparisons).
Table 4.
Results of Performance Analyses for Korean and United States Databases

* Data in parentheses are two-sided asymmetric 95% confidence intervals.
Figure 4a:

Graphs show ROC curves generated by independent testing (IT) and round-robin (RR) analysis of (a) the Korean and combined United States (USA-C) databases and (b) the age-matched Korean and combined United States databases. The database used for training (Train) and the database used for testing (Test) in the independent testing analyses are indicated.
Figure 4b:

Graphs show ROC curves generated by independent testing (IT) and round-robin (RR) analysis of (a) the Korean and combined United States (USA-C) databases and (b) the age-matched Korean and combined United States databases. The database used for training (Train) and the database used for testing (Test) in the independent testing analyses are indicated.
Table 5.
Differences in CAD System Performance between Korean and United States Databases

* In each comparison, a result from an independent test is marked with the database that was used for testing (eg, “United States database B IT” indicates an independent test in which the classifier was trained with the Korean database and tested with United States database B). IT = independent test, RR = round robin.
† AUC 1 is the AUC of the first analysis, and AUC 2 is the AUC of the second analysis.
‡ Data in parentheses are two-sided asymmetric 95% confidence intervals.
§ Two sided and corrected for multiple comparisons.
∥ Statistically significant at the 5% level.
Discussion
The results of the lesion feature analyses demonstrated some disparities in feature performance between the databases, particularly the performance of the shadowing feature, which appears less important in the Korean database but more important in the United States databases. The poor performance of this feature may be the result of general image quality differences; however, we believe the result is still relevant, as these image quality differences may be the result of the standard imaging protocols within each population and are therefore inherent to the population. The poor performance of this feature may also be related to differences in population breast density, as it has been noted that the Asian population has higher than average radiographic breast tissue density (31,32), and tissue density can affect the amount of shadowing (or enhancement) that occurs with exposure to an acoustic beam. A consistently higher level of tissue density within a population, for example, may make the shadowing feature less useful because the base level of attenuation for all patients would increase, making the shadowing more subtle. Differences in imaging protocols between the patient populations may also impact the effectiveness of the features. The imaging methods employed in the Korean database may suppress shadowing through selective use of spatial compounding techniques, as spatial compounding tended to be used more often in the Korean database (for 69.8% of images depicting malignant lesions vs 61.8% in the United States databases). The post-hoc analysis of the effect of spatial compounding, however, indicated that it is not likely to be solely responsible for the differences in the performance of the features. Additionally, differences between the breast cancer screening programs of the two populations may alter the segment of each population that undergoes breast US. These demographic differences may affect the performance of the features within each population by changing their relative importance. This may be responsible for the larger number of younger women in the Korean database, which in turn may have created a disparity in the number of pre- and postmenopausal women in each database. While menopausal status may have the potential to affect certain breast features, we believe that, from the standpoint of system robustness, the age distribution of each database is intrinsic to its population. A more direct study of these particular results may be useful to better understand the effect that factors like tissue density and/or imaging protocols may have on the US features used in breast US CAD.
Although some of the features demonstrated differences in performance, the CAD system performed well across the United States and Korean databases. The round-robin analyses of the databases demonstrated AUC values ranging from 0.88 to 0.91, which are reasonable when compared with those of prior studies (10,11). The AUC values obtained in the independent testing of the databases, however, were lower (0.79–0.87), especially when the Korean database was used in a testing capacity. The differences in classification performance are likely related to the feature performance differences. Additionally, the malignant lesions in the Korean database tended to be larger than the malignant lesions in the United States databases, indicating that the cancers in the Korean database may have been relatively more aggressive. This could potentially affect the performance of the CAD system by causing it to favor the types of cancer with which it was trained, as higher-grade cancers may be less likely to exhibit posterior acoustic shadowing and are more likely to have well-defined margins.
Instances in which the performance differences were statistically significant were generally limited to comparisons of round-robin results with independent test results. This is not unexpected, as independent tests are more rigorous, and we believe that they should be an important part of any CAD robustness analysis. Because the comparisons relating round-robin performance to independent test performance are considered to be the most useful evaluations (as they are more indicative of real-world use), however, these results raise concern. Therefore, although several of the comparisons failed to demonstrate a statistically significant difference in performance between the databases, a definitive, conservative conclusion of robustness across United States and Korean patient populations (with regard to the classifier) cannot be made at this time.
There were limitations in this study. The sizes of the databases, while adequate, were relatively small and prohibited definitive conclusions based solely on population, especially because ethnic information was unavailable for a large number of cases in the United States databases. Larger and more detailed databases would be necessary to enable one to draw specific conclusions on classifier performance between specific ethnic populations. The absence of tumor grades also limits the generality of the conclusions and potentially biased the performance of the system. Differences in scanning techniques between the databases can also be viewed as a limitation in the strictest sense; however, we believe that from a standpoint of robustness, scanning techniques can be considered a factor related to the imaging site. Differences in image quality and the presence of lossy image compression artifacts can be viewed as limitations in a similar sense. The selection of images differed for each database as well (the scanner operator selected which images of each lesion to include in the Korean database, whereas all images of each lesion were included in the United States databases), which may have introduced some bias into the databases. This bias is likely minor, as previous studies have demonstrated that the performance of this CAD system is robust given variations in image selection protocols (16). Finally, although previous studies have demonstrated that multiple images of the same lesion are not strictly necessary for the CAD scheme used here (16), the differences in the number of images available per lesion limited the amount of information available for each lesion. Similarly, our previous study (16) indicated that the performance of this CAD system is robust given variations in the number of images available per lesion; therefore, any bias resulting from differences in the amount of images available per lesion between the different databases is likely minor as well.
In general, the breast US CAD system appears to be effective across different patient populations, but further investigation is warranted. The statistically significant difference between the AUC values of the different independent tests, along with the similarity of the round-robin AUC values, indicate that while the US features used by the system are useful across the databases, their relative importance differs (ie, the usefulness of some features may differ for different populations). These results may be due to differences in scanning protocols and techniques or may be related to intrinsic population differences. In practice, this means that a CAD system may need to be fine tuned—that is, retrained—when applied to a different population. This fine tuning could involve training the classifier with population-specific databases, which may help match the training of the Bayesian neural network with the clinical cases it is being used on. It could also involve the use of new and different classifiers. This work motivates the future exploration of optimal feature sets to improve the overall performance of the CAD system as well. The range of the different performance values (0.79–0.91) appears acceptable, however, when compared with results of previous stand-alone breast US CAD studies (9–12), in which performances ranged from 0.81 to 0.91. It is also worth noting that the lower performance values are not necessarily detrimental if there is some disparity between the lesions that the CAD system assesses accurately and the lesions that its user assesses accurately. Thus, if the computer is accurate on lesions incorrectly classified by the user and vice versa, the system may still be considered useful. Again, demonstration of this conclusion would require further investigation. Overall, the performance of the system appeared to be relatively consistent (with the exceptions noted above). This is important, as it advances the clinical translation process by demonstrating that the system can be operated in different environments. It also highlights the importance of evaluating CAD systems by using different patient populations in order to demonstrate robustness and of using methods like independent testing to obtain performance measurements in more real-world conditions.
Advances in Knowledge.
Evaluation of a breast US computer-aided diagnosis (CAD) system in cases from different patient populations demonstrated similarities (eg, the similar performance of the texture and shape features in all databases) and differences (eg, the markedly lower performance of the shadowing feature in the Korean database) in the performance of the system.
Differences in population demographics or imaging protocols may have an impact on the usefulness of some US features and/or CAD system performance.
Implications for Patient Care.
The evaluation of CAD systems in different patient populations prior to clinical use may be necessary to confirm robustness.
Differences in patient population demographics or regional imaging protocols may have an effect on the performance of some breast US CAD systems.
Received February 13, 2009; revision requested April 2; revision received May 12; accepted June 5; final version accepted June 22.
M.L.G. is a stockholder in and receives royalties and research funding from R2 Technology/Hologic (Sunnyvale, Calif).
Funding: This research was supported by the National Institutes of Health (grants R01-CA89452, R21-CA113800, and P50-CA125183).
Abbreviations:
- AUC
- area under the ROC curve
- CAD
- computer-aided diagnosis
- ROC
- receiver operating characteristic
References
- 1.Jemal A, Thun MJ, Ries LAG, et al. Annual report to the nation on the status of cancer, 1975–2005, featuring trends in lung cancer, tobacco use, and tobacco control. J Natl Cancer Inst 2008;100:1672–1694 [DOI] [PMC free article] [PubMed] [Google Scholar]
- 2.Elmore JG, Armstrong K, Lehman CD, Fletcher SW. Screening for breast cancer. JAMA 2005;293:1245–1256 [DOI] [PMC free article] [PubMed] [Google Scholar]
- 3.Fine RE, Staren ED. Updates in breast ultrasound. Surg Clin North Am 2004;84:1001–1034, v–vi [DOI] [PubMed] [Google Scholar]
- 4.Berg WA, Gutierrez L, NessAiver MS, et al. Diagnostic accuracy of mammography, clinical examination, US, and MR imaging in preoperative assessment of breast cancer. Radiology 2004;233:830–849 [DOI] [PubMed] [Google Scholar]
- 5.Berg WA, Blume JD, Cormack JB, Mendelson EB, Madsen EL. Lesion detection and characterization in a breast US phantom: results of the ACRIN 6666 Investigators. Radiology 2006;239:693–702 [DOI] [PubMed] [Google Scholar]
- 6.Jackson VP. The role of US in breast imaging. Radiology 1990;177:305–311 [DOI] [PubMed] [Google Scholar]
- 7.Sickles EA. Breast imaging: from 1965 to the present. Radiology 2000;215:1–16 [DOI] [PubMed] [Google Scholar]
- 8.Weinstein SP, Conant EF, Sehgal C. Technical advances in breast ultrasound imaging. Semin Ultrasound CT MR 2006;27:273–283 [DOI] [PubMed] [Google Scholar]
- 9.Horsch K, Giger ML, Venta LA, Vyborny CJ. Computerized diagnosis of breast lesions on ultrasound. Med Phys 2002;29:157–164 [DOI] [PubMed] [Google Scholar]
- 10.Horsch K, Giger ML, Vyborny CJ, Venta LA. Performance of computer-aided diagnosis in the interpretation of lesions on breast sonography. Acad Radiol 2004;11:272–280 [DOI] [PubMed] [Google Scholar]
- 11.Horsch K, Giger ML, Vyborny CJ, Lan L, Mendelson EB, Hendrick RE. Classification of breast lesions with multimodality computer-aided diagnosis: observer study results on an independent clinical data set. Radiology 2006;240:357–368 [DOI] [PubMed] [Google Scholar]
- 12.Drukker K, Gruszauskas NP, Sennett CA, Giger ML. Breast US computer-aided diagnosis workstation: performance with a large clinical diagnostic population. Radiology 2008;248:392–397 [DOI] [PMC free article] [PubMed] [Google Scholar]
- 13.Chen CM, Chou YH, Han KC, et al. Breast lesions on sonograms: computer-aided diagnosis with nearly setting-independent features and artificial neural networks. Radiology 2003;226:504–514 [DOI] [PubMed] [Google Scholar]
- 14.Chen DR, Chang RF, Kuo WJ, Chen MC, Huang YL. Diagnosis of breast tumors with sonographic texture analysis using wavelet transform and neural networks. Ultrasound Med Biol 2002;28:1301–1310 [DOI] [PubMed] [Google Scholar]
- 15.Joo S, Yang YS, Moon WK, Kim HC. Computer-aided diagnosis of solid breast nodules: use of an artificial neural network based on multiple sonographic features. IEEE Trans Med Imaging 2004;23:1292–1300 [DOI] [PubMed] [Google Scholar]
- 16.Gruszauskas NP, Drukker K, Giger ML, Sennett CA, Pesce LL. Performance of breast ultrasound computer-aided diagnosis: dependence on image selection. Acad Radiol 2008;15:1234–1245 [DOI] [PMC free article] [PubMed] [Google Scholar]
- 17.Drukker K, Giger ML, Metz CE. Robustness of computerized lesion detection and classification scheme across different breast US platforms. Radiology 2005;237:834–840 [DOI] [PubMed] [Google Scholar]
- 18.Summers RM, Handwerker LR, Pickhardt PJ, et al. Performance of a previously validated CT colonography computer-aided detection system in a new patient population. AJR Am J Roentgenol 2008;191:168–174 [DOI] [PubMed] [Google Scholar]
- 19.Drukker K, Giger ML, Vyborny CJ, Mendelson EB. Computerized detection and classification of cancer on breast ultrasound. Acad Radiol 2004;11:526–535 [DOI] [PubMed] [Google Scholar]
- 20.Horsch K, Giger ML, Venta LA, Vyborny CJ. Automatic segmentation of breast lesions on ultrasound. Med Phys 2001;28:1652–1659 [DOI] [PubMed] [Google Scholar]
- 21.Kupinski MA, Giger ML. Automated seeded lesion segmentation on digital mammograms. IEEE Trans Med Imaging 1998;17:510–517 [DOI] [PubMed] [Google Scholar]
- 22.Madjar H, Jellins J. The practice of breast ultrasound: techniques, findings, differential diagnosis Stuttgart, NY: Thieme Medical Publishers, 2000 [Google Scholar]
- 23.Kupinski MA, Edwards DC, Giger ML, Metz CE. Ideal observer approximation using Bayesian classification neural networks. IEEE Trans Med Imaging 2001;20:886–899 [DOI] [PubMed] [Google Scholar]
- 24.Glantz SA. Primer of biostatistics 6th ed New York, NY: McGraw-Hill Medical, 2005 [Google Scholar]
- 25.Obuchowski NA. Receiver operating characteristic curves and their use in radiology. Radiology 2003;229:3–8 [DOI] [PubMed] [Google Scholar]
- 26.Metz CE. Basic principles of ROC analysis. Semin Nucl Med 1978;8:283–298 [DOI] [PubMed] [Google Scholar]
- 27.Metz CE. ROC methodology in radiologic imaging. Invest Radiol 1986;21:720–733 [DOI] [PubMed] [Google Scholar]
- 28.Metz CE. Receiver operating characteristic analysis: a tool for the quantitative evaluation of observer performance and imaging systems. J Am Coll Radiol 2006;3:413–422 [DOI] [PubMed] [Google Scholar]
- 29.Metz CE, Herman BA, Roe CA. Statistical comparison of two ROC-curve estimates obtained from partially-paired datasets. Med Decis Making 1998;18:110–121 [DOI] [PubMed] [Google Scholar]
- 30.Pesce LL, Metz CE. Reliable and computationally efficient maximum-likelihood estimation of “proper” binormal ROC curves. Acad Radiol 2007;14:814–829 [DOI] [PMC free article] [PubMed] [Google Scholar]
- 31.del Carmen MG, Halpern EF, Kopans DB, et al. Mammographic breast density and race. AJR Am J Roentgenol 2007;188:1147–1150 [DOI] [PubMed] [Google Scholar]
- 32.Habel LA, Capra AM, Oestreicher N, et al. Mammographic density in a multiethnic cohort. Menopause 2007;14:891–899 [DOI] [PubMed] [Google Scholar]