

Abstract
Activation of discoidin domain receptor (DDR) 1 by collagen is reported to regulate cell migration and survival processes. While the oligomeric state of DDR1 is reported to play a significant role in collagen binding, not much is known about the effect of collagen binding on DDR1 oligomerization and cellular distribution. Using fluorescence resonance energy transfer (FRET) microscopy, we monitored the interaction between DDR1 tagged with cyan fluorescent protein and DDR1 tagged with yellow fluorescent protein in live cells. Significant FRET signal indicative of receptor dimerization was found even in the absence of collagen stimulation. Collagen stimulation induced aggregation of DDR1, followed by a sharp increase in FRET signal, localized in the regions of aggregated receptor. Further analysis of DDR1 aggregation revealed that DDR1 undergoes cytoplasmic internalization and incorporation into the early endosome. We found the kinetics of DDR1 internalization to be fast, with a significant percentage of the receptor population being internalized in the first few minutes of collagen stimulation. Our results indicate that collagen stimulation induces the aggregation and internalization of DDR1 dimers at timescales much before receptor activation. These findings provide new insights into the cellular redistribution of DDR1 following its interaction with collagen type I.
Keywords: DDR1, oligomerization, FRET, collagen, internalization
Introduction
Discoidin domain receptors (DDRs) are receptor tyrosine kinases (RTKs) that bind to and get activated by collagen(s), the major component of the extracellular matrix.1,2 There are two known members of the DDR family, namely, DDR1 and DDR2, both distinguished from other RTKs by the presence of an extracellular discoidin domain (ECD) and an unusually long juxtamembrane region. DDR1 and DDR2 are coded by separate genes.
Of the two receptors, DDR1 is widely expressed in mammalian tissues3,4 and over-expressed in several malignancies such as breast, colon, ovarian, and lung cancers.5–8 DDR1 is reported to play a crucial role in a variety of human diseases such as pulmonary fibrosis,9 pituitary adenoma,10 congestive heart failure,11 atherosclerosis,4 and lymphangioleiomyomatosis.12 Little is understood about the intracellular signaling associated with DDR1 activation. DDR1 is known to be involved in critical cellular migration and survival processes.13,14 Prolonged activation of DDR1 is known to upregulate matrix metalloproteases 1, 2, and 9, which cleave the extracellular matrix.12,15
DDRs have an unusually slow activation process compared to other RTKs and require hours, rather than minutes, to achieve ligand-induced tyrosine phosphorylation. Mutagenetic analysis of DDR1 binding to collagen16 showed that while epitopes present on its discoidin domain affect both the binding of the receptor to collagen and its activation, the effects are not always directly correlated. Mutation on the residue Pro158 decreased collagen binding affinity, with no effect on receptor phosphorylation. Mutations on two residues, Arg179 and Glu181, were shown to increase collagen binding affinity and, at the same time, to decrease receptor phosphorylation. Thus, not much is known about the DDR1 activation mechanism, specifically if other cellular interactions besides collagen binding are required for this receptor phosphorylation.
The role of DDR1 oligomerization in ligand binding and subsequent phosphorylation, although considered important, is only partly understood. In vitro work by us17 and others18 revealed that high-affinity interaction with collagen requires dimerization and/or oligomerization of DDR1. Two independent reports19,20 showed that a significant percentage of the DDR1 population forms ligand-independent dimers, which is not changed upon collagen stimulation. A recent study19 demonstrated that a leucine zipper motif in the transmembrane domain of DDR1 is critical for receptor activation, but not for receptor dimerization. Therefore, the distribution and oligomeric state of DDR1 on the cell surface, its modulation upon collagen interaction, and its role in receptor activation remain to be characterized.
In this study, we aimed to examine the oligomeric state and distribution of DDR1 in live cells before and after stimulation with its ligand collagen type 1. By using recombinant DDR1 tagged with variants of the green fluorescent protein (GFP) and fluorescence resonance energy transfer (FRET) microscopy, we could map intermolecular interactions between the fluorescently tagged receptors on the entire cell surface. Live cell imaging and colocalization experiments, as well as biochemical methods such as SDS-PAGE, were used to study collagen-induced trafficking of DDR1 receptor. Our results generate new insights into the interaction of DDR1 with its ligand collagen, and its possible role in the initiation of DDR1 activation and downstream signaling.
Results
Yellow-fluorescent-protein- and cyan-fluorescent-protein-tagged DDR1 receptors undergo collagen-induced phosphorylation
To study DDR1 distribution and oligomeric state in the plasma membrane, we generated mammalian expression constructs for DDR1–yellow fluorescent protein (YFP) or DDR1–cyan fluorescent protein (CFP) fusion proteins (Fig. 1a). These DDR1–YFP proteins exhibited a molecular mass higher than the molecular mass (120 kDa) of native DDR1. To verify that our DDR1 fusion proteins underwent collagen-induced receptor activation similarly to the native DDR1, we detected the phosphorylation of DDR1–YFP(s) upon collagen stimulation using immunoprecipitation, SDS-PAGE, and Western blot analysis. As shown in Fig. 1b, collagen-stimulated DDR1–YFP (and CFP; data not shown) samples showed increased phosphorylation levels as compared to their nonstimulated counterparts. The level of DDR1–YFP in each lane was evaluated by reprobing the blots with anti-DDR1 antibody (Fig. 1b).
Fig. 1.

The fluorescent DDR1 constructs are functional. (a) Schematic representation of the DDR1–YFP fusion proteins. (b) HEK293 cells, native or transiently transfected with DDR1–YFP, were stimulated with 10 μg/ml collagen type I for 90 min (as indicated), and cell lysates were imunoprecipitated with anti-DDR1 antibodies. Following SDS-PAGE and Western blot analysis, the membranes were probed with anti-phosphotyrosine antibodies (upper blot) or anti-DDR1 antibodies (lower blot). Collagen stimulation increases the phosphorylation level of fluorescently labeled DDRs.
DDR1 exists as a dimer even before collagen binding
Using FRET microscopy, we studied the oligome-ric state of DDR1 in a transiently transfected live mouse osteoblast cell line (E1-3T3). Extensive cell spreading and the associated low height profile of these cells17,21 generated images with a uniform distribution of transiently transfected DDR1–YFPs across the cell surface (Fig. 2). FRET experiments were performed using a sensitized acceptor setup. Cells transiently transfected with either DDR1–YFP or DDR1–CFP alone were used to determine the bleedthrough constants a, b, c, and d according to Eq. (1). Next, cells cotransfected with both DDR1–CFP and DDR1–YFP were imaged live using wide-field fluorescence microscopy. The level of expression for both constructs varied substantially from cell to cell even in the same sample. In our analysis, we used a FRET index (FC/A) that is obtained by normalizing the corrected FRET signal (FC) to the acceptor level (A).
Fig. 2.
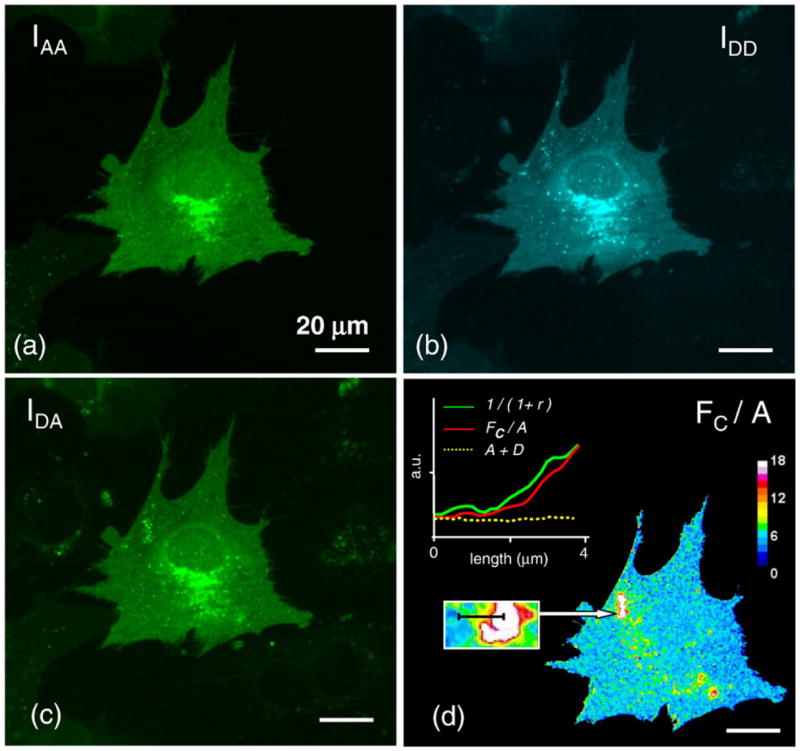
FRET analysis of DDR1 dimerization. 3T3 cells transiently transfected with both DDR1–YFP and DDR1–CFP were imaged live. For the same region, images were acquired sequentially in the IAA, IDD, and IDA channels (a–c); the corrected and normalized FRET signal FC/A is displayed in pseudocolor (d). Positive FRET signal indicative of dimmer formation is recorded over the entire cell surface. Regions that display higher signal intensities were found to be associated with variations in the acceptor–donor ratio (r). (Inset, d) For such a selected ROI, the FRET index, receptor levels, and 1/(1+r) values were plotted alongside. All scale bars represent 20 μm.
Samples that were not stimulated with collagen were found to exhibit positive FRET values (Fig. 2), demonstrating that donor-labeled DDR1 (DDR1-CFP) and acceptor-labeled DDR1 (DDR1-YFP) come in close proximity (~less than 100 Å) indicative of dimer formation. Mapping of the FRET index over the entire cell surface showed that the DDR1 FRET pairs are, for the most part, homogeneously distributed, with some regions exhibiting higher FRET index values. Regions that exhibited FRET values above the average were found to be associated with unusually high A/D ratios (r), but not with a higher receptor density (A+D) (Fig. 2d). As expected (Eq. (11); Materials and Methods), the FRET index was found to increase with 1/(1+r).
Furthermore, we found that the FRET index values were independent of receptor density at a constant r (Fig. 3). Although we could not ascertain the transfer efficiency and the number of acceptor–donor dimers (Nad), the dependence of the FRET index on the A/D ratio and the independence of the receptor levels indicate that the detected FRET signal is reflective of true oligomerization, as opposed to random aggregation.22 Taken together, our FRET analysis of nonstimulated cells suggests that at least part of the DDR1 population exists as stable dimers prior to collagen binding.
Fig. 3.
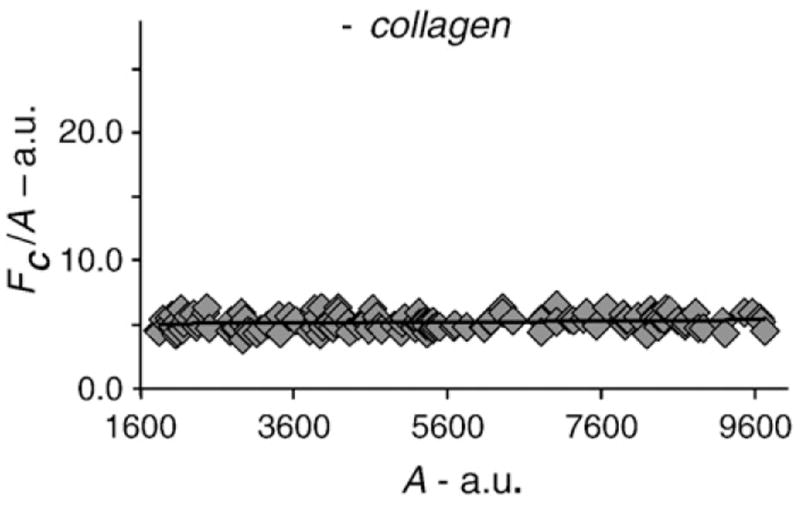
The FRET index was plotted against the acceptor levels for nonstimulated samples. All data points (ROIs) included have similar A/D ratios, and the FRET index shows little dependence on the receptor levels.
Collagen induces DDR1 aggregation and increase in FRET signal
To compare the changes induced in FRET index upon collagen stimulation, we performed FRET microscopy analysis on samples stimulated with collagen for 0–60 min. Collagen stimulation was found to induce aggregation of DDR1 into a clustered, more punctuate distribution (Fig. 4). As can be seen in Fig. 4d, there is a sharp increase in FRET signal from nonstimulated samples to collagen-stimulated samples that is confined to the regions of aggregated receptors. The regions from the stimulated samples, containing nonaggregated DDR1, showed a slight decrease in FRET; however, the DDR1 concentration in these regions exhibited intensity values that were within the noise range of FRET analysis, thus making it difficult to accurately evaluate the FRET index. Therefore, we confined our quantitative evaluation of the FRET signal in collagen-stimulated samples to the regions of DDR1 aggregation.
Fig. 4.

Collagen induces DDR1 aggregation and increase in FRET signal. 3T3 cells cotransfected with DDR1–YFP and DDR1–CFP were imaged before and after stimulation with collagen type I (as indicated); upper row shows images in the YFP channel (IAA) demonstrating uniform receptor distribution in the nonstimulated sample (a); collagen stimulation induces aggregation of DDR1 (c); lower row (b, d) shows FRET analysis of the corresponding images in the upper row. The stimulated sample (d) exhibits higher FRET values in the regions of aggregated DDR1—as compared with similar regions in the nonstimulated sample (b). The ROI indicated by white squares in the upper row images were magnified in both sets of images for clear demonstration of receptor aggregation and increase in FRET. All scale bars represent 20 μm.
As expected, the average receptor density was higher in regions of aggregation as compared to the average density in nonstimulated samples. Similar to the nonstimulated samples, we found the FRET index to be constant across a wide range of acceptor intensities in the regions of DDR1 aggregation (Fig. 5). However, in order to quantitatively compare the FRET index between the stimulated samples and the nonstimulated samples, we considered regions of interest (ROI) that exhibited similar receptor levels and A/D ratios such that the f(A,D) described in Eq. (9) would be the same for stimulated versus nonstimulated samples. The FRET index increased significantly from the non-stimulated samples to the aggregated regions in the stimulated samples (from 5.1±1.3 to 14.6±2.5) as early as 5 min after collagen stimulation (Table 1). While our results establish that collagen stimulation results in an increase in the FRET index for DDR1 dimers after collagen stimulation, at this point, we cannot unravel the specific cause of this increase, which may arise from several factors such as aggregation of DDR1 dimers, formation of higher-order oligomers, or structural changes within the dimer; all these factors can potentially affect the quantities x and EFRET (incorporated in Eq. (11)).
Fig. 5.
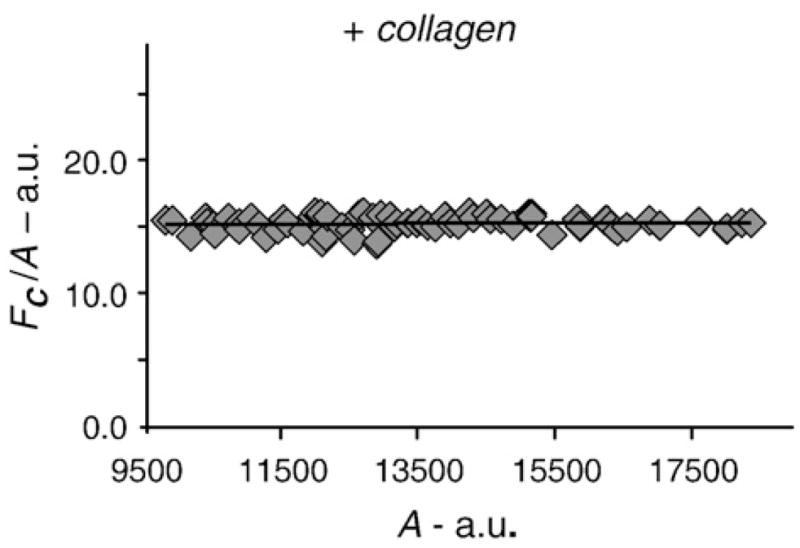
The FRET index was plotted against the acceptor levels for collagen-stimulated samples (5-min time point). All data points (ROIs) included have similar A/D ratios, and the FRET index shows little dependence on the receptor levels.
Table 1.
Collagen induces an increase in the FRET index (FC/A) for aggregated DDR1
| 60 min |
|||||
|---|---|---|---|---|---|
| Collagen stimulation | 0 min | 5 min aggregated ROI | 30 min aggregated ROI | Aggregated ROI | Nonaggregated ROI |
| FC/A | 5.1±1.3 | 14.6±2.5 | 15.2±2.7 | 13.8±2.9 | 5.2±1.5 |
| A | 9253.0 | 9630.0 | 9451.0 | 9880.0 | 9550.0 |
| A/D | 1.21 | 1.20 | 1.23 | 1.16 | 1.18 |
FC/A is the FRET index described in Eq. (4), A is the acceptor intensity, and D is the donor intensity. The values shown represent the averages of multiple ROIs; standard deviation is given for the FRET index (statistical analysis is derived from 20 ROIs per cell, 20 cells per sample, and 3 separate experiments).
DDR1 aggregation occurs on the same timescale as the changes in the FRET index
Next, we aimed to understand if the increase in the FRET index upon collagen stimulation was related to the kinetics of DDR1 aggregation. For this purpose, 3T3 cells as used in the FRET studies were singly transfected with DDR1–YFP and imaged live (Fig. 6a–c). As early as 5 min after the introduction of collagen to the cells, DDR1 was observed to aggregate, resulting in a punctuate distribution as described in Collagen Induces DDR1 Aggregation and Increase in FRET Signal. With increasing stimulation time (up to 30 min), this distribution pattern stayed uniform for most of the cells present in the sample. Quantitative analysis of the receptor distribution in the stimulated samples showed that the sharpest increase in receptor aggregation occurred after 5 min (30±4.2% of DDR1–YFP is aggregated), with only a mild increase (35.6±3.6% at 30 min) thereafter. As shown in Fig. 7 and Table 1, the timescales of DDR1 aggregation and increase in FRET signal were very similar for up to 30 min of collagen stimulation. Longer stimulation intervals revealed a decrease in DDR1 aggregation occurring after ~30 min, with only 5.7±4.7% of the receptor population being aggregated at the 60-min time point. The FRET index values in the few remaining regions of aggregated DDR1 at this later time point were similar to those measured at earlier stimulation intervals. At these later time points, redistribution of the aggregated DDR1 resulted in an increase in intensity values in the nonaggregated regions that allowed us to accurately measure the FRET index there. We found that nonaggregated regions in the stimulated samples exhibited the same FRET index values as the nonstimulated samples. This was an indication that the factors responsible for an increase in FRET index in the aggregated ROIs, such as increased dimer density and/or structural changes, were reversible. Thus, our results demonstrate that DDR1 aggregation was directly responsible for the changes in the FRET index.
Fig. 6.
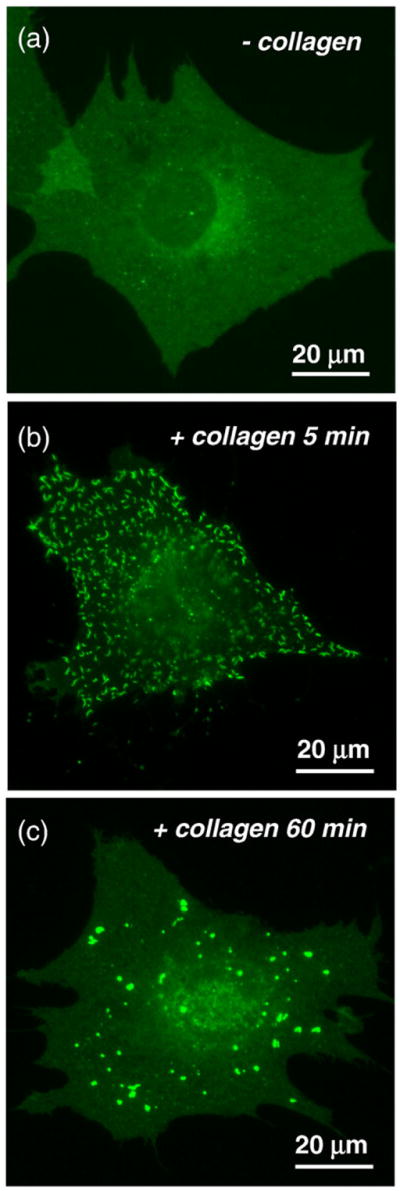
Dynamics of DDR1 aggregation. 3T3 cells transiently transfected with DDR1–YFP were imaged live before and after stimulation with collagen type I. (a) Nonstimulated cells show uniform distribution of the receptor. (b) After 5 min of collagen stimulation, DDR1 aggregates in clusters. (c) Increased stimulation time results in redistribution of a majority of DDR1 aggregates. Intensity levels in the nonaggregated regions revert to values similar to those observed before collagen stimulation.
Fig. 7.
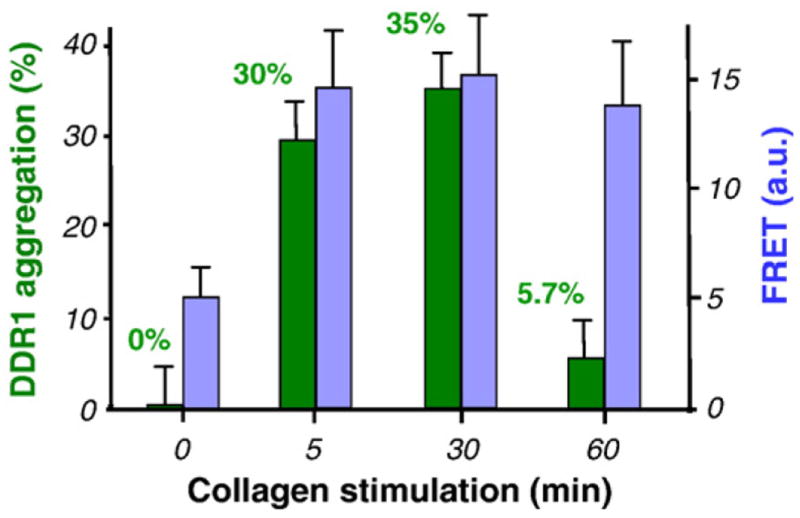
Quantitative analysis of the aggregation process depicted in Fig. 6. Aggregation percentage is depicted in green (left axis), together with the increase in FRET (blue; right axis). The two processes are shown to have similar dynamics in the initial phase, with a sharp increase immediately following collagen stimulation and little variation thereafter. Later time points (60 min) show redistribution of the DDR1 aggregates, while the FRET index in the remaining aggregates is similar to that recorded at earlier stimulation points.
DDR1 aggregation takes place through receptor internalization
The rapidly occurring ligand-induced aggregation of DDR1 led us to investigate the localization of DDR1 with respect to the plasma membrane. For many RTKs, ligand binding is known to result in internalization of the receptor. To test if this is the case for DDR1, we used HEK293 cells, which exhibit a thicker, less spread morphology when plated on culture dishes and thus are more amenable for microscopic localization of fluorescent proteins with respect to the plasma membrane.
Transiently transfected HEK293 cells expressing DDR1–YFP were examined using wide-field fluorescence microscopy. Prior to collagen stimulation, DDR1 was found to be uniformly distributed on the cell membrane (Fig. 8a). Images of stimulated cells show aggregation of the receptor that resulted in a more punctuate distribution (Fig. 8b), as was observed earlier for the 3T3 cells (Fig. 6). A dramatic loss of receptor population from the cell contour was observed for stimulated cells, indicating that the aggregated receptor is relocated from the plasma membrane into the cytoplasm. To confirm these results, similar samples were fixed and imaged using confocal microscopy. The resulting images (Fig. 8c) verify the membrane localization of the nonstimulated receptor. Collagen-stimulated samples (Fig. 8d) show aggregated DDR1–YFP to be present in the cytoplasm and not in the plasma membrane.
Fig. 8.

DDR1 aggregation takes place through receptor internalization. HEK293 cells were cultured on glass-bottom culture dishes, transiently transfected with DDR1–YFP, and stimulated with collagen type I for 10 min (as indicated). Following stimulation, cells were imaged live using wide-field fluorescence microscopy (a and b). Nonstimulated sample (a) shows localization of the receptor on the cell membrane. (b) Stimulated sample shows loss of fluorescence from the membrane and aggregation of the receptors. Confocal imaging of fixed cells confirms localization of the receptor on the cell membrane in the nonstimulated sample (c), while stimulated cells (d) show a loss of receptor signal from the membrane accompanied by aggregation inside the cytoplasm. Nuclear staining is shown in blue. All scale bars represent 10 μm.
To further determine whether DDR1–YFP was undergoing cellular internalization upon collagen stimulation, cells transfected with DDR1–YFP were stimulated with collagen, lysed using NP-40 (a week nonionic detergent), and directly probed for DDR1 expression using SDS-PAGE and Western blot analysis. The collagen-stimulated samples showed levels of DDR1 lower that those of the nonstimulated samples (Fig. 9), indicating that a smaller amount of DDR1–YFP was present in the soluble fraction of the cell lysate after collagen stimulation. These results, along with our microscopic observations on the intact cell (Fig. 8), indicate that aggregation of DDR1 takes place through internalization of the receptor and its incorporation into cytosolic vesicles.23 Furthermore, quantitative analysis of the signal in the DDR1 bands for various stimulation intervals (Fig. 9b) revealed the same pattern as detected in fluorescent measurements in 3T3 cells (Fig. 7, aggregation data). The amount of soluble receptor decreased sharply in the time intervals immediately following collagen stimulation and started to increase with longer (60 min) stimulation intervals. This indicates that, following internalization, DDR1 is eventually recycled back to the cell membrane.
Fig. 9.

Collagen stimulation decreases the amount of soluble DDR1 in the cell lysate. (a) HEK293 cells, transiently transfected with DDR1–YFP, were stimulated with 10 μg/ml collagen type I for 0-min, 10-min, 30-min, and 60-min intervals (as indicated). Cell lysates were run on SDS-PAGE and, following Western blot analysis, the membranes were probed with anti-DDR1 antibodies (upper blot); DDR1–YFP is indicated by the horizontal arrow. A control untransfected sample (rightmost lane) does not show the YFP-tagged DDR1. The membranes were reprobed with anti-GAPDH antibodies to verify protein expression and loading (lower blot). (b) The signal in the DDR1 bands was quantified and normalized to the signal in the corresponding GAPDH bands. The signal in the collagen-stimulated bands is given as the percentage of the signal in the nonstimulated (0 min) band.
Internalized DDR1 is incorporated into the early endosome
To identify the cytosolic vesicles that incorporate DDR1 following its internalization, we performed colocalization experiments using GFP-tagged Rab5a—a marker for the early endosome.24 For these experiments, we used HEK293 cells transiently cotransfected with DDR1–CFP and Rab5a-GFP, fixed before or after collagen stimulation, and examined by confocal microscopy. Rab5a-GFP images exhibited a more diffuse distribution as compared to DDR1–CFP, consistent with the cytoplasmic localization of Rab5a. A qualitative indication of colocalization between DDR1–CFP and Rab5a-GFP was obtained by merging the images acquired in the CFP and GFP channels. The samples that were not stimulated with collagen exhibited some nonspecific colocalization for DDR1–CFP and Rab5a-GFP in the perinuclear regions that was attributed to the high level of proteins presented in those regions (Fig. 10c). However, little colocalization was detected for the rest of the cell surface. The stimulated samples, on the other hand, demonstrated a punctuate distribution of DDR1–CFP and its reorganization into aggregates with granular or elongated morphology. In these samples, Rab5a generated aggregates of identical shape and at the same (x,y,z) location as with the DDR1 aggregates (Fig. 10d). We also performed a quantitative analysis of colocalization by measuring the Pearson coefficient (values can range from 1 to −1, where 1=complete positive correlation, 0=no correlation, and −1=negative correlation) for stimulated and nonstimulated samples. The regions rich in DDR1 aggregates exhibited a high Pearson coefficient of ~0.9 compared to ~0.09 for the nonstimulated samples. Furthermore, as we could delineate the vesicular structures containing aggregated DDR1 in our images, we also used object-based colocalization analysis. The intensity profiles in the CFP and GFP channels exhibited a strong overlap in both longitudinal and transversal axes (Fig. 11). These results showed that, following interaction with collagen type I, DDR1 is internalized and incorporated into the early endosome.
Fig. 10.

DDR1 aggregates colocalize with Rab5a. HEK293 cells were transiently transfected with both DDR1–CFP and Rab5a-GFP and stimulated with collagen type I for 15 min (as indicated). Confocal images of nonstimulated cells are shown on the upper row (a–c), and stimulated cells are shown on the lower row (d–f). CFP, red; GFP, green; overlap of the two, yellow. (f) The aggregated DDR1 (indicated by white arrows) in the stimulated cells overlaps with Rab5a. All scale bars represent 10 μm.
Fig. 11.

Object-based colocalization analysis. (a) Longitudinal (L) and transversal (T) linear ROIs along a DDR1–CFP aggregate. Intensity profiles along the longitudinal (b) and transversal (c) ROIs in the GFP (green) and CFP (red) channels overlap, demonstrating colocalization of DDR1–CFP and Rab5a-GFP.
Discussion
Collagen is the only identified ligand for DDR1 and is known to induce tyrosine phosphorylation (activation) of the receptor. DDR1 activation is very slow, requiring hours—rather than minutes—to achieve maximum phosphorylation, and it is sustained for unusually long time intervals, up to 18 h.2 In our previous work,17 we established that the DDR1 ECD binds to overlapping collagen filaments and modulates collagen fibrillogenesis. The interaction of DDR1 with collagen was found to be dependent on the oligomerization of DDR1 ECD in vitro. Here we investigated for the first time the effect of collagen on the distribution and oligomeric state of the full-length DDR1 on the intact cell surface using methods that allowed us to directly observe the receptor’s presence in live cells in real time.
To study the oligomeric state of DDR1, we utilized the expression of CFP- and YFP-tagged DDR1. Our DDR1–YFP proteins exhibited a similar collagen-induced tyrosine phosphorylation, as has been observed for native DDR12 and DDR1 tagged with various epitopes such as myc,18 glutathione S-transferase,25 and so on;. Our FRET analysis indicated that the CFP- and YFP-labeled receptors exhibited close intermolecular interactions indicative of dimer formation, even in the absence of collagen. This is consistent with recent reports by others19,20 where DDR1 is shown to form ligand-independent dimers.
In our studies, stimulation with collagen induced redistribution of a finite fraction (~30%) of the DDR1–YFP population into aggregates possessing a granular—or often an elongated—morphology. The FRET index increased significantly in the regions of aggregated receptors (from 5.1±1.3 to 14.6±2.5). Temporal characterization of DDR1 aggregation and increase in FRET index showed that, in the initial phase (up to 30 min), the two processes were simultaneous, with a sharp increase within a few minutes of collagen stimulation and little variation from then on. This FRET index variation can be induced by an increase in the number of DDR1 dimers, the density of local dimers, or changes in transfer efficiency. It is interesting to note that in both earlier reports,19,20 no significant variation in the percentage of DDR1 dimers was found before or after collagen stimulation at the whole-cell level. More so, in these reports, the percentage of DDR1 dimers with respect to the overall receptor population was ~20%, similar to the percentage of DDR1 (~30%) that we found to undergo aggregation during collagen stimulation. In our experimental setup, the FRET index is linearly proportional to the percentage of acceptor–donor pairs. A transition from 30% to 100% dimer percentage should result in a three-time increase in the FRET index, which is what we detected in the regions of aggregated DDR1. Such a transition would be possible if collagen-induced aggregation applies only to DDR1 dimers and not to DDR1 monomers. We speculate that this may be the case here, and the detected rise in the FRET index is likely due to an increase in the density of DDR1 dimers in the regions of aggregated receptors. Longer collagen stimulation intervals resulted in redistribution of the aggregated DDR1 dimers, which exhibited the same FRET index values as the nonstimulated DDR1. The few remaining regions of aggregation at these prolonged stimulation times display the same increased FRET index values as the earlier stimulation times. These observations indicate that collagen stimulation does not likely induce structural changes or higher-order aggregation that would account for changes in FRET index. On the other hand, we cannot completely rule out that such changes do occur and/or are reversible. Our model (Scheme 1) showing that collagen stimulation preferentially aggregates DDR1 dimers only is further supported by previous work by us and others showing that DDR1 dimers have an increased affinity for collagen type I as compared to DDR1 monomers17,18 and, thus, collagen may be interacting with and aggregating DDR1 dimers alone.
Scheme 1.
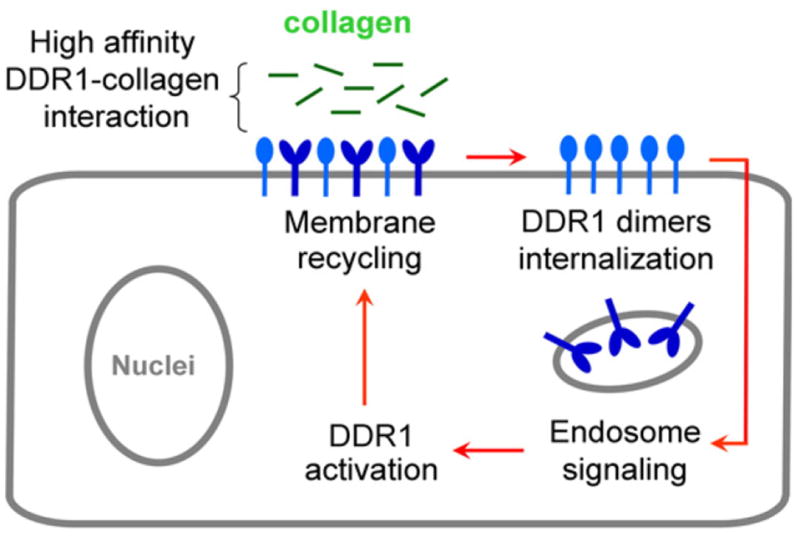
Proposed model of DDR1 activation mechanism. DDR1 exists on the cell membrane as a mixture of monomers and dimers. High-affinity interaction between DDR1 and collagen monomers induces internalization of DDR1 dimers and activation of the endosomal signaling pathway. Endosomal signaling induces DDR1 activation, followed by recycling of DDR1 dimers to the cell surface.
While ligand binding induces a transition from monomeric state to dimeric/oligomeric state in the commonly accepted mechanism of RTK activation, recent reports have come to challenge this as a general assumption. Specifically epidermal growth factor receptor (EGFR) was found to form ligand-independent dimers.26–28 In the case of EGFR, it has been reported that two distinct affinity classes are present and, while not confirmed, it has been thought that they are associated with different oligomerization states of the receptor.29 Similarly, the insulin receptor forms disulfide-linked dimers that are activated without further oligomerization.30 Thus, DDR1 may belong to that category of RTKs that exists as preformed dimers and for which ligand binding is modulated by their oligomeric state.
Our investigations regarding localization of the collagen-induced DDR1 aggregation revealed the process to be associated with a loss of fluorescence from the cell membrane and a decrease in receptor levels in the soluble part of the cell lysate. Colocalization experiments with a marker of the early endosome Rab5a confirmed that, following collagen stimulation, DDR1 is internalized and incorporated into the early endosome. These results indicate that collagen induces trafficking of the receptor from the plasma membrane into the cytoplasm. Receptor internalization upon ligand-induced activation is a commonly encountered cellular response for RTKs.31,32 Internalization can either result in degradation of the receptor and termination of the signaling event or serve as a way to localize the activated receptor at distinct locations in the cytoplasm. Furthermore, the endosome membrane has recently emerged as an important site of receptor-initiated signal transduction.32 Localization of the internalized receptor in the endosome membrane is reported to result in activation of signaling pathways different from those activated when the receptor remains in the plasma membrane.32 For instance, mitogen-activated protein kinase signaling is activated by the EGFR only after the receptor has been internalized.33 The neurotrophin receptor TrkA, an RTK with a catalytic domain structure similar to that of DDR1, is reported to transiently activate Ras when present in the plasma membrane, while endosomes containing activated TrkA complexes selectively mediate prolonged activation of Rap1.34,35
Our imaging analysis of DDR1 trafficking showed that the overall receptor levels do not decrease after collagen stimulation, indicating that lysosomal degradation does not take place at the timescales examined. Furthermore, our observations reveal that, following internalization, the receptor is recycled back to the cell membrane at time frames (~60 min) at which consistent receptor phosphorylation is reported.1 While collagen stimulation is reported to initiate DDR1 activation, the discrepancy between the large time interval required for full phosphorylation of the receptor (~90 min)2 and the small time interval (~5 min) that we have found the receptor to spend on the cell membrane after collagen stimulation suggests that other cellular processes are likely involved in receptor activation. We propose that the internalization–membrane recycling loop described here plays a significant role in the DDR1 activation mechanism, as depicted in Scheme 1. This idea is supported by previous observations20 that inhibition of DDR1 dimerization by site-directed mutagenesis also inhibits DDR1 activation.
Conclusions
Our findings here, corroborated with previous work by others, suggests that DDR1 dimerization, collagen binding, and receptor phosphorylation are likely temporally and spatially separated events. We confirm that DDR1 exhibits close intermolecular interaction indicative of dimerization even in the absence of collagen, and we show for the first time that collagen stimulation induces rapid aggregation and internalization of the receptor at timescales that do not exhibit tyrosine phosphorylation. In addition, our results suggest that collagen-induced internalization applies preferentially to the dimerized DDR1 receptors. Further investigations are required to fully characterize the DDR1 internalization pathway and the role it plays in this collagen receptor activation.
Materials and Methods
Reagents
Anti-DDR1 antibody sc-532, anti-glyceraldehyde 3-phosphate dehydrogenase (GAPDH) antibody, and anti-mouse and anti-rabbit IgG horseradish-peroxidase-conjugated antibodies were obtained from Santa Cruz Biotech (Santa Cruz, CA). Anti-rabbit IgG antibodies conjugated with Alexa Fluor 488 and protein-A-coated agarose beads were obtained from Invitrogen (Carlsbad, CA). Bovine dermal collagen type I was obtained from Invitrogen. Glass-bottom culture dishes for live cell microscopy were obtained from MatTek Glassware (Ashland, MA). NheI, Eco47III, and EcoRI restriction enzymes were obtained from New England Biolabs (Ipswich, MA). PfuTurbo polymerase and CIAP were obtained from Stratagene (La Jolla, CA).
DNA constructs
A plasmid containing the entire mouse DDR1a sequence was obtained from Regeneron Pharmaceuticals (Tarrytown, NY). To generate the DDR1–CFP construct, we used the cerulean variant of the pECFP-C1 vector, which was a generous gift by Dr. Dave Piston (Vanderbilt University, Nashville, TN).36 This plasmid was linearized by restriction digestion with Eco47III and phosphatased using standard procedures. The DDR1 coding region was amplified by polymerase chain reaction (PCR) utilizing the following primers: 5′ primer, 5′-phos-ACCATGGGGACAGGGACCCTC; 3′ primer, 5′-phos-CACCGTGTTGAGCGCATCATCC. The resulting PCR product blunt-end-ligated immediately upstream of the CFP open reading frame. To generate the DDR1–YFP construct, we used the pEYFP-N1 vector from Clontech (Carlsbad, CA). The DDR1 coding region was amplified by PCR using primers that introduced a NheI restriction site at the 5′ end (5′-AGAGGGTTCCGCTAGCGCCACCATGGGGACAGGGACCCTCTCATC) and an EcoRI restriction site at the 3′ end (5′-GTCGACTGCAGAATTCGCACCGTGTTGAGCGCATCATCCG). The PCR products were double-digested with NheI and EcoRI, and directionally ligated into the NheI and EcoRI restriction sites of the pEYFP-N1 vector. The authenticity (i.e., at correct orientation and in-frame with either the CFP coding region or the YFP coding region) of the resulting clones was verified by dideoxynucleotide sequencing. The selected clones were amplified in DH5α-competent cells (Invitrogen). A pEGFP-C3 vector for the expression of N-terminus GFP-labeled Rab5a was a kind gift from Dr. Heidi McBride (University of Ottawa Heart Institute, Canada).
Cell sample preparations
Substrates used for cell culture
For SDS-PAGE experiments, the cells were seeded on NuClon culture dishes; for wide-field or FRET microscopy experiments, cells were seeded on 20-mm glass-bottom culture dishes; and for confocal microscopy, cells were seeded on 25-mm glass coverslips. The different cell types (HEK293 and 3T3) were used based on their suitability for FRET, confocal microscopy, or SDS-PAGE analysis. The factors determining the cell-type selection were based on cell adherence to the substrate, level of protein expression after transient transfection, and cell morphology.
DDR1 activation experiments
HEK293 cells (ATCC, Manassas, VA) were grown in DMEM (Gibco-Invitrogen) supplemented with 10% fetal bovine serum and antibiotics. The cells were transiently transfected with DDR1–CFP or DDR1–YFP using Fugene transfection reagent. After 24 h of transfection, the cells were serum-starved overnight and stimulated with 10 μg/ml collagen type I for time intervals ranging from 5 min to 2 h. Following stimulation, the cells were lysed and subjected to SDS-PAGE. Alternatively, the cells were washed with phosphate-buffered saline (PBS) supplemented with Ca and Mg ions and imaged live. Identical nonstimulated control samples were also prepared.
FRET microscopy experiments
Mouse osteoblast 3T3 cells obtained from ATCC were cultured in modified minimal essential medium alpha (Gibco) supplemented with 10% fetal bovine serum and antibiotics. Samples were transfected with DDR1–YFP and/or DDR1–CFP and stimulated with collagen as described above. The cells were then washed in PBS and imaged live using FRET microscopy.
Confocal microscopy experiments
HEK293 cells seeded on glass coverslips were transiently transfected with DDR1–CFP, Rab5a-GFP, or both, and stimulated with collagen as described above. Following stimulation, the cells were washed three times with PBS and fixed with 2% paraformaldehyde for 30 min. Following fixation, the coverslips were mounted on microscope glass slides using Prolong mounting media (Invitrogen). A similar sample was prepared using HEK293 cells transfected with DDR1–YFP wherein, following fixation, the cells were also nuclear-stained with 4 μM bisbenzimide (Calbiochem).
SDS-PAGE and Western blot analysis
Following stimulation, HEK293 cells were lysed in 20 mM Tris–HCl (pH 7.8), 150 mM NaCl, 2 mM sodium orthovanadate, 1% NP-40, 1 mM phenylmethylsulfonyl fluoride, 10 μg/ml aprotinin, 10 μg/ml leupeptin, and 2 mM ethylene-diaminetetraacetic acid. The whole-cell lysate was analyzed using SDS-PAGE performed as described previously.21 Briefly, samples containing 15 μg of protein sample were prepared in 1× NuPage LDS sample buffer (Invitrogen). Electrophoresis was performed using 4–12% (wt/vol) NuPAGE® Novex Bis-Tris Gels (Invitrogen). BenchMark Protein Ladder (Invitrogen) was used as marker. SDS-PAGE was followed by Western blot analysis using nitrocellulose membranes (Invitrogen). The membranes were probed with anti-DDR1 antibodies and imaged using enhanced chemiluminescence (Amersham Biosciences) after incubation with anti-rabbit Ig horseradish peroxidase antibodies.
Alternatively, cells were lysed in 20 mM Tris–HCl (pH 7.5), 150 mM NaCl, 2 mM sodium orthovanadate, 1% Triton, 1 mM phenylmethylsulfonyl fluoride, 10 μg/ml aprotinin, 10 μg/ml leupeptin, and 2 mM ethylene-diaminetetraacetic acid. DDR1 was immunoprecipitated from the whole-cell lysate using anti-DDR1 antibodies and protein-A-coupled agarose beads. Following overnight incubation, immunoprecipitation reactions were washed three times in lysis buffer, and the protein was separated from the beads by boiling for 5 min in 1× sample buffer. The resulting samples were analyzed for phosphorylation using SDS-PAGE, followed by Western blot analysis and incubation with anti-phosphotyrosine antibodies.
Microscopy
Colocalization studies between Rab5a-GFP and DDR1–CFP were performed using a Zeiss LSM 510 confocal microscope. GFP was imaged using the 488 line of argon laser, and CFP was imaged using a tunable Ti-sapphire laser at 830 nm in two-photon mode. Images were acquired using a 63× objective, with an acquisition rate of 12 kHz and a pixel resolution of 1024×1024. To establish eventual bleedthrough between the GFP and the CFP channels, we imaged control samples containing cells expressing only DDR1–CFP or only Rab5a-GFP. Under these imaging conditions, no bleedthrough was detected between the CFP and the GFP channels. To study colocalization between DDR1 and Rab5a, images were acquired sequentially in the CFP and GFP channels at the same field of view and focal plane. Imaging of HEK293 cell samples transfected with DDR1–YFP was performed using the 514 line of argon laser; the nuclear stain was imaged with the tunable Ti-sapphire laser at 750 nm in two-photon mode.
FRET experiments and internalization dynamics studies were performed in wide-field microscopy, using a Zeiss Axiovert 200 equipped with an Excite 120 light source (Excite, Mississauga, Canada) and a cooled charged-coupled device ORCA camera (Hamamatzu, Bridgewater, NJ). The FRET experiments were performed in an acceptor-sensitizing setup,37,38 directly measuring the emission of the acceptor while exciting the donor. Imaging was performed in a three-filter cube setup, using a 63× water immersion objective. The optical filters were obtained from Semrock (Rochester, NY): IDD channel, donor excitation–donor emission (excitation, 438/24; emission, 475/25); IAA channel, acceptor excitation–acceptor emission (excitation, 500/24; emission, 542/27); and IDA channel, donor excitation–donor emission (excitation, 438/24; emission, 542/27). The internalization dynamics studies were performed using the YFP-labeled receptor, with imaging performed in the acceptor channel described above.
FRET analysis
The nomenclature used below was the one proposed by Zal and Gascoigne.38 The following bleedthrough constants were measured on samples containing the acceptor only (A) or the donor only (D), indicated in parentheses near the channel index:
| (1) |
FRET imaging was performed on samples expressing the donor and the acceptor, and the corrected sensitized fluorescence FC was calculated according to the formula:
| (2) |
After image acquisition, bleedthrough parameters were derived using PixFRET, an ImageJ plug-in proposed by Feige et al.39 This allowed for pixel-by-pixel analysis and determination of the above constants for a large range of intensity values. The minor bleedthrough constants c and b were found to be negligible in our setup and henceforth were ignored in our calculations. We found a=0.150 and d=0.400; these values were constant across the entire range of intensities found in our samples, except for the very low range, which exhibited large fluctuations in the values of the constants. Those regions were excluded from our analysis. Equation (2) thus becomes:
| (3) |
The corrected FRET signal was normalized against the acceptor’s fluorescence, with the resulting FRET index shown to linearly depend on both the transfer efficiency and the number of acceptor–donor pairs:38
| (4) |
where A is the number of acceptor-labeled receptors; εD1 and εA1 are the extinction coefficients of the donor and the acceptor, respectively, at donor excitation wavelength; a is the bleedthrough constant defined above; Nad is the number of acceptor–donor pairs; and EFRET is the FRET transfer efficiency for the current structure of the donor-labeled and acceptor-labeled DDR1 dimer; εD1, εA1, and a are constants for our experimental setup and can be written as . In our numerical analysis, A is given by the signal intensity in the IAA channel, and D is given by the signal intensity in the IDD channel.
As for most receptors, we define that only a fraction x of the DDR1 receptor population (A+D) participates in dimer formation. Collagen stimulation could induce structural changes, increasing the fraction of receptors involved in dimer formation, or alternatively aggregate the dimeric receptor, thus increasing the fraction of dimer-forming receptors in localized regions. To account for this, x can therefore change from nonstimulated to stimulated samples. The number of DDR1 dimers Nmax—considering complete dimerization of the fraction x—can therefore be written as:
| (5) |
Considering that the acceptor-labeled and donor-labeled receptors are expressed with equal efficiency, and that their incorporation into the dimer formation is random, the fraction of individual dimer species is given by:40,41
| (6) |
where i=0, 1, 2; fa is the acceptor fraction; and fd is the donor fraction. The number of acceptor–donor dimers (i=1) is given by:
| (7) |
or
| (8) |
where r =A/D is the ratio between acceptor-labeled receptors and donor-labeled receptors.
Furthermore, considering the effects of receptor density on DDR1 dimerization, we introduce an additional term to the right-hand side of Eq. (5), and the number of DDR1 dimers becomes:
| (9) |
where f(A,D) is a function describing the dependency of dimer formation on receptor density; replacing Nmax in Eq. (7) with N, the number of acceptor–donor dimers Nad becomes:
| (10) |
Equation (4) can now be written as:
| (11) |
Image analysis
Quantitative evaluation of the microscopy data was performed using ImageJ. For the FRET experiments, measurements were performed on defined cellular ROI. The mean fluorescence intensity was derived with ImageJ, and subsequent numerical calculations and statistical analysis were performed with Microsoft Excel according to the equations presented above.
Internalization kinetics
To evaluate the percentage of internalized receptor in the internalization kinetics experiments, we defined two ranges of receptor intensities: R1 for the noninternalized receptor and R2 for the internalized receptor. These intervals were determined for each cell by thresholding the background-corrected image to an intensity value (T) that allowed delineating the aggregated receptor regions. R2 was defined as the intensity range (T–Max), where Max was the maximum intensity value, and R1 was defined as the intensity range (Min–T), where Min was the minimum intensity value. The integrated intensity encompassed by either of these ranges was measured and used to derive the percentage of internalized receptor.
Colocalization analysis
We have performed a quantitative analysis of colocalization using JACoP, an ImageJ plug-in that allowed for determination of the Pearson coefficient.42 The linear equation describing the relationship between the intensities in the two images is calculated by linear regression. Pearson coefficient values can range from 1 to −1, with 1=complete positive correlation, 0=no correlation, and −1=negative correlation. For an object-based colocalization analysis, we considered ROIs along the longitudinal and transversal axes of individual DDR1–CFP aggregates. We extracted the intensity profiles along each axis in both GFP and CFP channels and plotted them on the same graph. Colocalization was estimated based on the overlap of the two intensity profiles.
Acknowledgments
We thank David Piston (Vanderbilt University) for the cerulean CFP construct, and Heidi McBride (University of Ontario) for the GFP-tagged Rab5a construct. This work was partly supported by National Institutes of Health award K25 HL81442-03.
Abbreviations used
- DDR
discoidin domain receptor
- FRET
fluorescence resonance energy transfer
- RTK
receptor tyrosine kinase
- ECD
extracellular discoidin domain
- GFP
green fluorescent protein
- YFP
yellow fluorescent protein
- CFP
cyan fluorescent protein
- ROI
regions of interest
- EGFR
epidermal growth factor receptor
- GAPDH
glyceraldehyde 3-phosphate dehydrogenase
- PBS
phosphate-buffered saline
References
- 1.Vogel W, Gish GD, Alves F, Pawson T. The discoidin domain receptor tyrosine kinases are activated by collagen. Mol Cell. 1997;1:13–23. doi: 10.1016/s1097-2765(00)80003-9. [DOI] [PubMed] [Google Scholar]
- 2.Shrivastava A, Radziejewski C, Campbell E, Kovac L, McGlynn M, Ryan TE, et al. An orphan receptor tyrosine kinase family whose members serve as nonintegrin collagen receptors. Mol Cell. 1997;1:25–34. doi: 10.1016/s1097-2765(00)80004-0. [DOI] [PubMed] [Google Scholar]
- 3.Vogel W. Discoidin domain receptors: structural relations and functional implications. FASEB J. 1999;13(Supplement):S77–S82. doi: 10.1096/fasebj.13.9001.s77. [DOI] [PubMed] [Google Scholar]
- 4.Franco CD, Hou G, Bendeck MP. Collagens, integrins, and the discoidin domain receptors in arterial occlusive disease. Trends Cardiovasc Med. 2002;12:143–148. doi: 10.1016/s1050-1738(01)00165-7. [DOI] [PubMed] [Google Scholar]
- 5.Yamanaka R, Arao T, Yajima N, Tsuchiya N, Homma J, Tanaka R, et al. Identification of expressed genes characterizing long-term survival in malignant glioma patients. Oncogene. 2006;25:5994–6002. doi: 10.1038/sj.onc.1209585. [DOI] [PubMed] [Google Scholar]
- 6.Johansson FK, Goransson H, Westermark B. Expression analysis of genes involved in brain tumor progression driven by retroviral insertional mutagenesis in mice. Oncogene. 2005;24:3896–3905. doi: 10.1038/sj.onc.1208553. [DOI] [PubMed] [Google Scholar]
- 7.Heinzelmann-Schwarz VA, Gardiner-Garden M, Henshall SM, Scurry J, Scolyer RA, Davies MJ. Overexpression of the cell adhesion molecules DDR1, Claudin 3, and Ep-CAM in metaplastic ovarian epithelium and ovarian cancer. Clin Cancer Res. 2004;10:4427–4436. doi: 10.1158/1078-0432.CCR-04-0073. [DOI] [PubMed] [Google Scholar]
- 8.Weiner HL, Huang H, Zagzag D, Boyce H, Lichtenbaum R, Ziff EB. Consistent and selective expression of the discoidin domain receptor-1 tyrosine kinase in human brain tumors. Neurosurgery. 2000;47:1400–1409. [PubMed] [Google Scholar]
- 9.Matsuyama W, Watanabe M, Shirahama Y, Mitsuyama H, Higashimoto I, Osame M, Arimura K. Discoidin domain receptor 1 contributes to the survival of lung fibroblast in idiopathic pulmonary fibrosis. Am J Pathol. 2006;168:866–877. doi: 10.2353/ajpath.2006.050801. [DOI] [PMC free article] [PubMed] [Google Scholar] [Retracted]
- 10.Yoshida D, Teramoto A. Enhancement of pituitary adenoma cell invasion and adhesion is mediated by discoidin domain receptor-1. J Neuro-Oncol. 2007;82:29–40. doi: 10.1007/s11060-006-9246-6. [DOI] [PubMed] [Google Scholar]
- 11.Andersson KB, Florholmen G, Winer LH, Tonnessen T, Christensen G. Regulation of neuronal type genes in congestive heart failure rats. Acta Physiol (Oxford) 2006;186:17–27. doi: 10.1111/j.1748-1716.2005.01503.x. [DOI] [PubMed] [Google Scholar]
- 12.Ferri N, Carragher NO, Raines EW. Role of discoidin domain receptors 1 and 2 in human smooth muscle cell-mediated collagen remodeling: potential implications in atherosclerosis and lymphangioleiomyomatosis. Am J Pathol. 2004;5:1575–1585. doi: 10.1016/S0002-9440(10)63716-9. [DOI] [PMC free article] [PubMed] [Google Scholar]
- 13.Ongusaha PP, Kim J, Fang L, Wong TW, Yancoupoulos GD, Aaronson SA, Lee SW. p53 induction and activation of DDR1 kinase counteract p53-mediated apoptosis and influence p53 regulation through a positive feedback loop. EMBO J. 2003;22:1289–1301. doi: 10.1093/emboj/cdg129. [DOI] [PMC free article] [PubMed] [Google Scholar]
- 14.Dejmek J, Dib K, Jonsson M, Andersson T. Wnt-5A and G-protein signaling are required for collagen-induced DDR1 receptor activation and normal mammary cell adhesion. Int J Cancer. 2003;103:344–351. doi: 10.1002/ijc.10752. [DOI] [PubMed] [Google Scholar]
- 15.Hou G, Vogel WF, Bendeck MP. Tyrosine kinase activity of discoidin domain receptor 1 is necessary for smooth muscle cell migration and matrix metalloproteinase expression. Circ Res. 2002;90:1147–1159. doi: 10.1161/01.res.0000022166.74073.f8. [DOI] [PubMed] [Google Scholar]
- 16.Curat CA, Eck M, Dervillez X, Vogel WF. Mapping of epitopes in discoidin domain receptor 1 critical for collagen binding. J Biol Chem. 2001;276:45952–45958. doi: 10.1074/jbc.M104360200. [DOI] [PubMed] [Google Scholar]
- 17.Agarwal G, Mihai C, Iscru DF. Interaction of discoidin domain receptor 1 with collagen type I. J Mol Biol. 2007;367:443–455. doi: 10.1016/j.jmb.2006.12.073. [DOI] [PubMed] [Google Scholar]
- 18.Leitinger B. Molecular analysis of collagen binding by the human discoidin domain receptors, DDR1 and DDR2. Identification of collagen binding sites in DDR2. J Biol Chem. 2003;278:16761–16769. doi: 10.1074/jbc.M301370200. [DOI] [PubMed] [Google Scholar]
- 19.Noordeen NA, Carafoli F, Hohenester E, Horton MA, Leitinger B. A transmembrane leucine zipper is required for activation of the dimeric receptor tyrosine kinase DDR1. J Biol Chem. 2006;281:22744–22751. doi: 10.1074/jbc.M603233200. [DOI] [PubMed] [Google Scholar]
- 20.Abdulhussein R, Koo HHD, Vogel WF. Identification of disulfide-linked dimers of the receptor tyrosine kinase DDR1. J Biol Chem. 2008;283:12026–12033. doi: 10.1074/jbc.M704592200. [DOI] [PMC free article] [PubMed] [Google Scholar]
- 21.Mihai C, Iscru FD, Druhan LJ, Elton TS, Agarwal G. Discoidin domain receptor 2 inhibits fibrillogenesis of collagen type I. J Mol Biol. 2006;361:864–876. doi: 10.1016/j.jmb.2006.06.067. [DOI] [PubMed] [Google Scholar]
- 22.Pentcheva T, Edidin M. Clustering of peptide-loaded MHC class I molecules for endoplasmic reticulum export imaged by fluorescence resonance energy transfer. J Immunol. 2001;166:6625–6632. doi: 10.4049/jimmunol.166.11.6625. [DOI] [PubMed] [Google Scholar]
- 23.Richardson DS, Lai AZ, Mulligan LM. RET ligand-induced internalization and its consequences for downstream signaling. Oncogene. 2006;25:3206–3211. doi: 10.1038/sj.onc.1209349. [DOI] [PubMed] [Google Scholar]
- 24.Nielsen E, Severin F, Backer JM, Hyman AA, Zerial M. Rab5 regulates motility of early endosomes on microtubules. Nat Cell Biol. 1999;1:376–382. doi: 10.1038/14075. [DOI] [PubMed] [Google Scholar]
- 25.Abdulhussein R, McFadden C, Fuentes-Prior P, Vogel FW. Exploring the collagen-binding site of the DDR1 tyrosine kinase receptor. J Biol Chem. 2004;279:31462–31470. doi: 10.1074/jbc.M400651200. [DOI] [PubMed] [Google Scholar]
- 26.Moriki T, Maruyama H, Maruyama IN. Activation of preformed EGF receptor dimers by ligand-induced rotation of the transmembrane domain. J Mol Biol. 2001;311:1011–1026. doi: 10.1006/jmbi.2001.4923. [DOI] [PubMed] [Google Scholar]
- 27.Martin-Fernandez M, Clarke DT, Tobin MJ, Jones SV, Jones JR. Preformed oligomeric epidermal growth factor receptors undergo an ecto-domain structure change during signaling. Biophys J. 2002;82:2415–2427. doi: 10.1016/S0006-3495(02)75585-9. [DOI] [PMC free article] [PubMed] [Google Scholar]
- 28.Gadella TW, Jovin TM. Oligomerization of epidermal growth factor receptors on A431 cells studied by time-resolved fluorescence imaging microscopy. A stereochemical model for tyrosine kinase receptor activation. J Cell Biol. 1995;129:1543–1558. doi: 10.1083/jcb.129.6.1543. [DOI] [PMC free article] [PubMed] [Google Scholar]
- 29.Wiedlocha A, Sorensen V. Signaling, internalization, and intracellular activity of fibroblast growth factor. Curr Top Microbiol Immunol. 2004;286:45–79. doi: 10.1007/978-3-540-69494-6_3. [DOI] [PubMed] [Google Scholar]
- 30.Ottensmayer FB, Beniac DR, Luo RZ, Yip CC. Mechanism of transmembrane signaling: insulin binding and the insulin receptor. Biochemistry. 2000;39:12103–12112. doi: 10.1021/bi0015921. [DOI] [PubMed] [Google Scholar]
- 31.Le Roy C, Wrana JL. Clathrin- and non-clathrin-mediated endocytic regulation of cell signaling. Nat Rev Mol Cell Biol. 2005;6:112–126. doi: 10.1038/nrm1571. [DOI] [PubMed] [Google Scholar]
- 32.Von Zastrow M, Sorkin A. Signaling on the endocytic pathway. Curr Opin Cell Biol. 2007;19:436–445. doi: 10.1016/j.ceb.2007.04.021. [DOI] [PMC free article] [PubMed] [Google Scholar]
- 33.Vieira AV, Lamaze C, Schmid SL. Control of EGF receptor signaling by clathrin-mediated endocytosis. Science. 1996;274:2086–2089. doi: 10.1126/science.274.5295.2086. [DOI] [PubMed] [Google Scholar]
- 34.Zweifel LS, Kuruvilla R, Ginty DD. Functions and mechanism of retrograde neurotrophin signaling. Nat Rev Neurosci. 2005;6:615–625. doi: 10.1038/nrn1727. [DOI] [PubMed] [Google Scholar]
- 35.Wu C, Lai CF, Mobley WC. Nerve growth factor activates persistent Rap1 signaling in endosomes. J Neurosci. 2001;21:5406–5416. doi: 10.1523/JNEUROSCI.21-15-05406.2001. [DOI] [PMC free article] [PubMed] [Google Scholar]
- 36.Rizzo MA, Springer GH, Granada B, Piston DW. An improved cyan fluorescent protein variant useful for FRET. Nat Biotechnol. 2004;22:445–449. doi: 10.1038/nbt945. [DOI] [PubMed] [Google Scholar]
- 37.Gordon GW, Berry G, Huan XL, Levine B, Herman B. Quantitative fluorescence resonance energy transfer measurements using fluorescence microscopy. Biophys J. 1998;74:2702–2713. doi: 10.1016/S0006-3495(98)77976-7. [DOI] [PMC free article] [PubMed] [Google Scholar]
- 38.Zal T, Gascoigne NRJ. Photobleaching-corrected FRET efficiency imaging of live cells. Biophys J. 2004;86:3923–3939. doi: 10.1529/biophysj.103.022087. [DOI] [PMC free article] [PubMed] [Google Scholar]
- 39.Feige J, Sage D, Wahli W, Desvergne B, Gelman L. PixFRET, an ImageJ plug-in for FRET calculation that can accommodate variations in spectral bleed-troughs. Microsc Res Tech. 2005;68:51–58. doi: 10.1002/jemt.20215. [DOI] [PubMed] [Google Scholar]
- 40.MacKinnon R. Determination of the subunit stoichiometry of a voltage-activated potassium channel. Nature. 1991;350:232–235. doi: 10.1038/350232a0. [DOI] [PubMed] [Google Scholar]
- 41.Balannik V, Lamb RA, Pinto LH. The oligomeric state of the active BM2 ion channel protein of influenza B virus. J Biol Chem. 2008;283:4895–4904. doi: 10.1074/jbc.M709433200. [DOI] [PubMed] [Google Scholar]
- 42.Bolte S, Cordelières FP. A guided tour into subcellular colocalization analysis in light microscopy. J Microsc. 2004;224:213–232. doi: 10.1111/j.1365-2818.2006.01706.x. [DOI] [PubMed] [Google Scholar]