Abstract
A polyacrylate-based monolithic column bearing cationic functionalities and designed for capillary electrochromatography (CEC) has been prepared via photopolymerization of a mixture of hexyl acrylate, butanediol diacrylate, 2-(acryloyloxy) ethyltrimethyl ammonium chloride (monomers), azobisisobutyronitrile (photoinitiator), acetonitrile, phosphate buffer, and ethanol (porogens). The polymerization process was initiated with UV light at 360 nm. The column performance was evaluated via the separations of alkylbenzenes, substituted anilines, basic drugs, peptides, and a protein digest. The separation of complex peptide mixtures was then studied since such separations constitute a promising application of CEC. In particular, the effects of mobile phase composition, including ionic strength of the buffer solution and the percentage of acetonitrile on the retention factor, the column efficiency and the resolution were determined. The separations were affected by both interaction of the peptides with the stationary phase and their own electrophoretic mobility. Excellent separations with column efficiencies of up to 160,000 plates/m were achieved for both a mixture of ten well-defined peptides and a tryptic digest of cytochrome c. The fractions of eluent containing peptides of the digest separated in the monolithic column were collected and characterized using MALDI mass spectrometry.
Keywords: Capillary electrochromatography, Column technology, Monolithic stationary phase, Proteomics, Peptides, Tryptic digest
1 Introduction
In liquid chromatography, flow through a column is typically achieved via mechanical pumping. In contrast, electroendoosmotic flow (EOF) is generated within a stationary system by applying an electrostatic potential across the entire length of the separation device, such as a capillary, a microfluidic channel, or a thin layer. Flow velocity profile driven by EOF is characterized by a flat flow profile, a clear advantage that was recognized by Pretorius as early as 1974 [1]. However, early work in electrochromatography was marred by serious technical difficulties that significantly reduced the interest in the technique [2,3]. However, the need for separation methods with vastly enhanced efficiencies and peak capacities that could be easily miniaturized revived interest in this separation technique in the mid 1990's. Today, capillary electrochromatography (CEC) combines the capillary column format and the EOF typical of capillary electrophoresis (CE) with the use of a solid stationary phase and a separation mechanism analogous to that of liquid chromatography (LC) being based on specific interactions of solutes with a stationary phase. The stationary phase plays a dual role in CEC: (i) It provides sites for the desired interactions as in LC and (ii) it generates EOF [4].
The serious challenges associated with packed CEC columns, such as the fabrication of retaining frits within a capillary and the packing of small diameter particles into narrow-bore tubes, have spurred the development of various alternative approaches. In particular, columns containing in situ polymerized organic separation media [5] have proven to be a viable option [6–8]. Monolithic columns have attracted considerable attention due to their intriguing features and their ease of preparation [5] involving a simple polymerization performed directly within the confines of a capillary or a microfluidic device making columns of virtually any length and shape easily accessible. A wide variety of functional monomers is available for this process enabling a nearly unlimited choice of both support and surface chemistries. This flexibility facilitates the tailoring of the interactions that are required for specific separation modes as well as the level of EOF generated by the stationary phase. Finally, the control that can be exerted over the polymerization process enables the facile optimization of the porous properties of the monolith, and consequently over the flow rate and chromatographic efficiency of the system [9].
The high efficiency separation of proteins and peptides in CEC mode remains a difficult task. The major challenge results from the net charge these compounds carry at pH values different from their pI value that itself varies for each of them. After application of the voltage, these analytes tend to move to the electrode of the opposite sign. The speed of this migration depends on the overall charge of the protein or peptide and the migration direction may also be opposite to EOF. In the worst scenario, the separated analytes may not even appear in the detection window and cannot be monitored since they do not move through the column. Despite these problems, separations of peptides and proteins have been attempted most often using specifically designed monolithic columns. Typically, separation of a model mixture consisting of only a few peptides or proteins has been demonstrated [7,10–19].
The attractiveness of CEC for the separation of peptides relies on the very high column efficiency that is particularly beneficial for the resolution of very complex mixtures requiring large peak capacity. Peptide mixtures obtained by digestion of proteins represent such a category of very complex samples. Their efficient separation, followed by mass spectrometric determination of molecular masses, is expected to have a great impact on proteomic studies. The CEC separation of digests is difficult and, as a result, very little has been published on this topic [20–22].
Recently, we have introduced a method of preparation of porous polymer monoliths involving the use of UV initiated polymerization [23–27]. The major advantage of this photochemically initiated process is its speed and the option it provides to “pattern” the stationary phase in selected locations using a photomask, a feature particularly important for the fabrication of microfluidic chips. The following report focuses on monoliths prepared via photopolymerization and designed for the efficient CEC separation of peptide mixtures with detection by both UV adsorption and MALDI TOF MS. In order to achieve the desired high efficiency, both chemical composition and porous properties of the monolithic column as well as mobile phase composition and elution conditions have been optimized.
2 Materials and methods
2.1 Materials
Hexyl acrylate (99%, HeA), 2-(acryloyloxy)ethyltrimethyl ammonium chloride (80%, AETA), 1,3-butanediol diacrylate (98%, BDDA), 3-trimethoxysilylpropyl methacrylate (98%), 2,2’-azobisisobutyronitrile (98%, AIBN), N-[3-trimethoxysilyl)propyl]-N’-(4-vinylbenzyl)ethylenediamine hydrochloride (40% in methanol), phosphoric acid, trifluoroacetic acid, formic acid, sodium tetraborate, sodium dihydrogenophosphate, ammonium bicarbonate, anilines derivatives, drugs, α-cyano-4hydroxycinnamic acid (CHCA, 97%), val-tyr-val, leucine enkephalin acetate hydrate, (YGGFL, 95%), methionine enkephalin acetate salt hydrate, (TGGFM, 97%), luteinizing hormone-releasing hormone (PyrHWSYGLRPG-NH2, 98% min.), and cytochrome c from bovine heart were purchased from Aldrich. Angiotensin I human, (DRVYIHPFHL, >95%), angiotensin II human, (DRVYIHPF, >95%), alytesin (QGRLGTQWAVGHLM, >95%), Somatostatin (AGCKNFFWKTFTSC, >95%), systemin (AVQSKPPSKRDPPKMQTD, > 95%), adrenocorticotropic hormone (ACTH) human, (SYSMEHFRWGKPVGKKRRPVKVYP, >95%) secretin human (HSDGTFTSELSRLREGARLQRLLQGLV, >95%), calcitonin, salmon (CSNLSTCVLGKLSQELHKLQTYPRTNTGSGTP, >95%) were purchased from GenScript Corporation (Piscataway, NJ, USA). HPLC grade acetonitrile, methanol, ethanol, and 2-propanol were obtained from Fischer Scientific. UV transparent Teflon coated fused silica capillaries with an internal diameter of 75 and 100 µm i.d. were from Polymicro Technologies (Phoenix, AZ, USA).
2.2 Preparation of monolithic capillary columns
Monolithic capillary columns were prepared using slightly modified UV-initiated free-radical polymerization described in detail elsewhere [28–29]. Briefly, the capillaries were rinsed with acetone and water using a syringe pump, activated with 0.1 mol/L sodium hydroxide for 30 min, washed with water, followed with 0.1 mol/L HCl for 30 min, then with water again, finally with ethanol and dried in stream of air. The actual surface modification with polymerizable functionalities was achieved by an overnight pumping a 1 : 1 solution of N-[3-trimethoxysilyl)propyl]-N’-(4-vinylbenzyl)ethylenediamine hydrochloride in ethanol through the capillary at a flow rate of 0.25 µL/min. The capillary was then rinsed with ethanol, acetone and dried in a stream of air.
The optimized porous polymer monoliths used in most of the separations were prepared via UV-initiated free-radical polymerization of a mixture consisting of 29.9% hexyl acrylate, 10% 1,3-butanediol diacrylate, 0.1% 2-(acryloyloxy)ethyltrimethyl ammonium chloride (monomers), AIBN (initiator, 0.5% with respect to monomers), 40.2% acetonitrile, 13.4% 5 mmol/L phosphate buffer pH 7.1, and 13.4% ethanol. The polymerization mixture was de-aerated by sonication for 10 min. The 35 cm long surface-modified capillaries were completely filled with the polymerization mixture by capillary action and both ends were covered with rubber stoppers. A ca. 5 mm long part of the capillary was masked with black electrical tape to avoid polymerization and leave open capillary at the location desired for the detection. A microprocessor controlled XL-1500 UV-Crosslinker (Spectroline, Westbury, NY, USA) operating at a wavelength of 365 nm and a total energy of 6 J/cm2 was used to prepare the porous polymer monolith inside the capillary. Once the polymerization was completed, the capillaries were cut to a total length of 33.5 cm. Then, the remaining porogens were removed from the monoliths by washing for 2 h with 20% acetonitrile in 5 mmol/L Tris-phosphate buffer pH = 2.5 using the electrophoretic instrument.
2.3 Electrochromatography
Electrochromatographic separations were carried out using an Agilent 3DCE system (Agilent Technologies, Waldbronn, Germany) equipped with a diode array detector and an external pressurization system. An equal nitrogen pressure of 0.3–0.4 MPa was applied at both ends of the capillary column. Temperature in the cassette compartment was kept at 20 °C. The mobile phase was prepared from an aqueous stock solution of 250 mmol/L Tris-phosphate buffer pH=2.5 by admixing the desired volume of acetonitrile. Formamide was used as the EOF marker. The solution of five alkylbenzenes (5 mmol/L each) used for initial screening was prepared in acetonitrile. The peptides were dissolved in water at a concentration of 0.5–1.5 mg/mL. The sample solutions were injected electrokinetically or hydrodynamically using voltage and pressure, respectively.
In specific experiments, fractions were automatically collected using the fraction collection mode or the method time table program. In this CEC mode, both capillary and electrode were immersed in the mobile phase contained in all vials. Once the programmed fraction was collected, the capillary with the electrode moved to the next vial. In order to limit carry-over, the electrode and capillary tip was rinsed between collection of the next fraction using a 1:1 mixture of water and 2-propanol. The fractions were collected in the same vials after 3–4 repeated injections of the complex sample to afford sufficient quantities of peptides for characterization via mass spectrometry.
2.4 Tryptic digestion
Cytochrome c was dissolved in 50 mmol/L ammonium bicarbonate buffer pH 7.5 and digested at 37°C with sequencing grade trypsin (Promega, Madison, WI, USA). A 1:100 enzyme to protein ratio was used to minimize autodigestion of the trypsin. The digestion reaction was terminated after 17 h by addition of glacial acetic acid leading to a final concentration of 5% (v:v). The digest solution was stored in a freezer at −20 °C.
2.5 Mass spectrometric characterization
Matrix assisted laser desorption ionization mass spectrometry was carried out using a 4800 SCIEX MALDI-TOF-TOF instrument (Applied Biosystem, Foster City, CA, USA). The peptide fractions collected in vials were evaporated under stream of nitrogen and re-dissolved in 2µL of 10 mg/mL CHCA matrix solution in water-2-propanol-formic acid mixture (50:35:15 v/v).
3 Results and discussion
3.1 Preparation of monoliths
Since our ultimate target is a monolithic separation located within a microfluidic chip, we choose photoinitiated polymerization for the preparation of the monolithic capillary columns used in this initial study. We have previously demonstrated that both 2,2-dimethoxy-2-phenylacetophenone (DMPA) and azobisisobutyronitrile are useful photoinitiators for the preparation of monolithic capillary columns [26,30]. The formation of radicals from the former requires UV light with a wavelength of 254 nm while the latter decomposes after irradiation with UV light at 360 nm. Since acrylate and methacrylate monomers absorb light in the 200–300 nm range, autoscreening by the monomers decreases the energy dose and makes initiation with DMPA less efficient. In contrast, the polymerization mixtures are more transparent at 360 nm thus enabling a faster photopolymerization. We also observed that repeatability of the polymerization photoinitiated with AIBN at 360 nm is excellent [31]. Therefore, all polymerizations were carried out using this initiator at 360 nm.
A variety of mixtures consisting of hydrophobic methacrylates or acrylates and 2-(acryloyloxy)ethyltrimethyl ammonium chloride were polymerized in order to obtain monoliths with positively charged functionalities affording the desired high efficiency separations of peptides in CEC mode. In general, methacrylate monomers did not afford monoliths with sufficient retention, resolution and efficiency despite our attempts at varying the alkyl chain length of the monovinyl monomer and the nature and composition of the porogens. This difference most likely results from unfavorable reactivity ratios of copolymerization of methacrylates with an acrylate-based ionizable monomer 2-(acryloyloxy)ethyltrimethyl ammonium chloride. In addition, the polymerization process was slow requiring irradiation times of up to 1 h to be completed. In contrast, monolithic columns prepared from acrylates afforded good chromatographic performance in CEC mode. This result is in agreement with observations described in the literature [29,32]. Our initial tests utilized butyl, hexyl, and isooctyl acrylates as monovinyl monomers. As expected, hexyl acrylate based monolithic columns exhibited stronger retention than their butyl acrylate counterparts, yet, surprisingly, the use of isooctyl acrylate, with its even longer alkyl chain did not afford better performing monoliths. As a result of these preliminary screening experiments, a polymerization mixture consisting of hexyl acrylate, 1,3-butanediol diacrylate, 2-(acryloyloxy) ethyltrimethyl ammonium chloride, azobisisobutyronitrile, acetonitrile, phosphate buffer, and ethanol as specified in the Experimental Section, was used throughout this work.
3.2 Estimation of porosity
The porous properties of the monolithic stationary phases are critical for their successful application in chromatographic separations. Porosity is one of the typical characteristics of all monolithic stationary phases enabling direct comparison of different columns. However, it is difficult to measure these properties because the amount of material contained in the capillary column is very small. Most often, the mixture used for the preparation of the capillary column is also polymerized in a larger mold to obtain an amount of polymer sufficient for use with techniques such as mercury intrusion porosimetry or nitrogen adsorption/desorption [26]. However, these measurements are carried out with monolith in the dry state and the porous properties may differ from those that exist under the working conditions, i.e. with pores filled with the mobile phase. Therefore, several alternative methods have been tested to estimate the porosity of monolithic capillaries. These include for example the measurement of the weight difference between the capillary with pores filled with air and pores filled with a liquid, the measurement of the back pressure difference while pumping the mobile phase through an open capillary or a capillary filled with the monolithic stationary phase, or the difference in conductivity between an empty and a monolithic capillary filled with an electrolyte [33–35]. We prefer the last method since such “porosity measurement” is implemented using an electric field in the instrument under conditions similar to those used in the actual CEC separations. Specifically, both an open capillary and the monolithic CEC column of identical dimensions are filled with the mobile phase, voltage is applied and the current Iopen and Ifilled measured [33]. These currents are used to obtain conductivity ratio, Φ:
| (1) |
The apparent total porosity, εT, is then calculated from the conductivity ratio using Archie’s equation [34,36]:
| (2) |
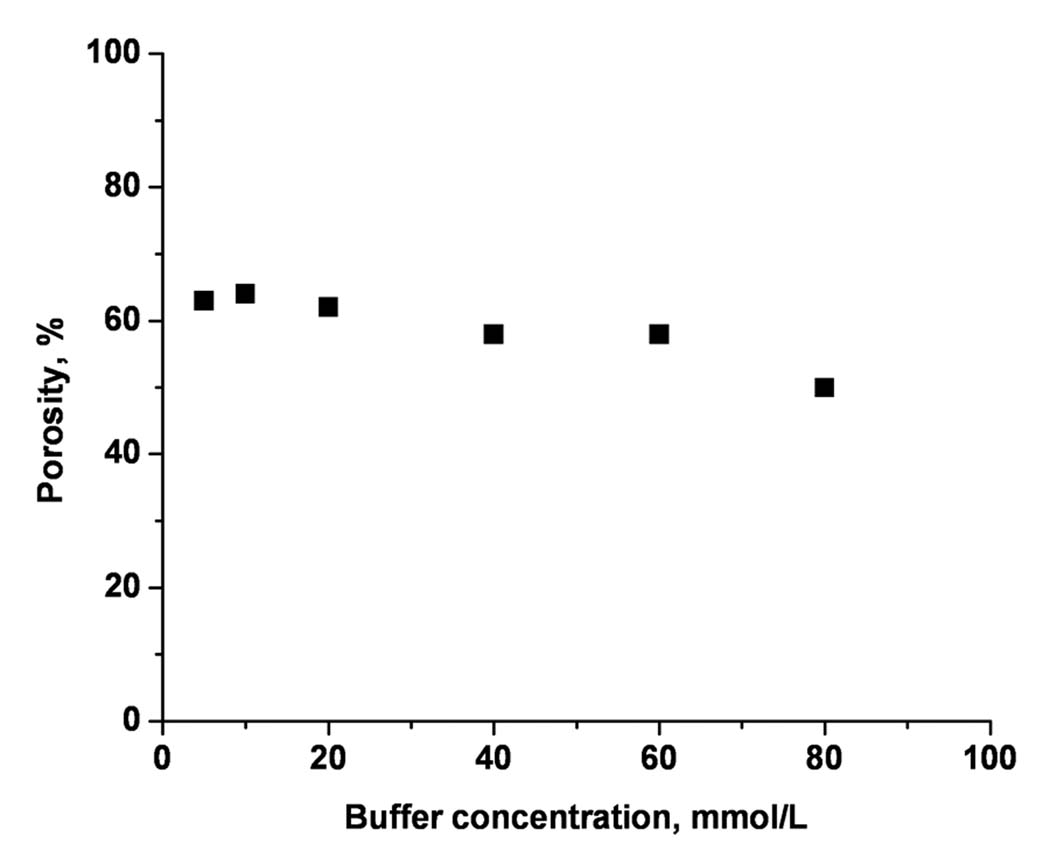
This simple technique also provides a rough estimate of the quantity of small pores in the stationary phase. The thickness of the electrical double layer generated within the stationary phase increases with a decrease in the ionic strength of the mobile phase. At a certain buffer concentration the double layers in small pores overlap and the conductivity of these pores no longer contributes to the measured current. This effect then translates in a decrease in the apparent total porosity.
Figure 1 shows the apparent total porosity as a function of the Tris-phosphate buffer concentration in the range of 5–80 mmol/L. The apparent total porosity of our columns varies between 62 and 55%. These values are in a good agreement with the 60% content of porogenic solvent present in the polymerization mixture and suggests that the electrical double layer does not overlap appreciably within the measured concentration range. This result also suggests that the monoliths do not include a significant amount of small pores, a feature valued most in the separation of larger molecules.
Figure 1.
Total porosity estimated from the monolithic column conductivity as a function of the overall buffer concentration in the mobile phase. Conditions: Poly(hexyl methacrylate-co-1,3-butenediol dimethacrylate-co-2-(acryloyloxy) ethyltrimethyl ammonium chloride) monolithic column, total length 33.5 cm, active length 25 cm, 100 µm i.d. Mobile phase: 40:60 v/v acetonitrile –Tris phosphate buffer pH 2.5. Voltage: −15 kV.
3.3 Electroosmotic flow
The electroosmotic flow driving the mobile phase in CEC is generated by the ionized functionalities located at the surface of the stationary phase. The apparent electroosmotic mobility µeo,app, which, in capillary electrophoresis, is related to the electroosmotic flow, can be expressed as:
| (3) |
where L is the total length of the capillary, l is the length between the injection and detection point, V is the voltage applied across the capillary, and teo is the time required for an uncharged and unretained compound that migrates strictly with the EOF to reach the detector. However, equation 3 does not take into account the presence of the stationary phase in the capillary that acts as an obstacle in the EOF path. Therefore an alternative expression was derived [33,37,38]:
| (4) |
this equation now includes the length of the actual flow path Le followed by a marker through the stationary phase; Le is calculated as:
| (5) |
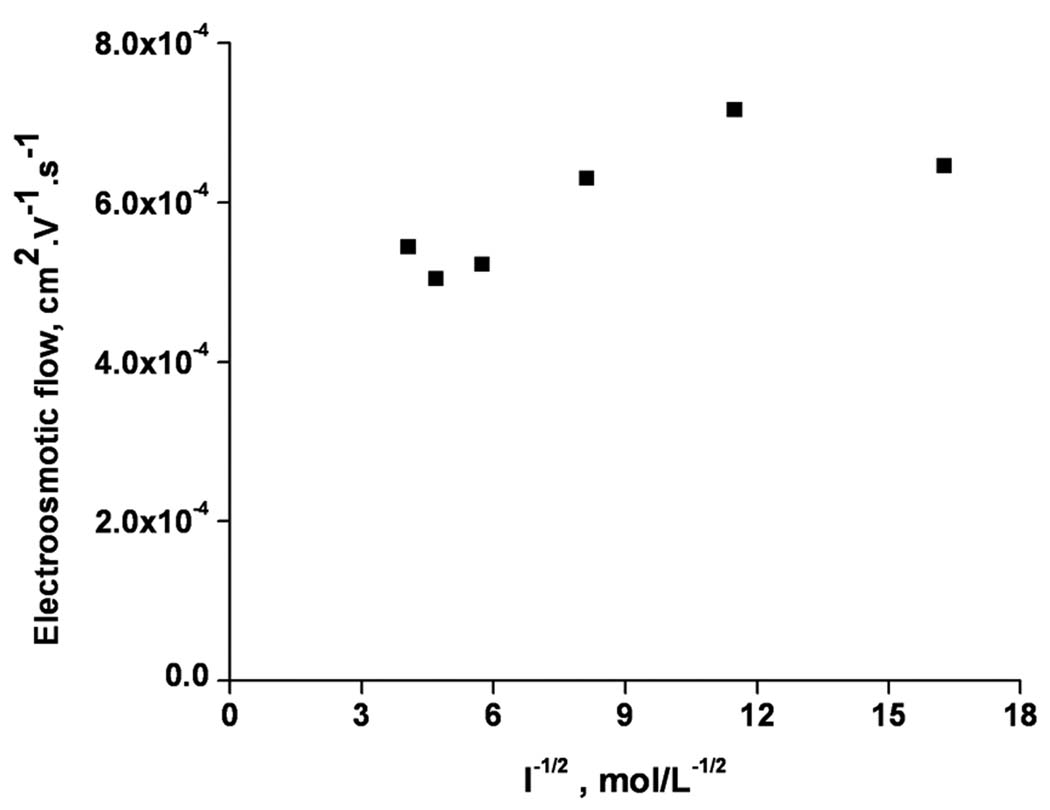
Since our monolithic columns bear strong cationic quaternary ammonium functionalities, they drive an anodic flow in the entire range of pH values. The absolute value of the electroosmotic mobility calculated from equation 4 varies in a narrow range from 5 to 7 ×10⁻⁴ cm2.V−1.s−1. No significant change in the mobility was observed even after increasing the acetonitrile content in the mobile phase from 20 to 60% in a 60 mmol/L buffer.
In contrast, increasing the ionic strength of the mobile phase while keeping percentage of acetonitrile constant at 40% leads to the expected decrease in the electroosmotic mobility. Figure 2 shows this effect while varying the ionic strength between 10 and 80 mmol/L representing a range of 6–12 (mmol/L)−1/2. Although the plot confirms the decrease in the EOF, its deviation from linearity at higher ionic strength indicates that Joule heating is likely to affect the EOF at high buffer concentration.
Figure 2.
Absolute values of electroosmotic flow calculated from elution time of unretained formamide using the actual length of the flow path as a function of the buffer concentration in the mobile phase. Conditions: Poly(hexyl methacrylate-co-1,3-butenediol dimethacrylate-co-2-(acryloyloxy) ethyltrimethyl ammonium chloride) monolithic column, total length 33.5 cm, active length 26 cm, 100 µm i.d. Mobile phase: 40:60 v/v acetonitrile –Tris phosphate buffer pH 2.5. Electrokinetic injection −3 kV, 3 s. Voltage: −15 kV.
3.4 Performance and repeatability
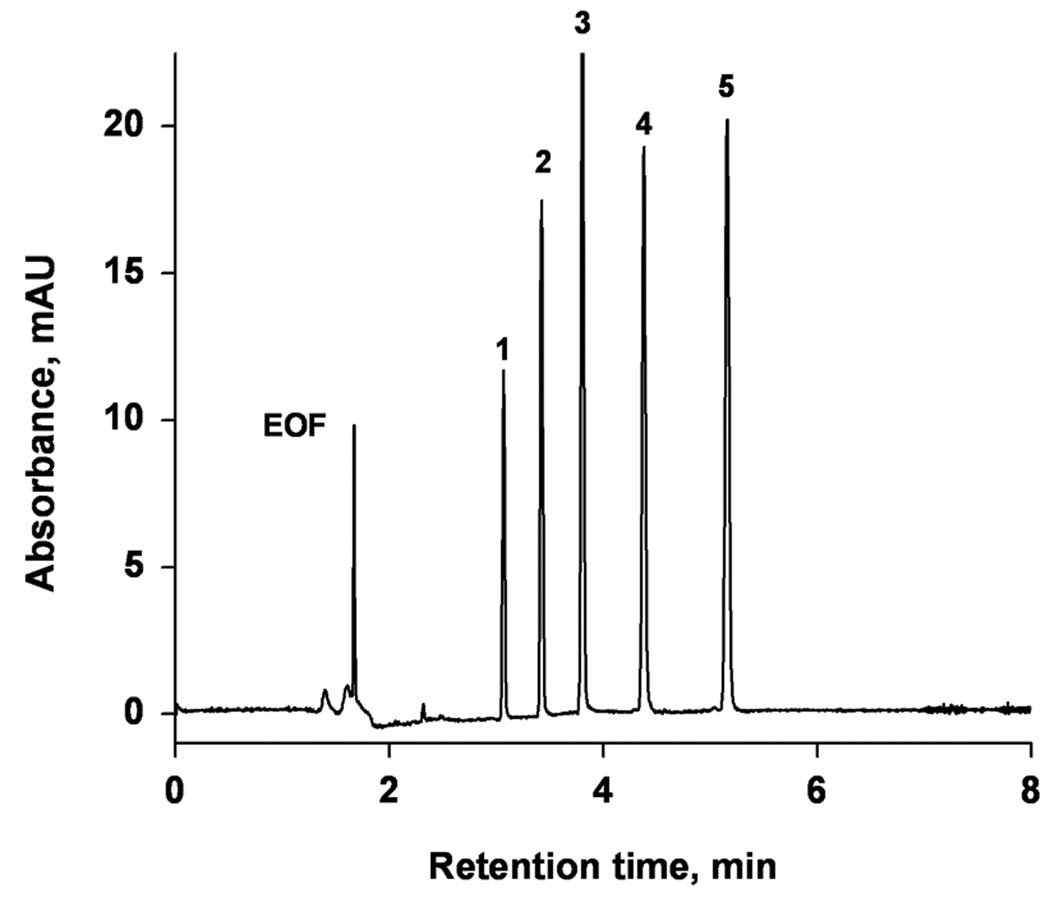
A mixture of five alkylbenzenes was used to test the performance of the monolithic columns; an example of the separation that is obtained is shown in Figure 3. This chromatogram documents an excellent separation with a column efficiency of 250,000–320,000 plates/m. Typically, the mixture was injected three times in each column with a relative standard deviation (RSD) of 1% for the variations in the electroosmotic mobility, 1% for the retention factor k, and 1.5–3% for the plate number N for each peak, demonstrating a good injection-to-injection repeatability.
Figure 3.
Electrochromatographic separation of alkylbenzenes using monolithic capillary column. Conditions: Poly(hexyl methacrylate-co-1,3-butenediol dimethacrylate-co-2-(acryloyloxy) ethyltrimethyl ammonium chloride) monolithic column, total length 34.5 cm, active length 26 cm, 100 µm i.d. Mobile phase: 80:20 v/v acetonitrile −5 mmol/L sodium phosphate buffer pH 6.8. Electrokinetic injection 3 kV, 3 s. Voltage: −30 kV. 1- benzene, 2- toluene, 3- ethylbenzene, 4- propylbenzene, 5- butylbenzene.
The preparation of monolithic capillary columns was repeated with three polymerization mixtures having identical composition but prepared separately with two columns polymerized from each mixture. The calculated RSD characterizing the batch-to-batch repeatability were 8% for the electroosmotic mobility, less than 3.5% for the retention factors, and 9.5–10% for the plate height. These values are similar to those found previously for monolithic CEC columns [39,40].
3.5 Separation of ionizable compounds
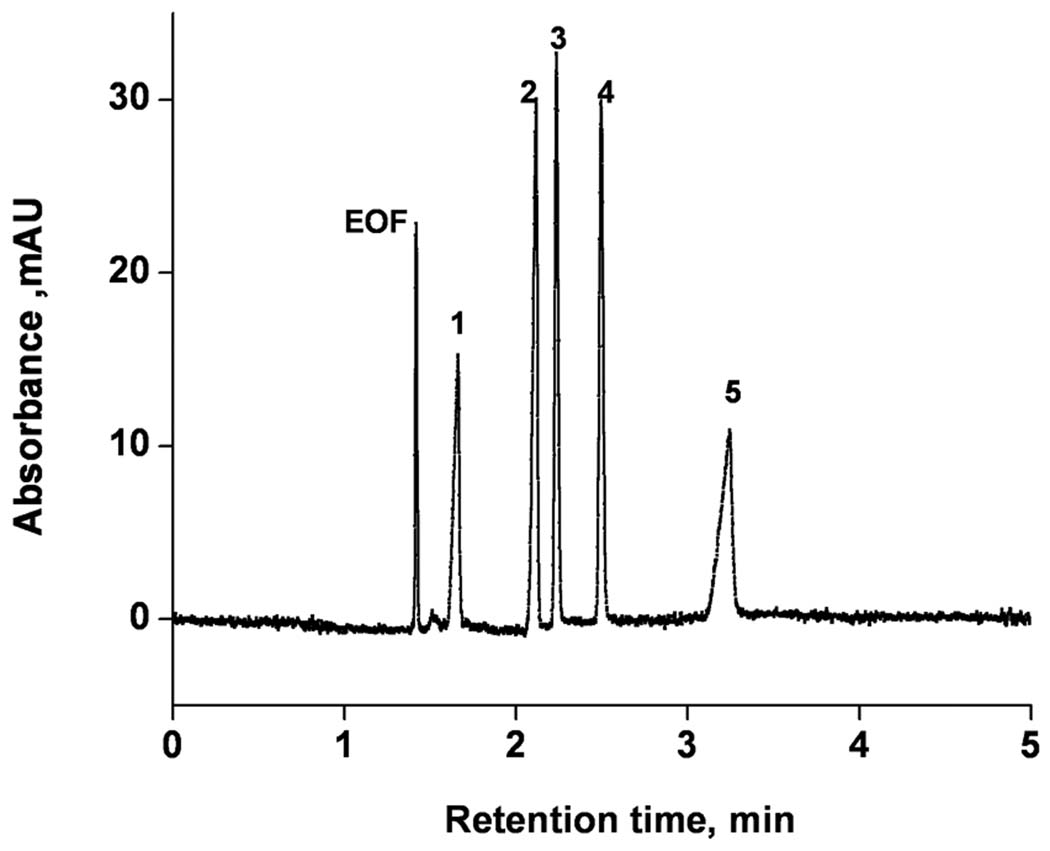
The mechanism enabling the separation of ionized solutes is more complex than that typical of neutral compounds such as alkylbenzenes. While the electroosmotic flow remains the driving force for the mobile phase and the solutes may interact with the stationary phase to achieve retention, they also migrate through the column driven by their electrophoretic mobility that depends on their size and charge. The separation then results form a combination of all of these processes. Figure 4 shows the separation of five aniline derivatives - weak bases with pKB ranging from 4 to 9 - using the mobile phase consisting of 2:8 mixture of 25 mmol/L sodium phosphate buffer pH 2.1 and acetonitrile. All components of the mixture are at least partially dissociated and positively charged at this pH. The separation was achieved in less than 7 min at a flow velocity of 3.05 mm/s as measured using non-retained neutral formamide and a remarkably high column efficiency of up to 62,000 plates/column was observed.
Figure 4.
Electrochromatographic separation of anilines derivatives using monolithic capillary column. Conditions: Poly(hexyl methacrylate-co-1,3-butenediol dimethacrylate-co-2-(acryloyloxy) ethyltrimethyl ammonium chloride) monolithic column, total length 34.5 cm, active length 26 cm, 100 µm i.d. Mobile phase: 80:20 v/v acetonitrile −25 mmol/L Tris phosphate buffer pH 2.1; Electrokinetic injection −3 kV, 3 s; Voltage: −30 kV; EOF marker. UV detection at 200 nm. Peaks: 1- 3,4,5-trimethyloxyaniline, 2- aniline, 3-benzyloxyaniline, 4- phenoxyaniline, 5- 2,4-dimethyloxyaniline.
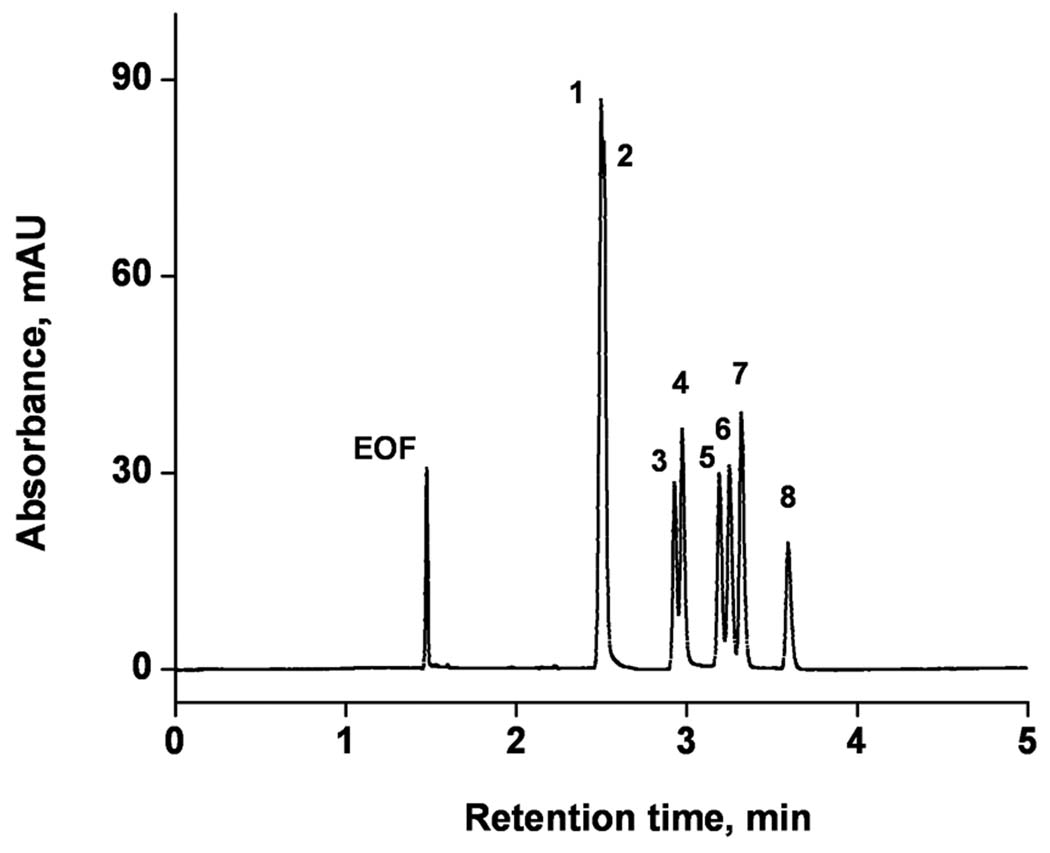
The separation of a mixture consisting of moderately to strongly basic drugs is shown in Figure 5. All components of this mixture are completely dissociated at pH 2.5 since their pKa is higher than 8. The optimized mobile phase used in this separation was a 4:6 mixture of 40 mmol/L Tris phosphate buffer pH 2.5 and acetonitrile. The separation was completed in less than 5 min at a flow velocity of 2.83 mm/s. The efficiency of 70,000–80,000 plates per 26 cm long column equaling over 300,000 plates/m is even higher than that found for the anilines.
Figure 5.
Electrochromatographic separation of basic drugs using monolithic capillary column. Conditions: Poly(hexyl methacrylate-co-1,3-butenediol dimethacrylate-co-2-(acryloyloxy) ethyltrimethyl ammonium chloride) monolithic column, total length 34.5 cm, active length 26 cm, 100 µm i.d. Mobile phase: 80:20 v/v acetonitrile −40 mmol/L Tris phosphate buffer pH 2.5; Electrokinetic injection −3 kV, 3 s; Voltage: −30 kV; EOF marker formamide. UV detection at 214 nm. Peaks: 1- labetalol, 2- alprenolol, 3- bupivacaine, 4- mepivacaine, 5- lidocaine, 6- nefopam, 7- ketamine.
3.6 Separation of peptides
Since our ultimate target is the separation of mixtures of peptides resulting from protein digestion, we first tested performance of the monolithic columns using a simple mixture of three peptides val-tyr-val, methionine enkephalin, and LHRH. These peptides were selected to cover a wide range of size, pI, and hydrophobicity; Table 1 summarizes characteristics their characteristics.
Table 1.
Peptides used for testing performance of monolithic capillary columns.
| Peptide | Val-Tyr-Val | Methionine enkephalin | LHRH d) |
|---|---|---|---|
| Nr. of amino acid | 3 | 5 | 10 |
| Mol. mass, g/mol | 379.45 | 573.66 | 1182.29 |
| pI a) | 5.92 | 5.93 | 7.76 |
| Net charge a) | 0.41 | 0.41 | 2.40 |
| Hydrophobicity b) | - | 0.52 | −1.28 |
| Frictional ratio c) | 7.82×10⁻³ | 5.94×10⁻³ | 2.15×10⁻² |
Isoelectric point pI and net charge at pH 2.5 calculated using the “Gateway to Isoelectric Point Service” (www.embl-heidelberg.de).
Hydrophobicity estimated using the Protparam tool (www.expasy.org).
Frictional ratio ζfrict was calculated using equation ζfrict= q/M 2/3 where q is the net charge and M is the molecular mass of the peptide
Luteinizing hormone releasing hormone.
3.6.1 Effect of the mobile phase composition and pH
To find the optimal mobile phase for the separation of peptides, we tested acidic buffers consisting of sodium formate (pH= 3.8), Tris phosphate (pH=2.5), sodium phosphate (pH= 2.1), and sodium trifluoroacetate (pH= 1.7) at two concentration levels (10 and 20 mmol/L). All of these buffers have pH values significantly lower than the pI values of the peptides. At these pH values, both peptides and stationary phase are positively charged and the electrostatic interactions between them are limited. An anodic EOF is observed under these conditions. We found that the ions constituting the buffer solution affect significantly the separation performance. For example, the use of sodium trifluoroacetate leads to unstable current and a noisy baseline. In addition, considerable peak tailing was observed with all sodium containing buffers. This effect appears to be related to the mobility of the cations. While sodium in the sodium phosphate buffer features a high mobility, the Tris cation migrates slower and the shape of the eluted peaks is more symmetrical. Therefore, Tris phosphate buffer solution was used throughout the rest of this study.
We also tested a basic sodium borate buffer pH=10 within the concentration range of 5–60 mmol/L All three peptides are negatively charged at this pH and tend to migrate to the anode. However, they also interact electrostatically with the positively charged stationary phase. Although these interactions affect the separation, a baseline separation can be achieved with high column efficiencies of 75,000, 60,000, and 40,000 plates/column for methionine enkephalin, val-tyr-val, and LHRH, respectively.
3.6.2 Retention
The separation of ionized analytes in CEC mode occurs as a result of the simultaneous occurrence of both electrophoretic and chromatographic processes. Therefore the retention factor describing the interaction between the solutes and the stationary phase must take into account both of these contributions. The retention factor k* for an ionized solute separated in CEC is then [17,37,38,41–43]:
| (6) |
where tm is the migration time of the solute, t0 is the migration time of the unretained marker, and kep* is the velocity factor defined as:
| (7) |
where µeo the electroosmotic mobility and µep is the electrophoretic mobility of the solute. The electroosmotic mobility in the monolithic column, µeo, is calculated using equation 4 while the electrophoretic mobility is determined from electrophoretic measurements carried out in an empty capillary using the same conditions as used in the CEC experiments. The equation used for the calculation of the retention factor of a neutral compound with no electrophoretic mobility k* lc is that typical of liquid chromatography:
| (8) |
It is worth of noting that the retention factor k* cannot be used as the peak locator as it includes the contribution of factor k* ep which differs for each compound‥ Therefore, the values klc* obtained from equation 8 that specify the elution order are most often used even for ionized compounds.
Table 2 shows all three retention factors calculated using equations 6, 7, and 8 for all peptides using the mobile phase consisting of acetonitrile and buffer solution with a concentration of 5–100 mmol/L. The retention factors k* and klc* are rather low having values of less than 0.54 that change very little despite the broad range of buffer concentrations. Under conditions typical of reversed phase separation, an increase in the ionic strength should favor hydrophobic interactions by reducing the electrostatic interactions between the stationary phase and the solutes thus leading to stronger retention. However, our findings suggest that the migration of peptides through the monolithic column is mostly affected by their electrophoretic mobility and less by interactions with the stationary phase.
Table 2.
Effect of buffer concentration on retention factors of peptides. Conditions: Mobile phase: 40% acetonitrile in Tris-phosphate buffer pH 2.5; column: HA-BDDA-AETA monolith, total length 33.5 cm, active length 25 cm, i.d. 75 µm, voltage −30 kV.
| Buffer | Methionine enkephalin | val-tyr-val | LHRH d) | ||||||
|---|---|---|---|---|---|---|---|---|---|
| mmol/L | k* a) | k*epb) | k*lcc) | k* | k*ep | k*lc | k* | k*ep | k*lc |
| 5 | 0.02 | −0.16 | 0.21 | 0.06 | −0.21 | 0.35 | 0.13 | −0.26 | 0.54 |
| 10 | 0.03 | −0.15 | 0.21 | 0.06 | −0.21 | 0.33 | 0.08 | −0.25 | 0.44 |
| 20 | 0.03 | −0.20 | 0.29 | 0.12 | −0.22 | 0.44 | 0.12 | −0.25 | 0.51 |
| 40 | - | - | - | −0.05 | −0.33 | 0.43 | 0.14 | −0.23 | 0.48 |
| 60 | 0.05 | −0.18 | 0.28 | 0.09 | −0.24 | 0.44 | 0.11 | −0.24 | 0.47 |
| 80 | 0.11 | −0.14 | 0.29 | 0.18 | −0.19 | 0.46 | - | - | - |
| 100 | 0.11 | −0.14 | 0.29 | 0.02 | −0.31 | 0.47 | - | - | - |
Electrochromatographic retention factor.
Velocity factor.
Liquid chromatographic retention factor.
Luteinizing hormone releasing hormone.
Similarly, variations in the percentage of acetonitrile in the mobile phase should affect both chromatographic retention and electrophoretic mobility of the peptides as well as the electroosmotic flow. The buffer concentration was kept constant at 60 mmol/L resulting in an equal ionic strength of the mobile phase in all these experiments while the percentage of acetonitrile varied in a range 20–60%. Despite this broad range, no significant change in electroosmotic flow measured from the elution time of the marker was observed and the flow velocity remained stable at 1.1 mm/s demonstrating that EOF is not noticeably affected by the acetonitrile content of the mobile phase.
Since the monolithic stationary phase contains a large percentage of hydrophobic hexyl acrylate, it should exhibit attributes typical of a reversed phase separation. For example, hydrophobic interactions should be enhanced when decreasing the acetonitrile content in the mobile phase while the electrostatic interactions should be diminished due to the high percentage of buffer. However, Table 3 shows that the retention factors, klc * are quite small and do not vary despite the broad range of acetonitrile concentrations. These experiments indicate that reversed phase is not the prevailing separation mechanism for the tested peptides. In contrast, decreasing the acetonitrile content leads to a significant improvement in the column efficiency. For example, for val-tyr-val the efficiency increases from 60 000 to 120 000 plates suggesting that mobile phases with a high buffer content afford more efficient separations and increase the peak capacity.
Table 3.
Effect of acetonitrile content in the mobile phase on chromatographic retention factors of peptides. Conditions: Mobile phase: acetonitrile in 60 mmol/L Tris-phosphate buffer pH 2.5; column: HA-BDDA-AETA monolith, total length 33.5 cm, active length 25 cm, i.d. 75 µm, voltage −30 kV.
| Retention factor, klc | |||
|---|---|---|---|
| ACN% | |||
| val-tyr-val | Methionine enkephalin |
LHRH a) | |
| 20 | 0.49 | 0.33 | 0.63 |
| 40 | 0.48 | 0.31 | 0.53 |
| 60 | 0.60 | 0.33 | 0.48 |
Luteinizing hormone releasing hormone.
3.6.3 Resolution and separation efficiency
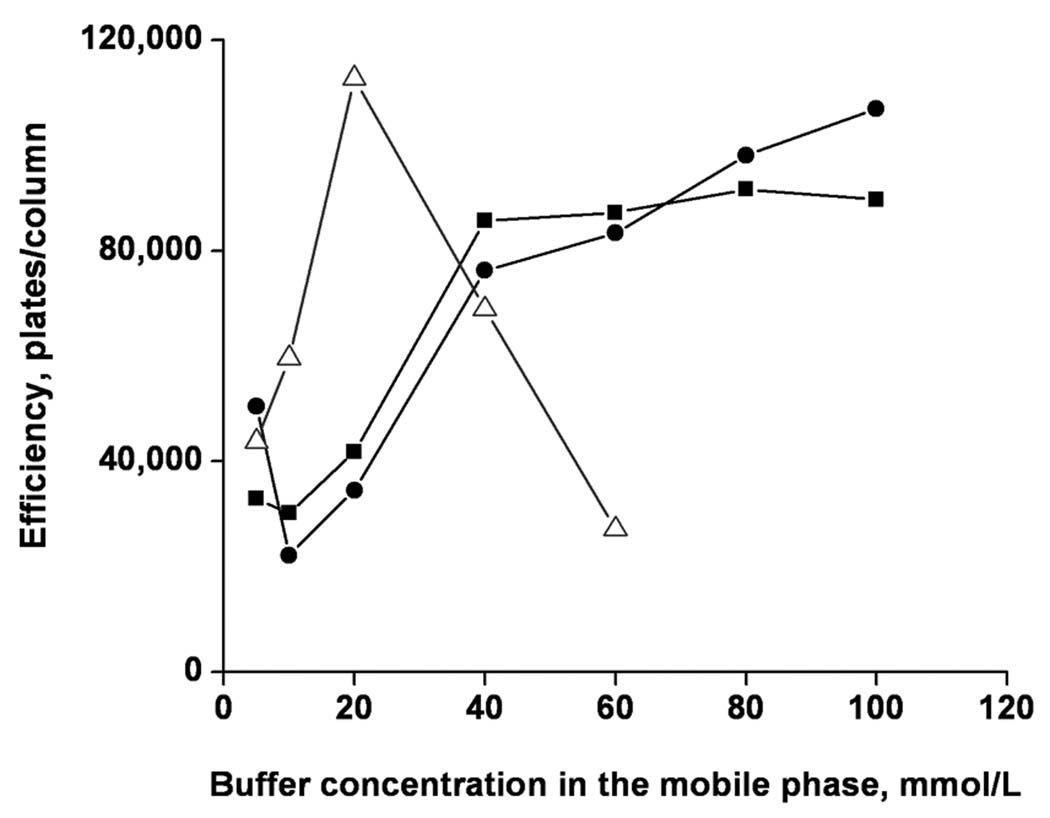
The overall concentration of buffer in the mobile phase also affects both resolution and column efficiency as demonstrated in Figure 6. The effect is similar for val-tyr-val and methionine enkephalin. For example, the column efficiency for methionine enkephalin increases from about 20,000 to over 100,000 plates/column and then levels off. However, a different profile was found for LHRH. The plot reaches a maximum of 115,000 plates/column at a buffer content of 20 mmol/L and at a higher buffer concentration in the mobile phase rapidly decreases to 20,000 plates. This significant difference clearly underlines the need for a careful optimization of the separation conditions in order to achieve a good separation for all peptides in the mixture. In the case of this simple separation, the optimum appears to be at a buffer concentration of 40 mmol/L.
Figure 6.
Effect of the overall buffer concentration in the mobile phase on the column efficiency for the separations of met-enkephalin (circles), val-tyr-val (square), LHRH (triangles). Conditions: Poly(hexyl methacrylate-co-1,3-butenediol dimethacrylate-co-2-(acryloyloxy) ethyltrimethyl ammonium chloride) monolithic column, total length 33.5 cm, active length 25 cm, 100 µm i.d. Mobile phase: 40:60 v/v acetonitrile –Tris phosphate buffer pH 2.5; Electrokinetic injection −3 kV, 3 s; Voltage: −15 kV; UV detection at 200 nm.
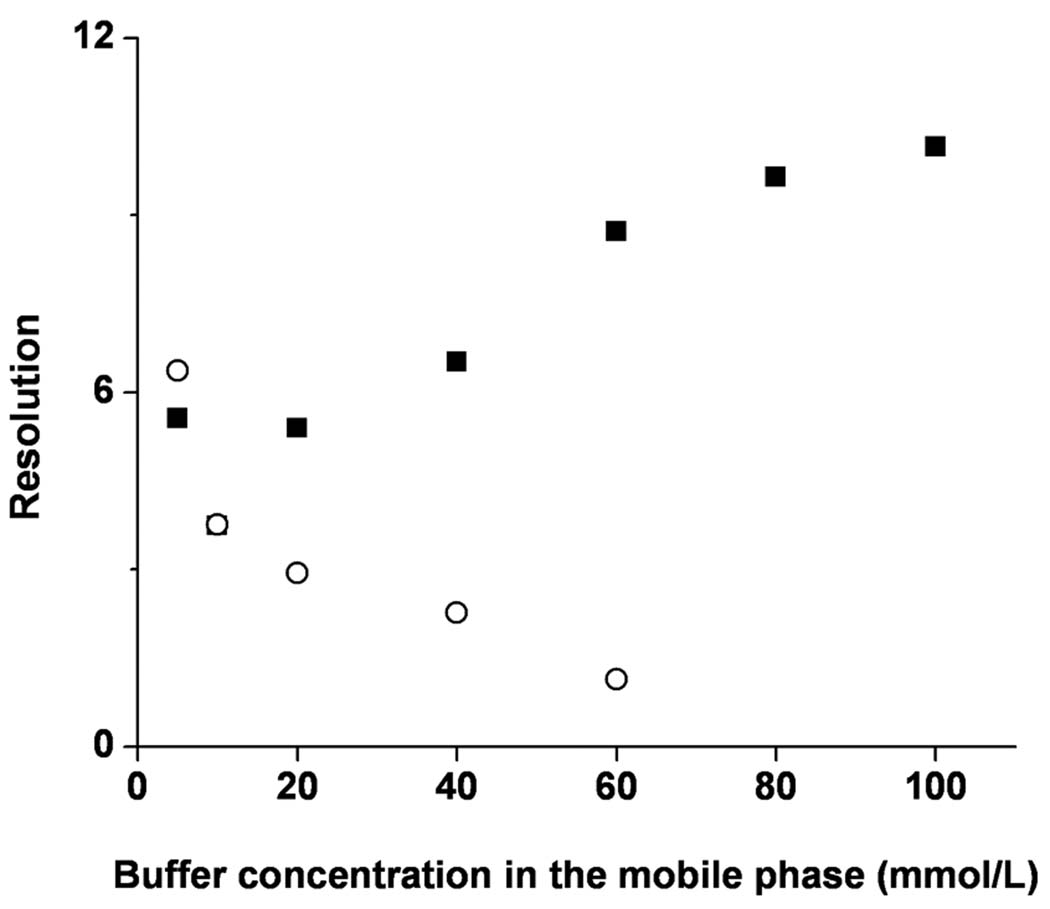
The ionic strength of the mobile phase also affects resolution. Figure 7 shows that resolution for met-enk and val-tyr-val increases with increasing overall buffer concentration, while resolution for val-tyr-val and LHRH decreases. This difference results from the effect of the overall buffer concentration on both migration and retention as shown previously in Table 2 and Table 3. The chromatographic retention, klc * increases for val-tyr-val but drops for LHRH. As the location of the peaks moves and the peak for LHRH gets broader, the resolution of these two compounds deteriorates. Once again, a careful optimization of the mobile phase composition is a prerequisite for a good separation of complex peptide mixtures.
Figure 7.
Effect of the overall buffer concentration in the mobile phase on the resolution of sample pairs: methionin enkephalin and val-tyr-val (squares) and val-tyr-val and LHRH (circles). Conditions: Poly(hexyl methacrylate-co-1,3-butenediol dimethacrylate-co-2-(acryloyloxy) ethyltrimethyl ammonium chloride) monolithic column, total length 33.5 cm, active length 25 cm, 100 µm i.d. Mobile phase: 40:60 v/v acetonitrile –Tris phosphate buffer pH 2.5; Electrokinetic injection −3 kV, 3 s; Voltage: −15 kV; UV detection at 200 nm.
3.6.4 Separation of complex peptide mixtures
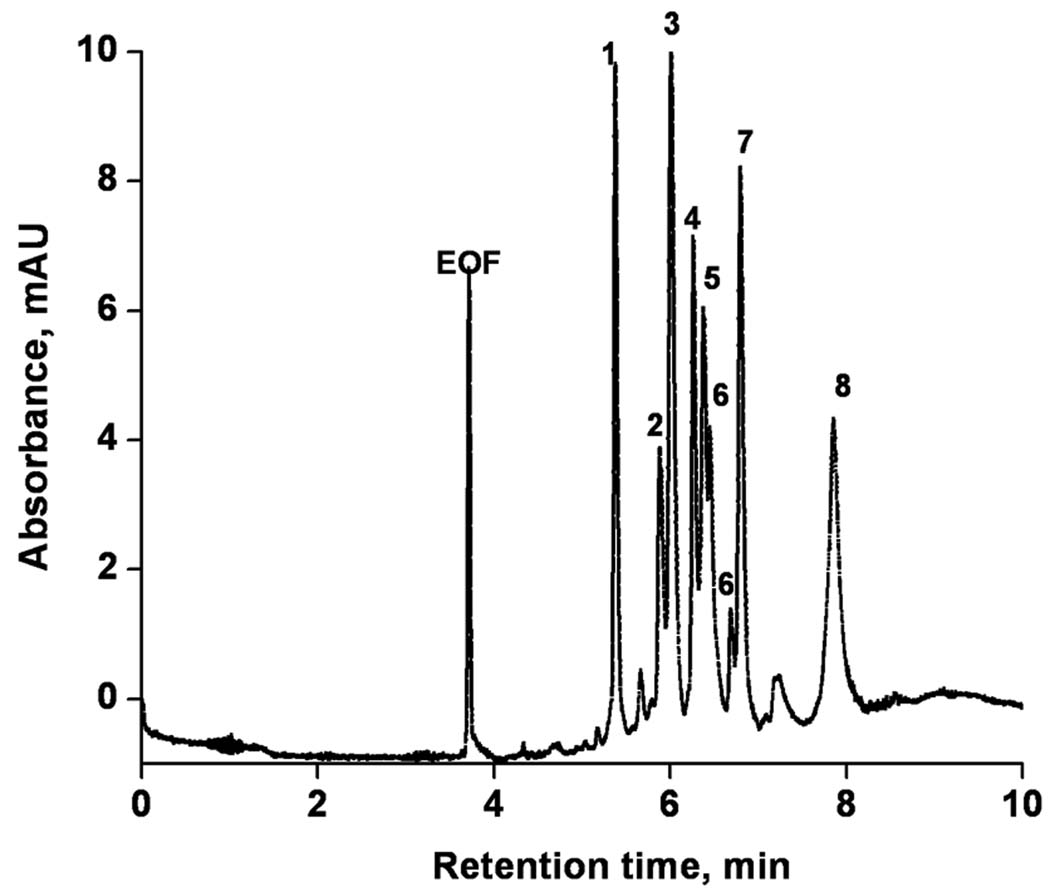
To demonstrate the ability of our column to separate complex peptides mixtures, we first modeled this type of separation using an artificial mixture of eight peptides comprising 5 to 40 amino acid residues using the mobile phase composed of 40% acetonitrile in 80 mmol/L Tris phosphate buffer. The separation shown in Figure 8 is achieved in less than 10 min with efficiencies ranging from 25,000 to 95,000 plates.
Figure 8.
Electrochromatographic separation of peptides using monolithic capillary column. Conditions: Poly(hexyl methacrylate-co-1,3-butenediol dimethacrylate-co-2-(acryloyloxy) ethyltrimethyl ammonium chloride) monolithic column, total length 34.5 cm, active length 26 cm, 100 µm i.d. Mobile phase: 60:40 v/v acetonitrile −80 mmol/L Tris phosphate buffer pH 2.5; Hydrodynamic injection 0.4 MPa, 45 s; Voltage: −15 kV; EOF marker formamide. UV detection at 200 nm.Peaks: 1- alytesin, 2- calcitonin, 3-somatostatin, 4- angiotensin II, 5- systemin, 6- secretin, 7- angiotensin I, 8-adrenocorticotropic hormone.
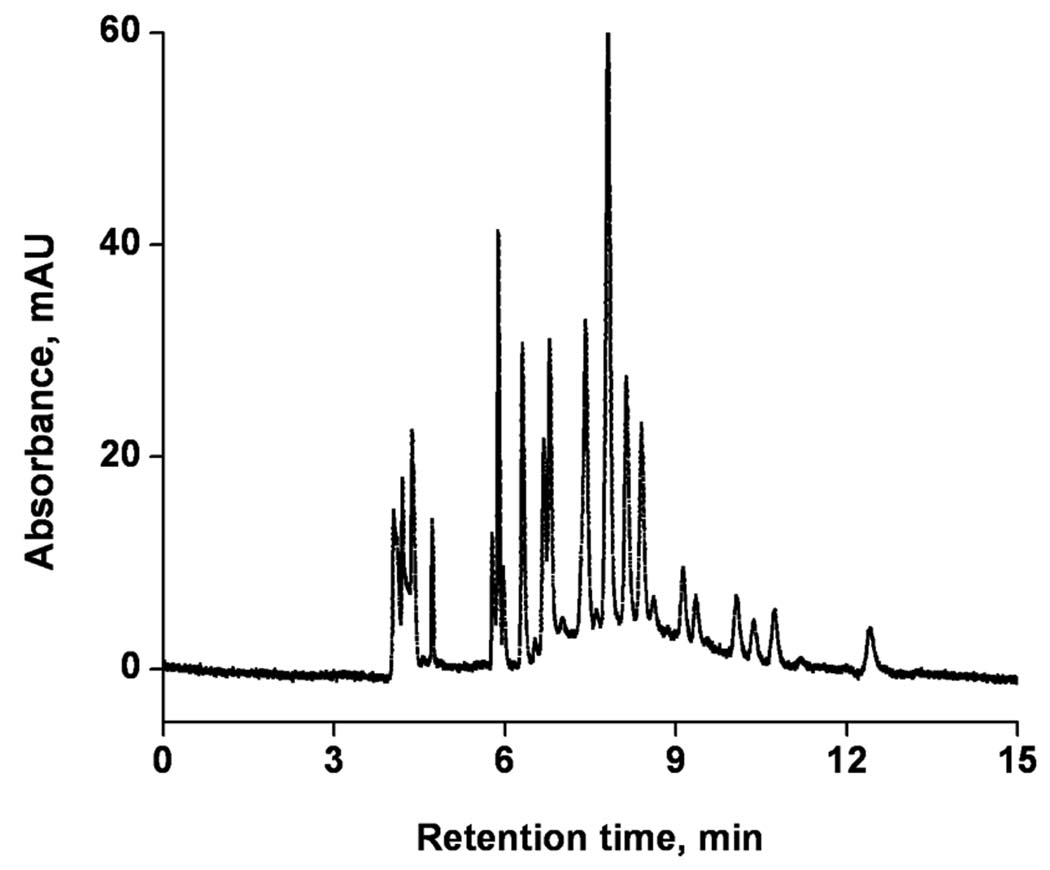
The ultimate mixture we separated was a tryptic digest of cytochrome c. Figure 9 shows that the separation of this peptide mixture is completed in less than 14 min using a 26 cm long monolith and conditions optimized for the previous separations. Once again, a high column efficiency of up to 160,000 plates/column enables excellent resolution.
Figure 9.
Electrochromatographic separation of tryptic digest of cytochrome C using monolithic capillary column. Conditions: Poly(hexyl methacrylate-co-1,3-butenediol dimethacrylate-co-2-(acryloyloxy) ethyltrimethyl ammonium chloride) monolithic column, total length 34.5 cm, active length 26 cm, 100 µm i.d. Mobile phase: 60:40 v/v acetonitrile −80 mmol/L Tris phosphate buffer pH 2.5; Hydrodynamic injection 0.4 MPa, 45 s; Voltage: −15 kV; EOF marker formamide. UV detection at 200 nm.
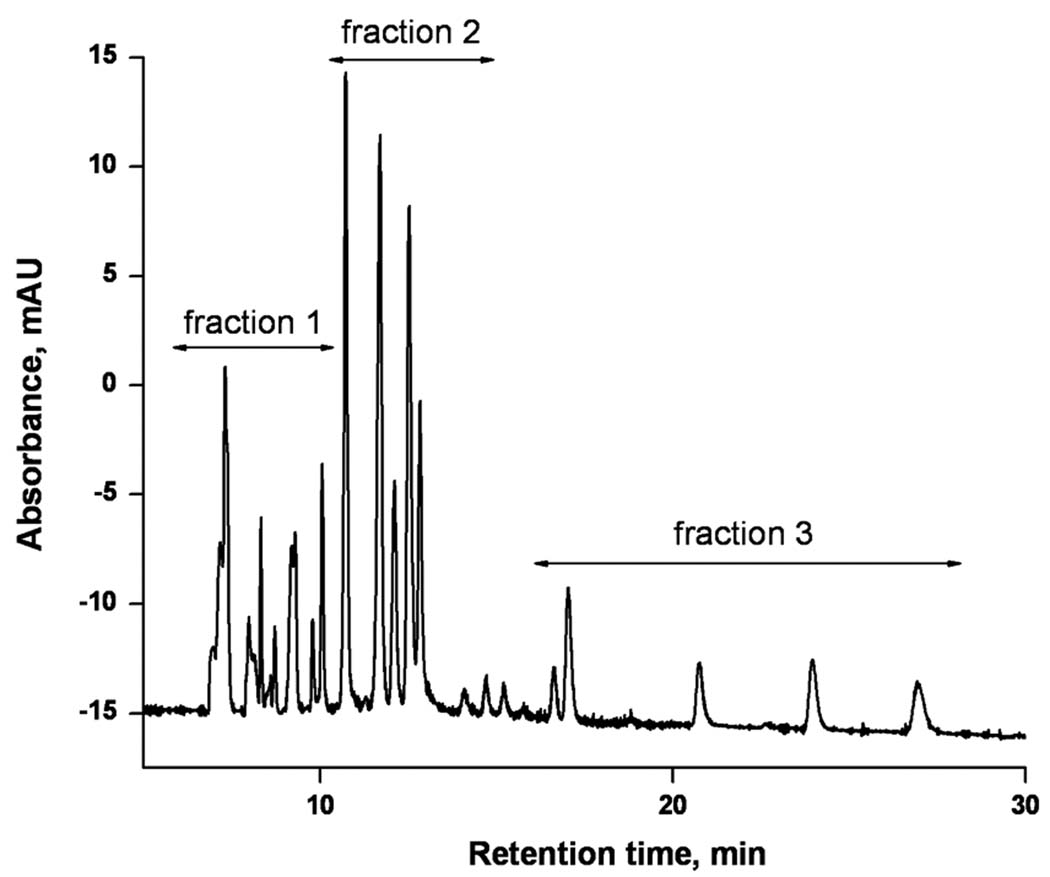
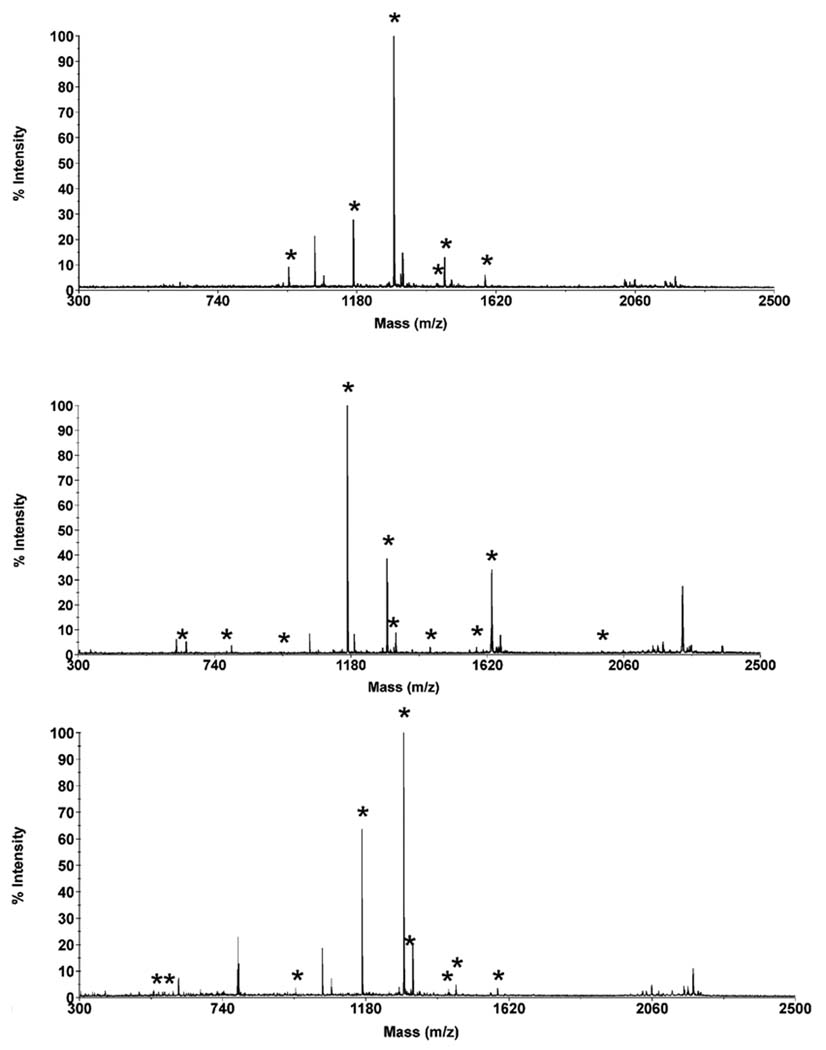
The separation of peptides originating from a protein digest, no matter how perfect it might be, is useless unless molecular masses can be assigned to the separated peptides or their fragments in MS and MS-MS mode, respectively, in order to characterize their sequence. Since our instrumentation does not allow in-line coupling of CEC with a mass spectrometer, we separated the eluent in three fractions and characterized each separately using matrix assisted laser desorption ionization time-of-flight mass spectrometry (MALDI TOF MS). In contrast to electrospray ionization that is sensitive to the presence of salts in the mobile phase, MALDI does not require the use of volatile buffer components. The mass spectra of all three fractions shown in Figure 10 together with the MASCOT search enable a positive identification of 13 different peptides as listed in Table 4. The excellent sequence coverage of 87% that was achieved demonstrates the good performance of our CEC-MALDI MS approach.
Figure 10.
Electrochromatogram of the separation of a tryptic digest of cytochrome c using a long monolithic capillary column followed by collection of three fractions of eluent. Conditions: Poly(hexyl methacrylate-co-1,3-butenediol dimethacrylate-co-2-(acryloyloxy)ethyltrimethyl ammonium chloride) monolithic column, total length 72 cm, active length 64.5 cm, 100 µm i.d. Mobile phase: 30:70 v/v acetonitrile −40 mmol/L Tris phosphate buffer pH 2.5; Hydrodynamic injection 0.3 MPa, 90 s. Voltage: −30 kV. Detection at 200 nm.
Table 4.
Effect of buffer concentration in the mobile phase on column efficiency for peptides. Conditions: Mobile phase: 40% acetonitrile in Tris-phosphate buffer pH 2.5; column: HA-BDDA-AETA monolith, total length 33.5 cm, active length 25 cm, i.d. 75 µm, voltage −30 kV.
| Cbuffer | Column efficiency, plates/column | ||
|---|---|---|---|
| mmol/L | val-tyr-val | methionine enkephalin | LHRH b) |
| 5 | 32,950 | 50,490 | 43,830 |
| 10 | 30,230 | 22,230 | 59,650 |
| 20 | 41,900 | 34,560 | 112,840 |
| 40 | 85,700 | 76,260 | 69,000 |
| 60 | 87,300 | 83,370 | 27,180 |
| 80 | 91,740 | 98,180 | - |
| 100 | 89,730 | 106,950 | - |
Buffer concentration in the complete mobile phase
Luteinizing hormone releasing hormone.
In contrast, the MALDI mass spectrum of the digest obtained without prior separation affords a sequence coverage of only 70%. Table 4 also indicates that despite the use of a rinsing step between the collection of each fraction, some peptides are carried over in the next fraction leading to the observation of identical peptides in multiple fractions. For example, the hydrophobic peptide representing residues 29–40 with a mass of 1168.4944 is detected in all three fractions.
4. Conclusions
This study demonstrates that an optimized poly(hexyl methacrylate-co-1,3-butenediol dimethacrylate-co-2-(acryloyloxy) ethyltrimethyl ammonium chloride) monolithic column enables excellent separations of a variety of compounds including benzene derivatives, bases such as substituted anilines and basic drugs, and peptide mixtures using a capillary electrochromatographic technique. The performance of the monolithic column depends on both their chemistry and their porous structure as well as the composition of the mobile phase. Therefore, a series of experiments enabling optimization of the mobile phase must be carried out to achieve the desired quality of separations of complex mixtures of peptides. Although this study only involved the separation of a tryptic digest of cytochrome c, it is likely that our optimized monolithic capillary column could be used for CEC separations involving a broad range of digests or peptide mixtures and thus may find numerous applications in the broad field of proteomic research. However, coupling the CEC system with a mass spectrometric detection system remains as a prerequisite for a broader application of this highly efficient separation method.
Figure 11.
Maldi-TOF mass spectra of peptides contained in the fractions shown in Fig. 10 collected after the CEC separation of cytochrome c digest. Asterisk marks peaks that could be assigned to a specific peptide
Table 5.
Peptide mass, fragment sequence and amino acid residues number for peptides found by MALDI TOF MS in fractions collected from the separated cytochrome C digest.
| Mass (MH+) | Fragment sequence | Amino acid residues |
|---|---|---|
| Fraction 1 | ||
| 964.4376 | R.EDLIAYLK.K | 93–100 |
| 1168.4944 | K.TGPNLHGLFGR.K | 29–39 |
| 1296.5469 | K.TGPNLHGLFGRK.T | 29–40 |
| 1434.5974 | K.HKTGPNLHGLFGR.K | 27–39 |
| 1456.5251 | K.TGQAPGFSYTDANK.N | 41–54 |
| 1584.577 | R.KTGQAPGFSYTDANK.N | 40–54 |
| Fraction 2 | ||
| 633.1224 | K.IFVQK.C | 10–14 |
| 779.3593 | K.MIFAGIK.K | 81–87 |
| 805.1588 | K.KYIPGTK.M | 74–80 |
| 1168.4944 | K.TGPNLHGLFGR.K | 29–39 |
| 1296.5469 | K.TGPNLHGLFGRK.T | 29–40 |
| 1306.5410 | K.GEREDLIAYLK.K | 90–100 |
| 1434.6292 | K.HKTGPNLHGLFGR.K | 27–39 |
| 1456.5088 | K.TGQAPGFSYTDANK.N | 41–54 |
| 1584.5770 | R.KTGQAPGFSYTDANK.N | 40–54 |
| 1633.4263 | K.IFVQKCAQCHTVEK.G | 10–23 |
| 2008.6123 | K.NKGITWGEETLMEYLENPK.K | 57–73 |
| Fraction 3 | ||
| 525.9872 | K.GGKHK.T | 24–28 |
| 561.0965 | K.KATNE. | 101–105 |
| 964.4376 | R.EDLIAYLK.K | 93–100 |
| 1168.4880 | K.TGPNLHGLFGR.K | 29–39 |
| 1296.5347 | K.TGPNLHGLFGRK.T | 29–40 |
| 1306.5227 | K.GEREDLIAYLK.K | 90–100 |
| 1434.6292 | K.HKTGPNLHGLFGR.K | 27–39 |
| 1456.4995 | K.TGQAPGFSYTDANK.N | 41–54 |
| 1584.5745 | R.KTGQAPGFSYTDANK.N | 40–54 |
ACKNOWLEDGEMENT
Support by grants of the National Institute of General Medical Sciences, National Institutes of Health (GM44885) is gratefully acknowledged. Characterization work at the Molecular Foundry was supported by the Director, Office of Science, Office of Basic Energy Sciences, Division of Materials Sciences and Engineering, of the U.S. Department of Energy under Contract No. DE-AC02-05CH11231.
Abbreviations
- HeA
hexyl acrylate
- AETA
2-(acryloyloxy)ethyltrimethyl ammonium chloride
- BDDA
1,3-butanediol diacrylate
- AIBN
2,2’-azobisisobutyronitrile
- DMPA
2,2-dimethoxy-2-phenylacetophenone
- LHRH
luteinizing hormone-releasing hormone
- MALDI TOF MS
matrix assisted laser desorption ionization time-of-flight mass spectrometry
References
- 1.Pretorius V, Hopkins BJ, Schieke JD. J. Chromatogr. 1974;99:23–30. [Google Scholar]
- 2.Jorgenson JW, Lukacs KD. J. Chromatogr. 1981;218:209. [Google Scholar]
- 3.Tsuda T, Nomura G, Nakagawa K. J. Chromatogr. 1982;248:241. [Google Scholar]
- 4.Deyl Z, Svec F, editors. Capillary Electrochromatography. Amsterdam: Elsevier; 2001. [Google Scholar]
- 5.Svec F, Fréchet JMJ. Anal. Chem. 1992;64:820–822. doi: 10.1021/ac00035a008. [DOI] [PubMed] [Google Scholar]
- 6.Peters EC, Petro M, Svec F, Fréchet JMJ. Anal. Chem. 1997;69:3646–3649. doi: 10.1021/ac970377w. [DOI] [PubMed] [Google Scholar]
- 7.Ericson C, Liao JL, Nakazato K, Hjertén S. J. Chromatogr. A. 1997;767:33–41. [Google Scholar]
- 8.Palm A, Novotny MV. Anal. Chem. 1997;69:4499–4507. [Google Scholar]
- 9.Hilder EF, Svec F, Fréchet JMJ. J. Chromatogr. A. 2004;1044:3–22. doi: 10.1016/j.chroma.2004.04.057. [DOI] [PubMed] [Google Scholar]
- 10.Zhang SH, Zhang J, Horvath C. J. Chromatogr. A. 2001;914:189–200. doi: 10.1016/s0021-9673(00)01113-4. [DOI] [PubMed] [Google Scholar]
- 11.Shediac R, Ngola SM, Throckmorton DJ, Anex DS, Shepodd TJ, Singh AK. J. Chromatogr. A. 2001;925:251–263. doi: 10.1016/s0021-9673(01)01036-6. [DOI] [PubMed] [Google Scholar]
- 12.Dulay MT, Quirino JP, Bennett BD, Zare RN. J. Sep. Sci. 2002;25:3–9. [Google Scholar]
- 13.Jin W, Fu H, Huang X, Xiao H, Zou HF. Electrophoresis. 2003;24:3172–3180. doi: 10.1002/elps.200305579. [DOI] [PubMed] [Google Scholar]
- 14.Li Y, Xiang R, Horvath C, Wilkins JA. Electrophoresis. 2004;25:545–553. doi: 10.1002/elps.200305767. [DOI] [PubMed] [Google Scholar]
- 15.Szucs V, Freitag R. J. Chromatogr. A. 2004;1044:201–210. doi: 10.1016/j.chroma.2004.05.103. [DOI] [PubMed] [Google Scholar]
- 16.Hilder EF, Svec F, Fréchet JMJ. Anal. Chem. 2004;76:3887–3892. doi: 10.1021/ac049732q. [DOI] [PubMed] [Google Scholar]
- 17.Okanda FM, El Rassi Z. Electrophoresis. 2005;26:1988–1995. doi: 10.1002/elps.200500073. [DOI] [PubMed] [Google Scholar]
- 18.Adu JK, Lau SS, Watson DG, Euerby MR, Skellern GG, Tettey JNA. Electrophoresis. 2005;26:3445–3451. doi: 10.1002/elps.200500108. [DOI] [PubMed] [Google Scholar]
- 19.Zhong H, El Rassi Z. J. Sep. Sci. 2006;29:2023–2030. doi: 10.1002/jssc.200600075. [DOI] [PubMed] [Google Scholar]
- 20.Lazar IM, Li L, Yu Y, Karger BL. Electrophoresis. 2003;24:3655–3662. doi: 10.1002/elps.200305609. [DOI] [PubMed] [Google Scholar]
- 21.Tegeler T, Mechref Y, Boraas K, Reilly JP, Novotny MV. Anal. Chem. 2004;76:6698–6706. doi: 10.1021/ac049341b. [DOI] [PubMed] [Google Scholar]
- 22.Zhang M, El Rassi Z. J. Proteome Res. 2006;5:2001–2008. doi: 10.1021/pr060185u. [DOI] [PubMed] [Google Scholar]
- 23.Viklund C, Ponten E, Glad B, Irgum K, Horsted P, Svec F. Chem. Mater. 1997;9:463–471. [Google Scholar]
- 24.Yu C, Svec F, Fréchet JMJ. Electrophoresis. 2000;21:120–127. doi: 10.1002/(SICI)1522-2683(20000101)21:1<120::AID-ELPS120>3.0.CO;2-H. [DOI] [PubMed] [Google Scholar]
- 25.Laemmerhofer M, Tobler E, Lindner W. J. Chromatogr. A. 2000;887:421–437. doi: 10.1016/s0021-9673(99)01329-1. [DOI] [PubMed] [Google Scholar]
- 26.Rohr T, Hilder EF, Donovan JJ, Svec F, Fréchet JMJ. Macromolecules. 2003;36:1677–1684. [Google Scholar]
- 27.Rohr T, Ogeltree DF, Svec F, Fréchet JMJ. Adv. Funct. Mater. 2003;13:265–270. [Google Scholar]
- 28.Augustin V, Jardy A, Gareil P, Hennion MC. J. Chromatogr. A. 2006;1119:80–87. doi: 10.1016/j.chroma.2006.02.057. [DOI] [PubMed] [Google Scholar]
- 29.Ngola SM, Fintschenko Y, Choi WY, Shepodd TJ. Anal. Chem. 2001;73:849–856. doi: 10.1021/ac000839x. [DOI] [PubMed] [Google Scholar]
- 30.Yu C, Svec F, Fréchet JMJ. Electrophoresis. 2000;21:120–127. doi: 10.1002/(SICI)1522-2683(20000101)21:1<120::AID-ELPS120>3.0.CO;2-H. [DOI] [PubMed] [Google Scholar]
- 31.Geiser L, Eeltink S, Svec F, Fréchet JMJ. J. Chromatogr. A. 2007;1140:140–146. doi: 10.1016/j.chroma.2006.11.079. [DOI] [PMC free article] [PubMed] [Google Scholar]
- 32.Bedair M, El Rassi Z. J. Chromatogr. A. 2003;1013:35–45. doi: 10.1016/s0021-9673(03)01031-8. [DOI] [PubMed] [Google Scholar]
- 33.Rathore AS, Wen E, Horvath C. Anal. Chem. 1999;71:2633–2641. doi: 10.1021/ac9900735. [DOI] [PubMed] [Google Scholar]
- 34.Gusev I, Huang X, Horvath C. J. Chromatogr. A. 1999;855:273–290. doi: 10.1016/s0021-9673(99)00697-4. [DOI] [PubMed] [Google Scholar]
- 35.Progent F, Augustin V, Tran NT, Descroix S, Taverna M. Electrophoresis. 2006;27:757–767. doi: 10.1002/elps.200500396. [DOI] [PubMed] [Google Scholar]
- 36.Archie GE. Trans. Am. Ind. Mining Met. Engrs. 1942;146:54–62. [Google Scholar]
- 37.Rathore AS, Horvath C. Electrophoresis. 2002;23:1211–1216. doi: 10.1002/1522-2683(200205)23:9<1211::AID-ELPS1211>3.0.CO;2-B. [DOI] [PubMed] [Google Scholar]
- 38.Rathore AS, Li Y, Wilkins JA. J. Chromatogr. A. 2005;1079:299–306. doi: 10.1016/j.chroma.2005.03.050. [DOI] [PubMed] [Google Scholar]
- 39.Delaunay-Bertoncini N, Demesmay C, Rocca JL. Electrophoresis. 2004;25:3204–3215. doi: 10.1002/elps.200305975. [DOI] [PubMed] [Google Scholar]
- 40.Peters EC, Petro M, Svec F, Fréchet JMJ. Anal. Chem. 1998;70:2288–2295. doi: 10.1021/ac9713518. [DOI] [PubMed] [Google Scholar]
- 41.Rathore AS. Electrophoresis. 2002;23:3827–3846. doi: 10.1002/elps.200290004. [DOI] [PubMed] [Google Scholar]
- 42.Rathore AS, McKeown AP, Euerby MR. J. Chromatogr. A. 2003;1010:105–111. doi: 10.1016/s0021-9673(03)00971-3. [DOI] [PubMed] [Google Scholar]
- 43.Bedair M, El Rassi Z. J. Chromatogr. A. 2003;1013:47–56. doi: 10.1016/s0021-9673(03)01032-x. [DOI] [PubMed] [Google Scholar]


